


Digital reading of the NFT ecological development of mainstream public chains: the monthly transaction volume of Ethereum has shrunk by 80%


NFT has now developed into one of the "twin carriages" that drive the development of the industry side by side with DeFi. If you look back at its development process in the past year or so, you can clearly see a path from "one public chain + multiple fields" to " Multiple public chains + multiple domains" diffusion path. In the early NFT craze started from Ethereum, the active fields gradually expanded from encrypted art to games, avatars, sports, etc. Now NFT has overflowed from Ethereum to Solana, BSC, Polygon and other public chains to flourish.
Although the entire encryption market has experienced a violent downward trend since April this year, the popularity of NFT has not diminished. Against this background, what is the development of the NFT ecosystem of major public chains such as Ethereum, Solana, BSC, and Polygon? What are the characteristics of each?
In order to depict the multi-chain picture of NFT, the data news column PAData under PANews and the NFT data service provider NFTSCAN jointly analyzed the main data of NFT in each chain recently and found that:
1) The average number of daily active NFT projects of the four major public chains reached 19,400 this month, among which Polygon has the largest number of daily active projects, and the number of active projects has grown strongly since April, with an average monthly increase of more than 29% , while the number of BSC active projects dropped significantly during the same period.
2) As of July 21, the average daily active NFT assets of the four major public chains this month reached 1.5138 million, of which Polygon has the largest number. The overall increase in the number of assets on Ethereum and Solana both exceeded 40%.
3) The four major public chains have newly minted 24.8826 million NFTs this month, a decrease of 16.69% from April. Among them, Polygon and Ethereum have a large number of newly minted this month. The cumulative number of newly minted NFTs per month on Ethereum and Solana is generally on the rise.
4) As of July 21, the total NFT transaction volume of the four major public chains this month was approximately US$1.964 billion, a significant decrease of 80.80% from the US$10.228 billion in April. Ethereum is still currently the largest NFT market, with a total transaction volume of approximately US$1.731 billion this month, accounting for approximately 88.13% of the total.
5) As of July 21, the total number of NFT addresses currently held by the four major public chains is about 553,400. The number of NFT addresses held by Ethereum and Solana at the end of each month is relatively stable, with monthly average month-on-month changes of only 3.43% and 2.31%, and Polygon’s monthly average month-on-month change is the largest, reaching 16.76%.
6) X2Y2 is currently the largest secondary market on Ethereum, with a transaction volume of about 463 million US dollars this month, accounting for about 47% of the total. MagicEden is the largest secondary market on Solana, with a transaction volume of approximately US$48 million this month, accounting for approximately 96% of the total.
first level title
01
The average daily active NFT projects of the four major public chains this month are 19,400, and the average daily active NFT assets this month are 1,513,800
The average daily active NFT projects on the four major public chains of Ethereum, Solana, BSC, and Polygon reached 19,400 this month, among which Polygon has the largest number of daily active projects, with a total of 70.76 million, accounting for about 36% of the total. The second is Ethereum, with a total of about 6821, accounting for about 35% of the total. However, there are 3025 and 2490 on Solana and BSC respectively, accounting for about 16% and 13% of the total respectively, and the two do not account for the majority.
However, judging from the development trend since April, the number of daily active projects on Ethereum, Solana, and Polygon has maintained an overall growth trend, with monthly average increases of 5.73%, 9.77%, and 29.86%, respectively, among which Polygon has a strong upward trend. The average number of daily active projects on BSC experienced a sharp drop during this period. Especially in June, the average daily number of projects on BSC dropped from more than 20,000 to about 3,000, with a month-on-month drop of 85.70%. Month-on-month is still in a downward trend, with a month-on-month drop of 19.46%.
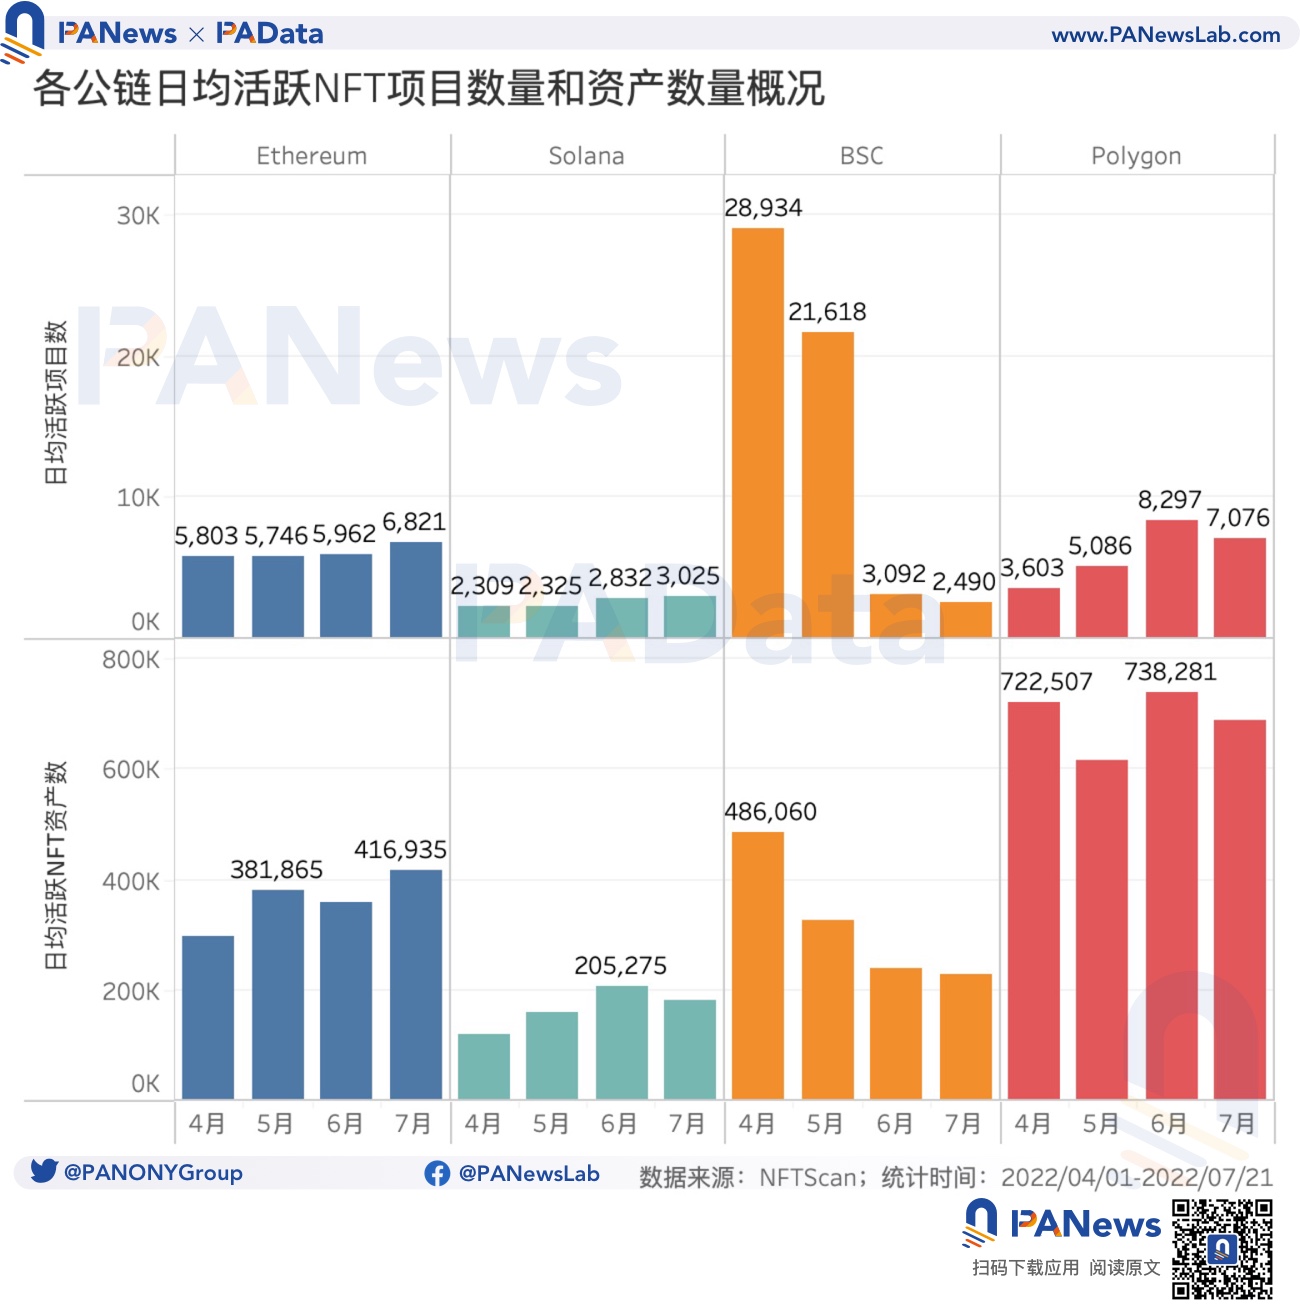
Judging from the number of daily active assets, the four major public chains have an average of 1.5138 million daily active NFTs this month, of which Polygon has the most active NFTs, with an average daily average of 687,700 in July, accounting for about 45% of the total. Far more than other public chains. This is followed by Ethereum, with a daily average of about 416,900 in July, accounting for about 28% of the total. In July, BSC and Solana had an average of 229,300 and 179,800, accounting for 15% and 12% of the total respectively.
first level title
02
The total number of addresses holding NFT this month exceeds 550,000, and Ethereum minting activities are still active
The number of newly minted NFTs and the total transaction volume are two important dimensions to measure the transaction activity of the NFT market. According to statistics, as of July 21, the four major public chains have newly minted 24.8826 million NFTs this month, a decrease of 16.69% from the cumulative new minting of 29.8674 million in April. Among them, Polygon has the largest number of new castings this month, with a total of about 12.97 million, accounting for about 52% of the total. This is followed by Ethereum, which newly minted 6.88 million this month, accounting for about 28% of the total. BSC and Solana newly minted 3.32 million and 1.72 million this month, accounting for about 13% and 7% of the total, respectively. From the trend point of view, in line with the changes in the monthly average daily NFT quantity, the accumulated new minted NFT quantity of Polygon and BSC also showed an overall downward trend, while Ethereum and Solana showed an overall upward trend.
From the ratio of the number of newly minted NFTs to the total number of active NFTs on that day, we can more intuitively understand the activity of the NFT ecology of each chain. Since April, the monthly average daily new minting ratios of Ethereum and Polygon have been above 70%, and some months have even exceeded 80%, while the monthly average daily new minting ratios of BSC and Solana have basically not exceeded 60%, and some months have even been lower at 50%. In terms of quantity and proportion, Ethereum’s new minting activity is the most active, which also means that the average activity of minted NFTs is low.

Affected by the sharp drop in various asset prices since April, the total amount of NFT transactions on each chain denominated in US dollars has also "shrunk" seriously. As of July 21, the total NFT transaction volume of the four major public chains this month was approximately US$1.964 billion, a significant decrease of 80.80% from the total of US$10.228 billion in April. Ethereum is still currently the largest NFT market, with a total transaction volume of approximately US$1.731 billion this month, accounting for approximately 88.13% of the total. Among the other three public chains, the total transaction volume of BSC this month is just over 100 million US dollars, while Solana and Polygon are both less than 100 million US dollars. Judging from the rate of decline, the overall decline of Ethereum and Solana has exceeded 80%, while the overall decline of BSC and Polygon is only about 20%, which may be related to the large trading volume base of the former two.
From the perspective of user activity, the number of addresses holding NFT is theoretically proportional to the number of users, so changes in the size of users can be seen from it. As of July 21, the total number of NFT addresses currently held by the four major public chains is about 553,400, of which Polygon has the largest number, with a total of 209,600, accounting for about 38% of the total. Followed by BSC and Ethereum, there are 143,300 and 125,100 respectively, accounting for about 26% and 23% of the total. Or it has something to do with the fact that Polygon and BSC, the two public chain ecosystems, have more GameFi NFTs.

first level title
03
X2Y2 is the secondary market with the largest transaction volume on Ethereum, and the user scale of OpenSea on Solana is growing rapidly
The secondary market provides liquidity for NFT and is an important part of realizing the value of NFT. However, at present, the secondary markets on Ethereum and Solana are developing well, while the secondary markets on BSC and Polygon are not fully developed. PAData selected the three secondary markets with the largest trading volume on Ethereum and Solana to observe the secondary flow of NFT.
According to statistics, as of July 21, the cumulative transaction volume of the three largest secondary markets on Ethereum this month was approximately US$982 million. According to this month’s data, the highest transaction volume of X2Y2 was approximately US$463 million, accounting for approximately 47% of the volume. OpenSea, which had been the market leader before, had a transaction volume of only about 372 million US dollars this month, accounting for about 38% of the total, and has dropped to the second place. The transaction volume of LooksRare this month is about 147 million US dollars, accounting for about 15% of the total, which is much lower than the previous two. From the trend point of view, the monthly transaction volume of OpenSea and LooksRare has experienced a sharp decline since April, with an overall decline of about 89% and 95% respectively, while the monthly transaction volume of X2Y2 has generally increased, with an increase of about 346%. This may be related to the transaction mining incentives that are still in progress.
The cumulative transaction volume of the three largest secondary markets on Solana this month is approximately US$50 million, which is only about 5% of that of Ethereum in the same period, and the scale of the secondary market is much smaller. Among them, MagicEden is currently the largest secondary market on Solana, with a transaction volume of about 48 million US dollars this month, accounting for about 96% of the total, occupying an absolute dominant position. Among other secondary markets, OpenSea's transaction volume this month is only one million US dollars, while SolanaArt is almost negligible.

However, from the perspective of user scale, the situation is different. As of July 21, the total number of addresses in the three secondary markets with the largest trading volume on Ethereum has reached about 1.11 million, of which OpenSea currently has 1.057 million addresses, accounting for more than 95% of the total. It is the market with the largest number of users. X2Y2, which has the largest transaction scale, currently only has 40,000 addresses, accounting for less than 4% of the total. LooksRare currently has fewer addresses, only 13,000, accounting for about 1% of the total. However, the changes in the addresses of the three markets are consistent with the changes in the transaction volume. The number of addresses at the end of each month of OpenSea and LooksRare has generally shown a downward trend since April, and the former has continued to decline. Only X2Y2 has an overall increase in the number of addresses at the end of each month.
The current total number of addresses in the three largest secondary markets on Solana is about 569,000, which is about 51% of that of Ethereum in the same period. The gap between the two is significantly narrower than the transaction volume, which means that the number of users in the NFT secondary market on Solana has reached about half of that on Ethereum, but the average secondary market price of a single NFT is far lower than that on Ethereum.
first level title
04
Old projects occupy the Ethereum market, and new projects on Solana rise faster
In order to compare the NFT ecology of each public chain at a more microscopic level, PAData selected five NFT projects with the largest transaction volume in each public chain (hereinafter referred to as "top projects") for further observation. First of all, from the perspective of the average transaction price, affected by the downward trend in the prices of various risk assets, the average transaction price of most NFTs is also in a downward trend. Since NFTs are mostly denominated in public chain tokens, the decline in legal currency is even greater.
For example, the average transaction price of leading projects on Ethereum dropped from $117,800 in April to $56,200 in July, a drop of 52%. The top projects on BSC and Polygon were also in a downward trend during the same period, with a drop of 70% and 83% respectively. Relatively speaking, the average transaction price of the top projects on Ethereum has a smaller decline, and the ability to resist risks is stronger. It is also worth noting that the average transaction price of leading projects on Solana has increased during the same period, from $374 in April to $466 in July, an overall increase of about 25%. Among them, the average transaction price in May It even broke through the $1,000 mark. Moreover, three of Solana’s head projects are new projects, and the transaction time is only 2 months, which means that the development space left for new projects on Solana is larger than that of other public chains, especially Ethereum. The latter has almost become the world of NFT issuer Yuga Labs.
From the perspective of the average transaction price of individual projects, only four projects have achieved growth since April, namely Okay Bears, Primates and Sphynx Underground Society on Solana, with increases of 29%, 16% and 482% respectively. There is also ZED RUN Legacy on Polygon, which has an increase of 127%. In addition, the prices of other leading projects all fell during the same period, and there were 3 projects that fell by more than 80%, namely Star Sharks on BSC, Crypto Unicorns Land Market and Crypto Unicorns Market on Polygon. They are 80%, 88% and 99% respectively. It can be seen that even for top projects, the differentiation of price trends is very obvious.

Secondly, from the perspective of transaction volume, Ethereum’s first-mover advantage is still obvious. Its cumulative transaction volume from April to now has reached 2.475 billion US dollars, which is about 11 times that of Solana, 42 times that of BSC, and 60 times that of Polygon during the same period. However, judging from the trend, the total monthly transactions of the four major public chains have shown a downward trend since April. As of July 21, Ethereum fell from $590 million in April to $125 million since July, a drop of about 79%. During the same period, Solana, BSC and Polygon also fell by 84%, 94% and 77% respectively. In contrast, Ethereum and Polygon saw smaller declines in volume.

From the perspective of the transaction volume of individual projects, only Art Blocks on Ethereum has achieved a growth rate of 1.81% since April, and other projects have experienced negative growth over the same period. Among them, there are 9 projects with a drop of more than 90% in transaction volume, namely Brave Cat, Pancake Bunnies, Pancake Squad, Star Sharks on BSC; MutantApeYachtClub, Otherdeed on Ethereum; Crypto Unicorns Land Market, Crypto Unicorns Market and Okay Bears on Solana. However, it is still worth noting that Otherdeed recorded a transaction volume of US$1.1 billion in May when it was first launched, which is the project with the highest monthly transaction volume since April (for more analysis, please refer to "Data Analysis Boring Ape Otherside land, is it still worth buying after the secondary market is under pressure?"). It can be seen that the YugaLab ecological project has a strong ability to attract money.
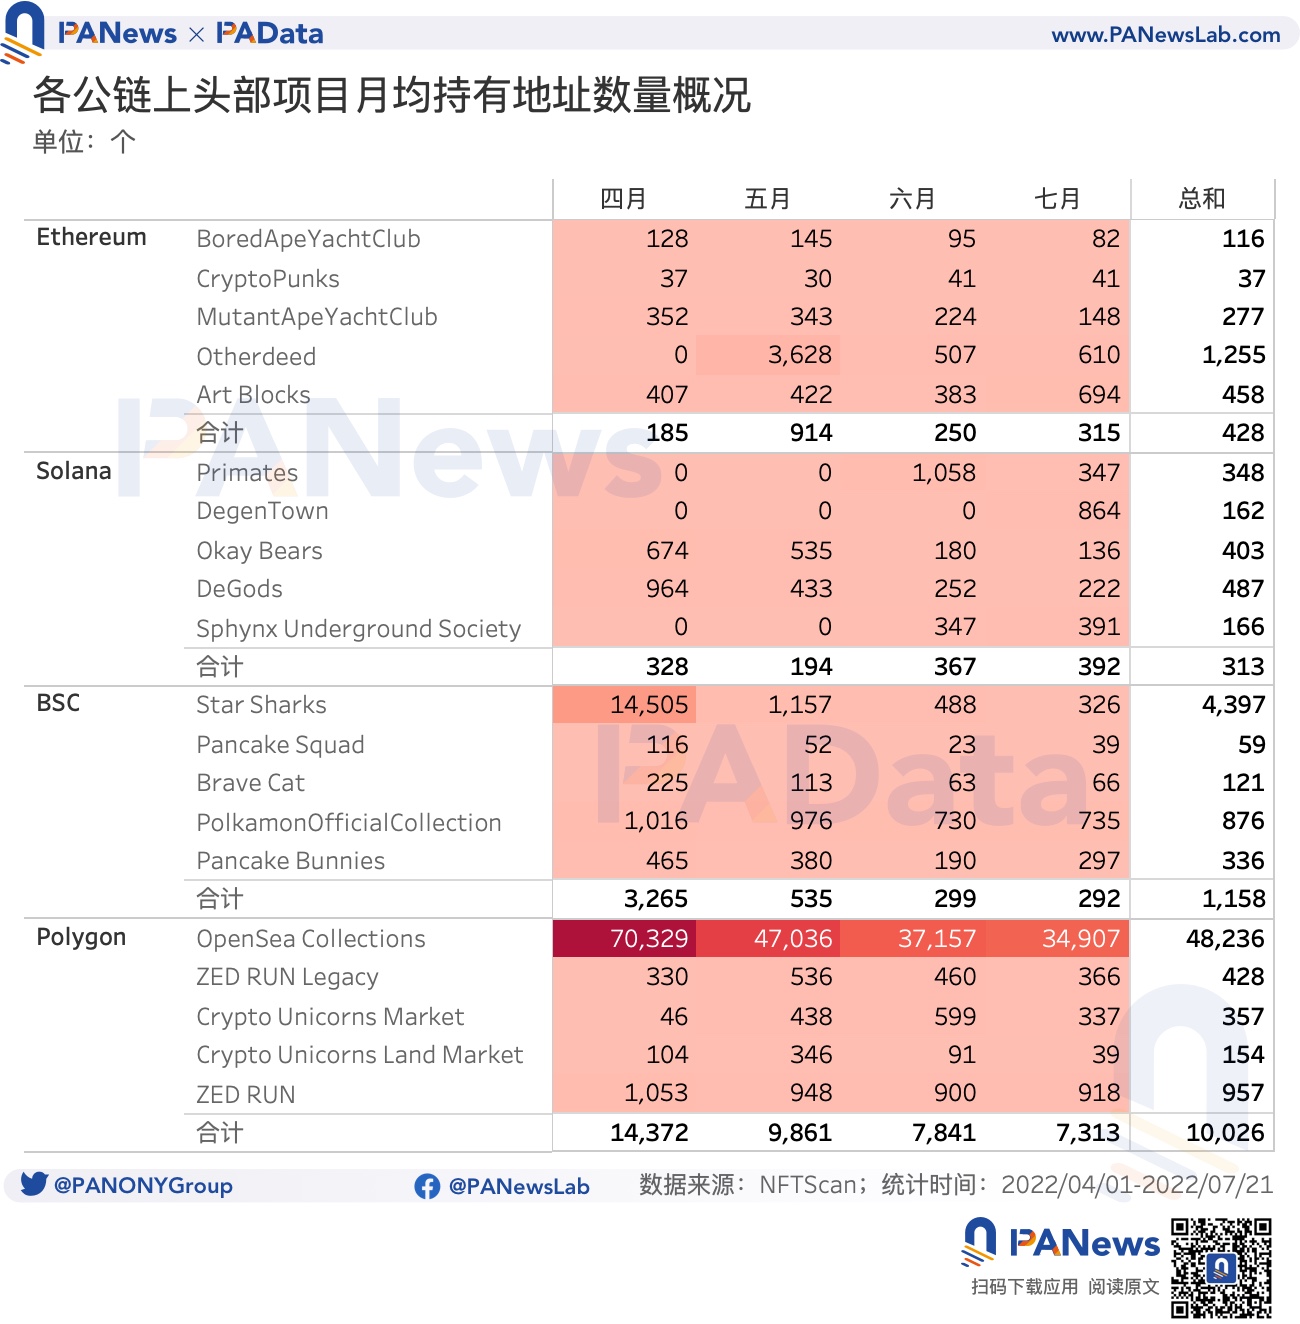
Finally, judging from the number of addresses holding NFT of leading projects, the number of addresses holding assets on Ethereum, Solana, and BSC is even smaller. The average number of daily addresses this month is only 315, 392, and 292 The number of addresses holding assets is the largest, and the average number of addresses this month has reached 7313. From the perspective of changing trends, since April, the number of addresses holding assets on Ethereum and Solana has increased slightly, achieving an increase of 70% and 20% respectively. Among them, the growth of Ethereum holding addresses is mainly due to the launch of Otherdeed. However, the number of addresses holding assets on BSC and Polygon has decreased by about 91% and 49% respectively.
From the perspective of changes in the number of addresses held by individual projects, only Art Blocks and CryptoPunks on Ethereum, Crypto Unicorns Market and ZED RUN Legacy on Polygon, and Sphynx Underground Society on Solana have achieved varying degrees since April. The growth of Art Blocks and Crypto Unicorns Market is higher, about 70% and 632% respectively. The number of addresses held by other projects has dropped significantly, and the largest drop is Star Sharks on BSC, reaching 98%.





