


Why do we say "2022 is the worst bear market in the history of digital assets"?


This article comes from GlassnodeThis article comes from
, the original author: UkuriaOC & Checkmate, compiled by Odaily translator Katie Ku.
In this article, we will use a number of indicators to measure the actual damage to Bitcoin and Ethereum holders, determine the severity of recent sell-off events and capital "capitulation events", and compare them with previous cycles. As a conclusion, we believe that 2022 will be the worst bear market in the history of digital assets.
secondary title
Bitcoin: Size and duration of the drop
First, let’s assess the size and duration of the current Bitcoin decline and compare it to history.
2018-19 is considered a bear market cycle. We will also analyze two phases of the 2021-22 bear market, one starting from April 14, 2021, many signals point to April as the start of the bear market, as the May 2021 sell-off appears to be due to bearish sentiment , as a large portion of "marginal" buyers and sellers are squeezed out; another from Nov. 8, 2021.
Historically bear market lows have often been marked by a -75% to -84% drop in BTC from its peak. The bear market lasted 260 days in 2019-20 and 410 days in 2015.
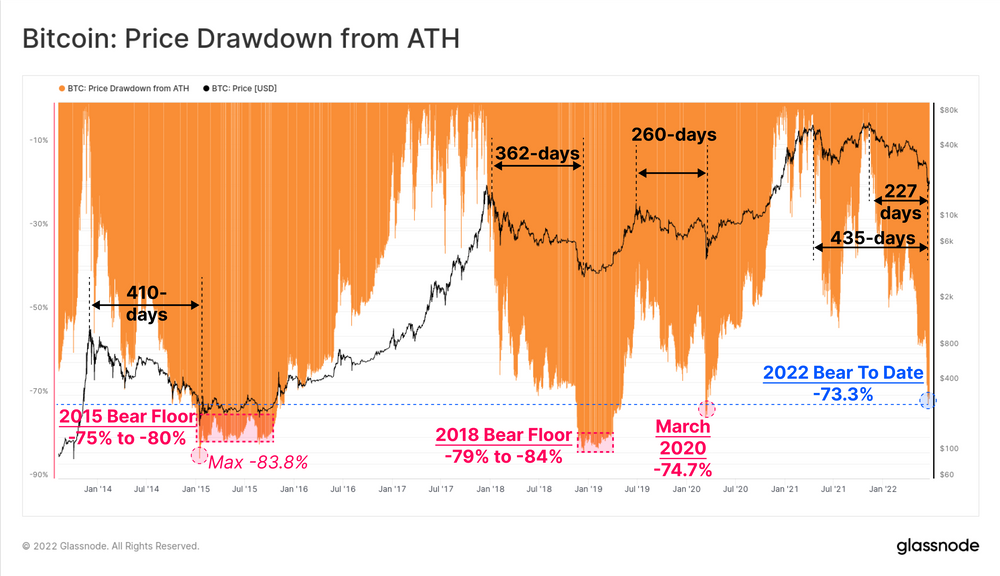
The current decline is -73.3% lower than the highest price in November 2021, and the duration is between 227 and 435 days. This round of bear market is now fully within the size and duration of historical norms.
Mayer Multiple is one of the most widely used indicators in technical analysis. The 200-day moving average is often used to mark breakout points between bull/bear markets.
A bear market is when the price is below the 200-day moving average;
A bull market is when prices are above the 200-day moving average.
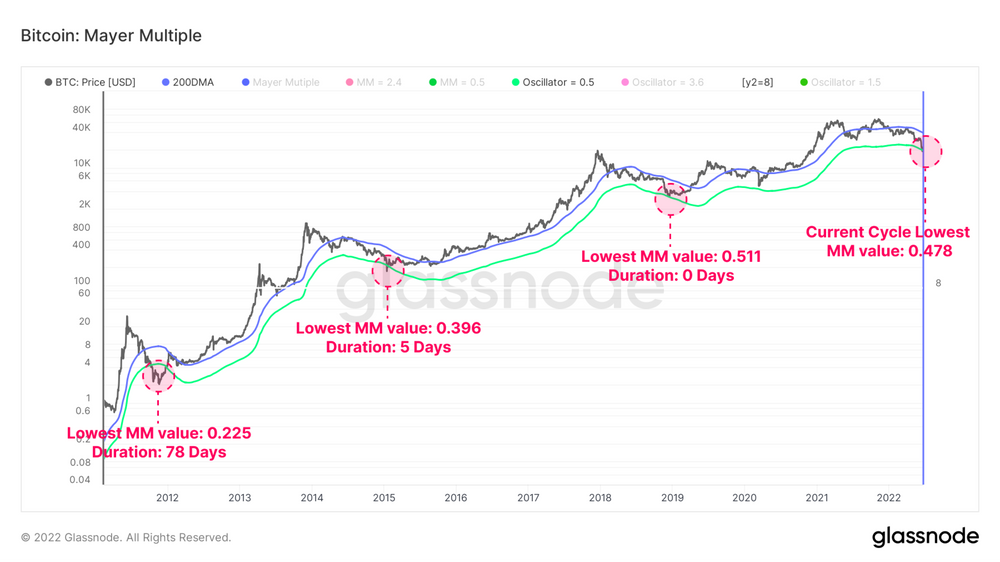
For the first time in history, the MM (Meyer Multiple) value (0.487) for the 2021-22 cycle is lower than the previous cycle low (0.511). Of the 4160 trading days, only 84 (2%) had closing scores below 0.5. The chart below is the price range, corresponding to the green MM value of 0.5, and the number of days below that value historically.
secondary title
Changes in the Fundamental Value of Bitcoin
Assessing the realized price of Bitcoin through on-chain analysis allows for the measurement of capital outflows and realized losses of investors.
Realized prices will rise as investors buy accumulated tokens at lower prices and revalue them higher. This is typical of a bull market and profit-taking;
As investors purchase accumulated tokens at higher prices, realized prices will fall, reflecting net capital outflows. This is a typical bear market and capitulation of market capital.
It is not common for spot prices to fall below realized prices, and the current market is the third time in the past six years. The two most recent events were the COVID-19 crisis in March 2020 and the market capitulation event in November 2018, both of which bottomed out the bear market cycle.
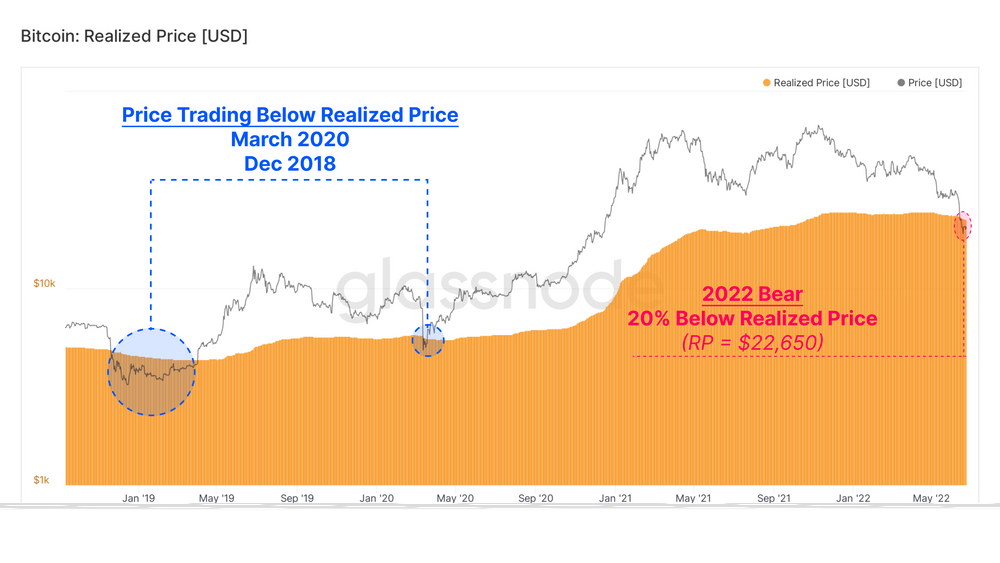
Spot prices are currently trading at an 11.3% discount to actual prices, meaning market participants are now on average less positioned than expected.
Next using the MVRV ratio, comparing the ratio of market value to realized value, one can visualize large deviations from the mean.
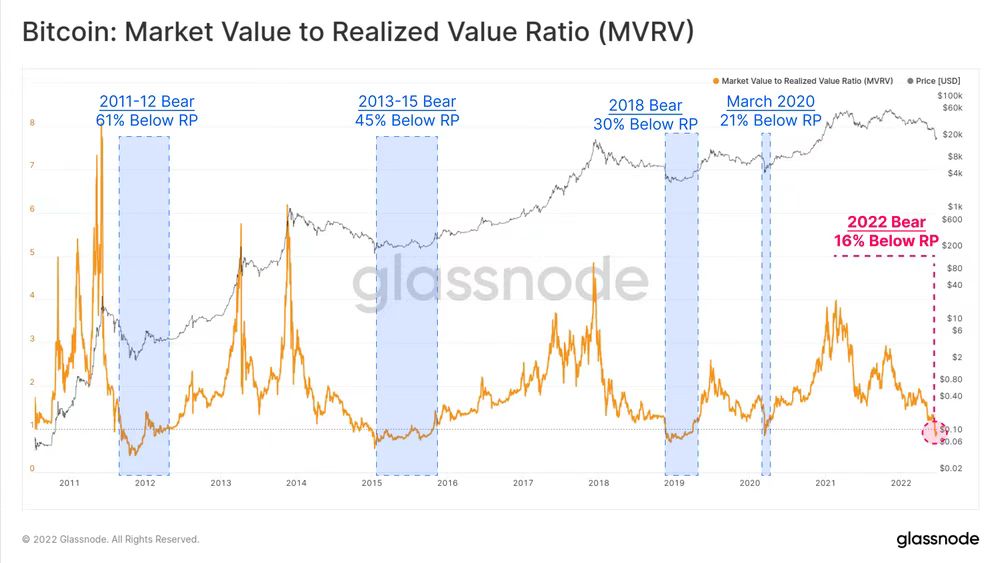
The blue area in the figure below, where the spot price is lower than the realized price. These events accounted for 604 of the 4160 trading days, or just 13.9% of the trading days.
The upper level of the realized price is the realized upper limit, which is the total amount of all tokens (BTC) multiplied by the price stamp at the time of the last transaction. This metric provides a perspective into the intrinsic value stored in the network.BTC is currently experiencing the largest capital outflow event in history.
secondary title
lock loss
Assessing the scale of losses measures how network participants respond to uncertainty and economic distress.
The Net Realized Profit/Loss metric reflects the net capital flows contributed by tokens spent by investors on any given day. The recent price crash into the $20,000 region saw the largest real daily loss in USD terms in history. Investors locked in a total loss of -$4.234 billion in one day, up 22.5% from the record of $3.457 billion set in mid-2021.
As the Bitcoin market matures, the size of the potential loss (or profit) in dollar terms will naturally increase as the network grows. Even on a relative basis, that doesn't lessen the severity of the $4 billion-plus net loss.
Measuring net realized profit/loss per unit of BTC, effectively normalizing market size, currently records realized losses equivalent to -98566 BTC per day (0.52% of circulating supply). The 2011 bear market and March 2020 saw only two sessions with large realized losses.
Two main points:
The spot price of BTC is much lower than the realized price, indicating that the average holdings of market investors are lower than expected;
The actual spending behavior resulted in a large historic net loss.
Next, further evidence is provided for quantifying the severity of the 2022 bear market through a normalized view of capital inflows and outflows relative to market size.
Evaluate the ratio between the average monthly loss transfer volume and profit transfer volume. Transfer volume refers to the amount of tokens moving on-chain on any given day.
In the crash triggered by Luna in May 2022, the loss ratio reached 2.3 times. The volume of lost trades increased by 2.3 times compared to the amount of profit. Such a one-sided market is not common, and such a high percentage of distressed volume suggests a major investor "capitulation" event is taking place.
Summarizing the 2021-22 Bitcoin bear market, we conclude:
The price has fallen to -73.3% of the highest price, which is consistent with the upper limit of the previous bear market low;
Duration between 227 and 435 days, depending on when the bear market started;
According to statistics, the realized ceiling of the market saw the largest monthly decline in its history;
It can be judged that the Bitcoin bear market of 2021-22 is one of the worst bear markets in history, both in terms of its severity, depth, and the scale of capital outflows and losses realized by investors.
secondary title
state of ethereum
The price of the second-largest digital asset ethereum is not unscathed either, with its price also falling below the $14,000 mark in the 2018 cycle. With two major digital assets trading below cycle highs.
Like Bitcoin, all investors who bought Ethereum in 2021-22 are currently holding unrealized losses. A large part of this downward trend is driven by massive deleveraging in the DeFi ecosystem.
By comparing the rate of change of Ethereum’s market capitalization to Bitcoin’s, it is possible to compare the relative performance and dominance of the two major assets.
Bitcoin dominance (high value) indicates Bitcoin dominance, an uptrend indicates general capital circulation is favorable for Bitcoin;
Ethereum Dominance (Low Value) indicates Ethereum Dominance, a downtrend indicates that the overall capital cycle is in favor of Ethereum, which is usually accompanied by further performance on the digital asset risk curve.
Since the peak in November 2021, Ethereum’s dominance has declined significantly and it is approaching the turning point. Historically, Bitcoin’s long-term outperformance has preceded the turning point. This highlights the overall state of the market's general risk-off sentiment, with Ethereum underperforming and Bitcoin tending to converge.
The graph below is an indicator of the value captured per blockchain byte on Ethereum. In theory, the value captured per byte of data on Ethereum, the leading smart contract platform, should increase as network effects improve (and vice versa).
Ethereum currently stores $0.3 per Byte. This is only 2x higher than the $0.15/Byte floor which has historically coincided with late bear markets and market lows. Showing that a further 50% drop is possible if history repeats itself.
ETH is also trading well below its 200-day moving average, with the Meyer multiple touching 0.37. This means that at the recent low, ETH was trading 63% below the 200 DMA (parallel difference indicator). Only 1.4% of the sessions saw large downside deviations.
The Mayer multiple ranges at 0.6, which represents a downside deviation level, below which about 10% of all trading days for ETH. During the 2018 bear market, ETH was below this range for 187 days during its worst price action. In the current market, ETH has been below this range since early June and is currently below this range for 29 days.
The Ethereum MVRV ratio is now reaching a negative deviation well below equilibrium, currently indicating that the market is holding a total of -33% unrealized losses. Because investors pull capital up on the risk curve, the ETH transaction cycle is longer and lower than the investor's cost basis.
MVRV has a current cycle low of 0.6 and has historically recorded only 277 days with a lower value, which equates to 11% of the trading history.
 In comparison, the average price per staked ETH is $2.4 million, more than double the current spot price. The total unrealized loss for ETH 2.0 stakers was 55%, compared to the average performance of ETH investors, which was 22%.
Monthly changes in realized caps via Ethereum, again indicating net capital outflows from the network. It can be seen that the recent downward price action was interrupted by two capital "capitulation" events:
December 2021: $5.4B in futures open interest in a deleveraging event closed in liquidation as ~$11.6B in capital outflows from Ethereum due to COVID-19 variants and initial Fed bond drawdown;
May-June 2022: The Luna crash and subsequent secondary deleveraging sent ripples throughout the digital asset ecosystem, resulting in ~$16 billion in capital outflows in ETH.
May-June 2022 is the largest monthly outflow in the history of the ETH asset.
Ethereum transaction profitability shows the average profit (positive, green) or loss (negative, red) realized by all transactions for the day.
In a bear market, the dominance of realized losses can be seen as accompanying price declines. In the current market, the average ETH trader realizes a -16.4% loss on the token they use. The last time trading profitability was this bad was at the depths of the bear market in 2018, when ETH was trading at $84.
Summarizing the Ethereum bear market in 2021-22, it is concluded that:
ETH fell -79.5% from its peak peak, putting this sell-off within the upper bounds of previous bear market bottoms;
BTC dominance is dominating capital flows, suggesting further underperformance of ETH over the next few months;
Ethereum’s value captured per Byte shows that capital efficiency is deteriorating;
The past 6 months have seen two of the largest capital destruction events in Ethereum history, with a combined net Realized Cap outflow of $27.6 billion;
The MVRV of both ETH and ETH 2.0 has fallen sharply, indicating that the average holder of ETH is holding large unrealized losses;





