Foresight Ventures Weekly Market Report: In the darkest stage of the bear market, institutions are liquidated by thunderstorms


market view
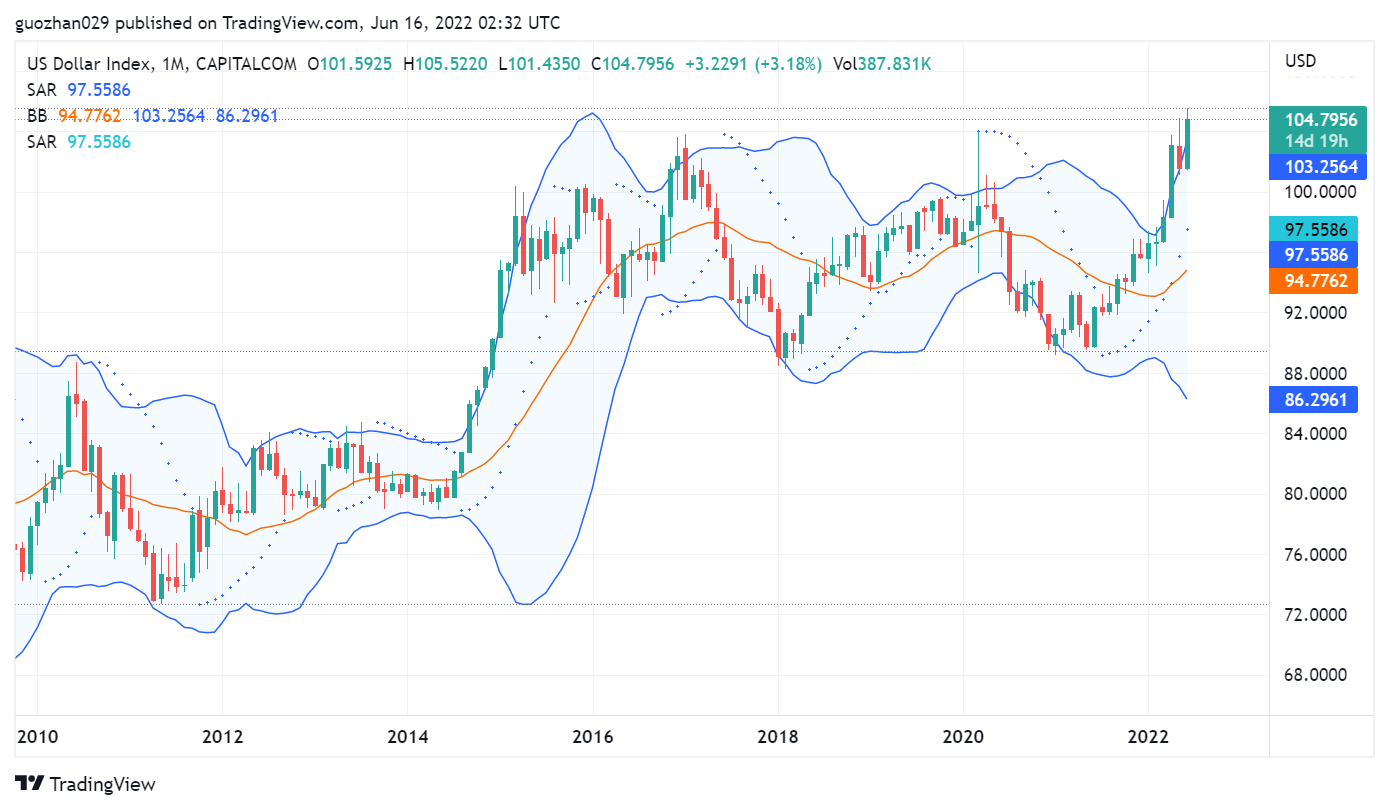
macro liquidity
secondary title
On-chain indicators
macro liquidity
On-chain indicators
BTC Long-Term Market Indicators
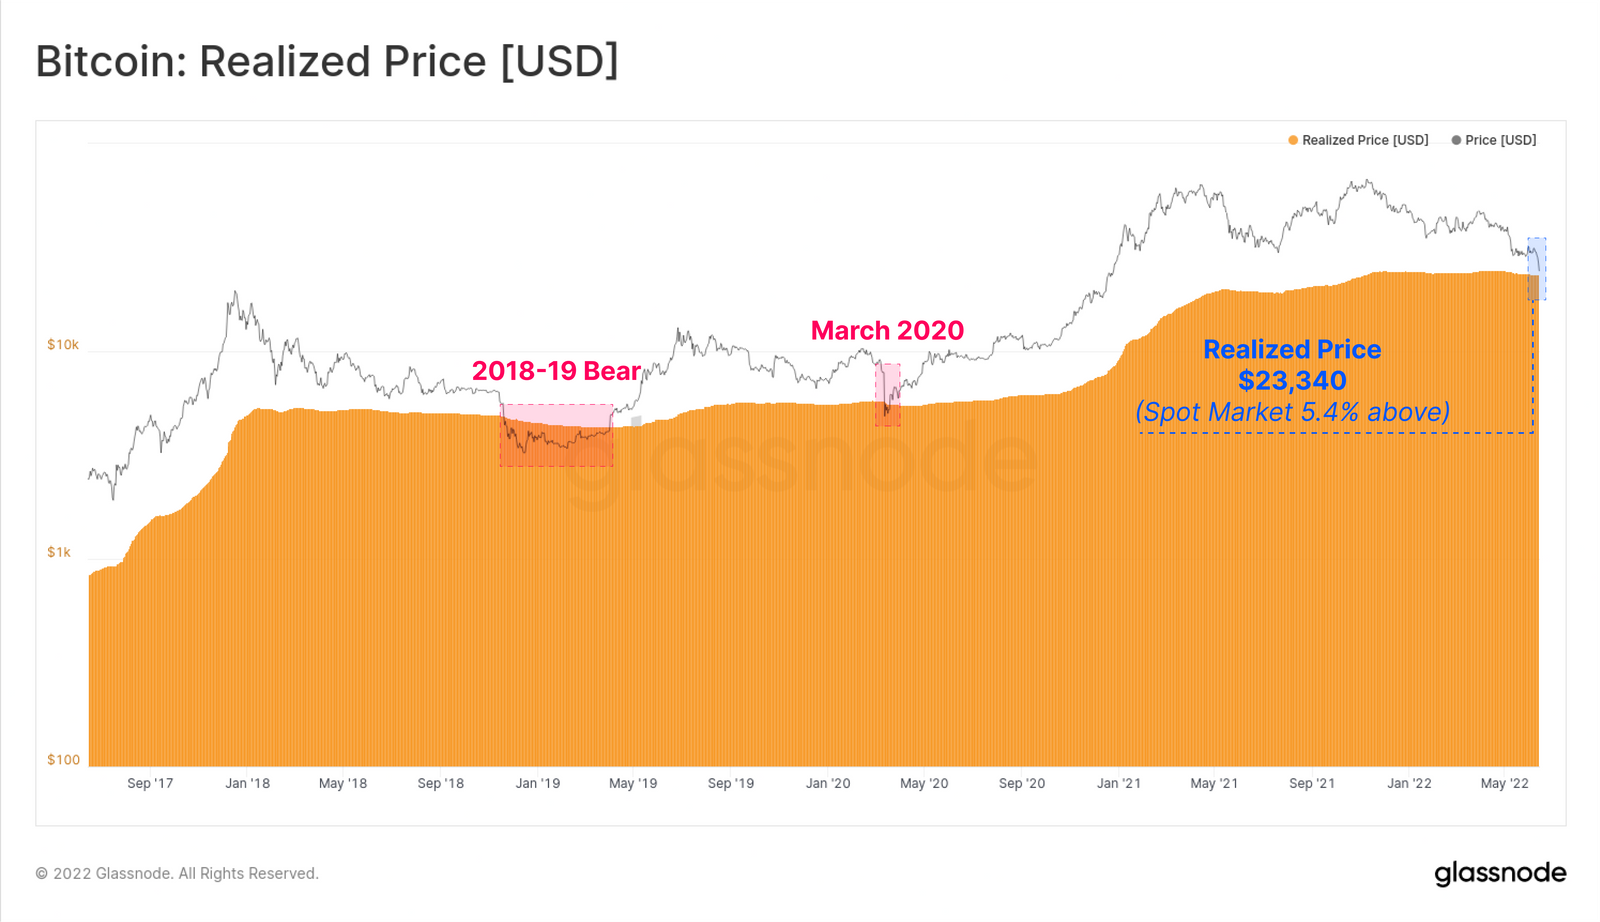
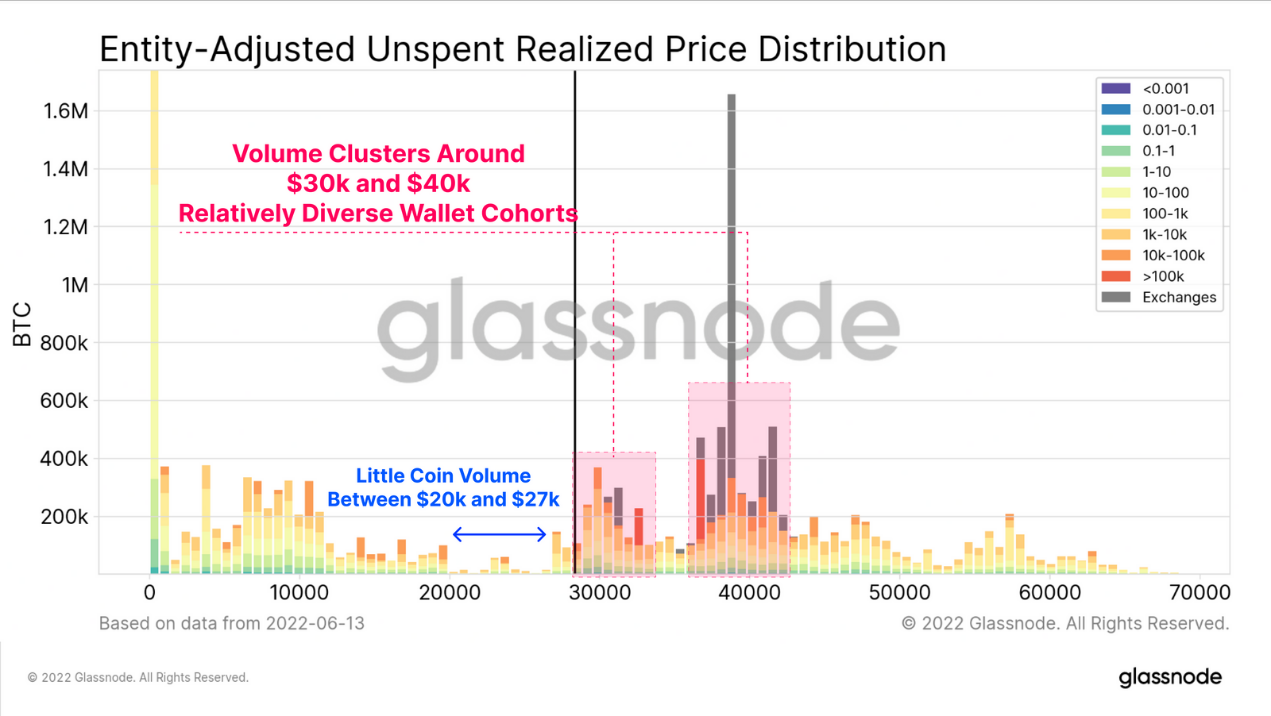
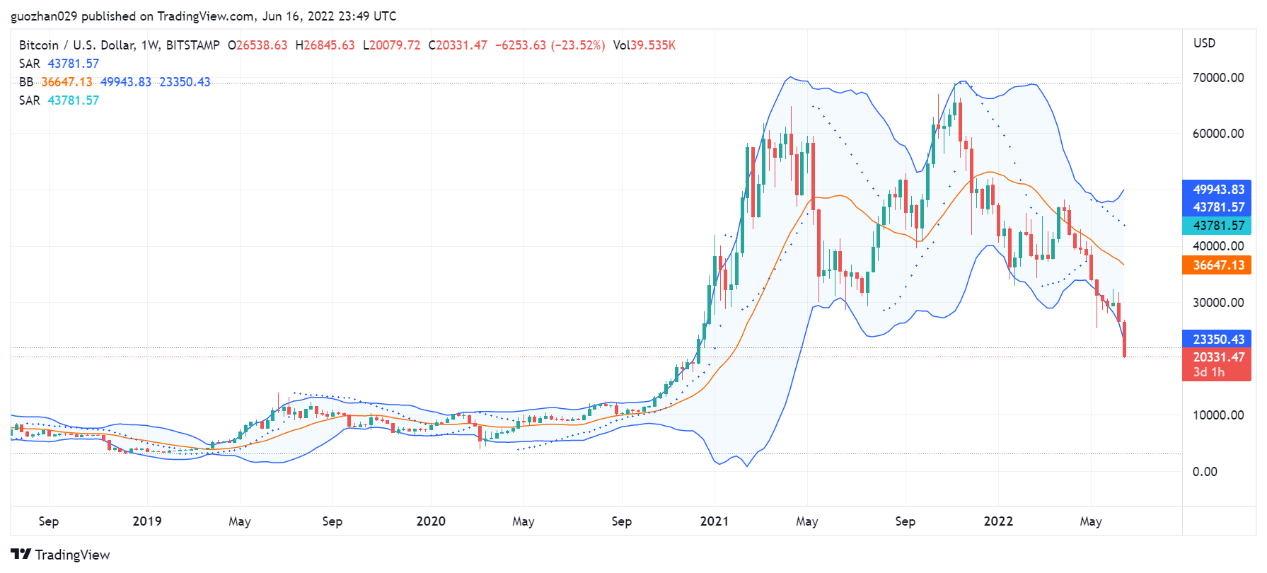
BTC barely maintains around the historical total cost of realized price (23430). BTC experienced a lot of supply changing hands in the 30,000-40,000 price range, yet there was little volume between the 20,000-27,000 price range, which could manifest as a high volatility zone with no support.
secondary title
BTC Long-Term Market Indicators
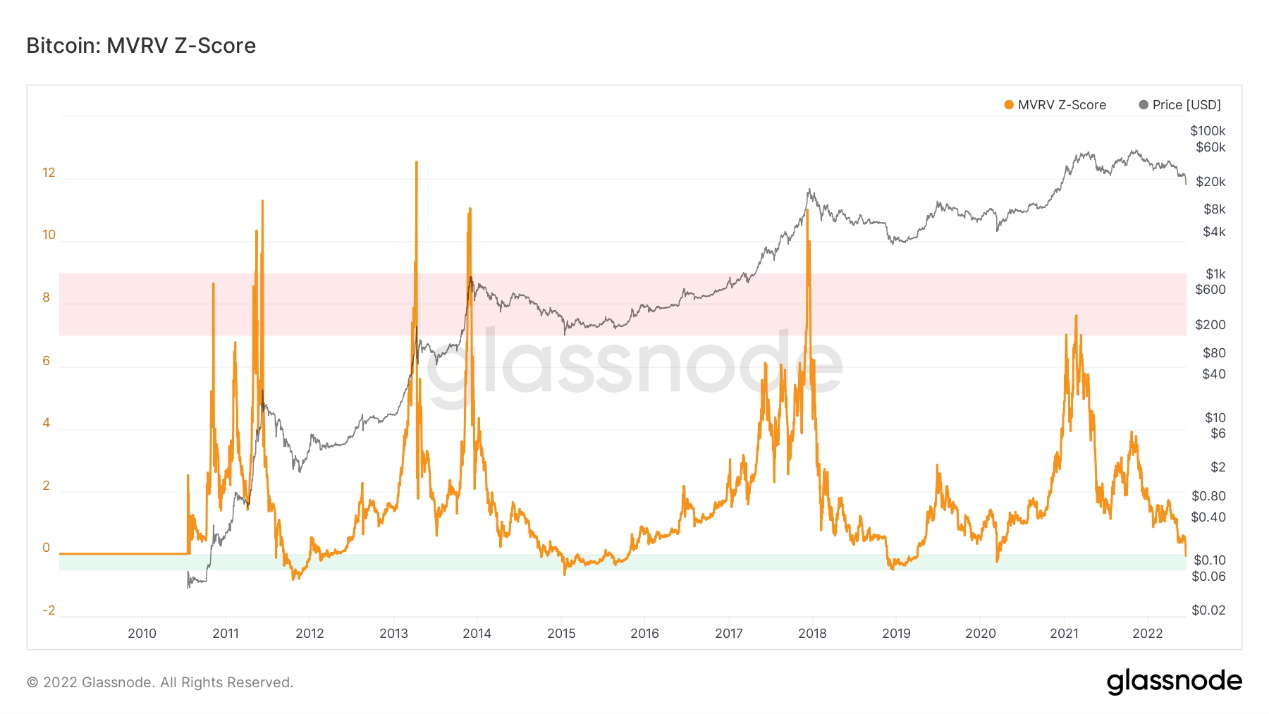
The long-term trend indicator MVRV-ZScore is based on the total market cost and reflects the overall profitability of the market. When the index is greater than 6, it is the top interval; when the index is less than 2, it is the bottom interval. The current indicator is 0.41, which has initially touched the green range of the historical bottom. Green zones tend to appear before the end of a bear market and can remain in this state for a period of time (from a few months in 2018 to a year in 2015) until the market strikes a final bottom.
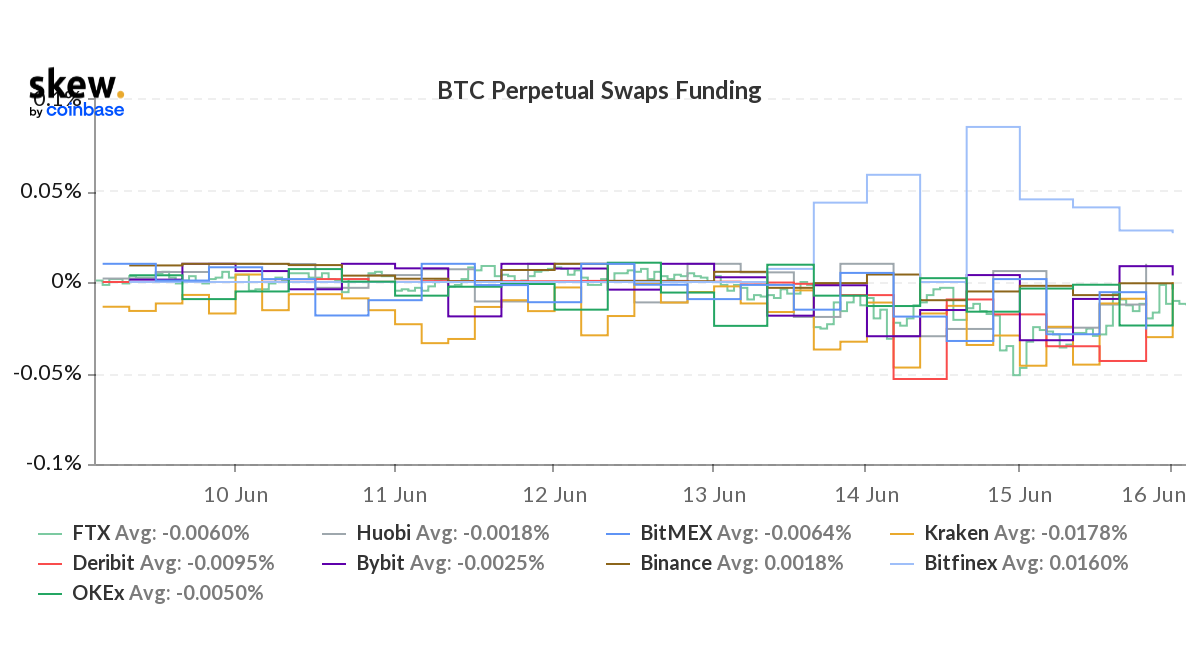
Futures funding rate: The funding rate has remained negative in recent days. The fee rate is 0.05-0.1%, with more long leverage, which is the short-term top of the market; the fee rate -0.1-0%, with more short leverage, is the short-term bottom of the market. The market panic is very serious, and the short-term bottom features are obvious.
BTC trend analysis
secondary title
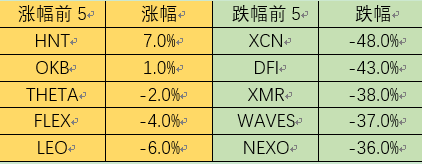
Top 100 plate rises and falls
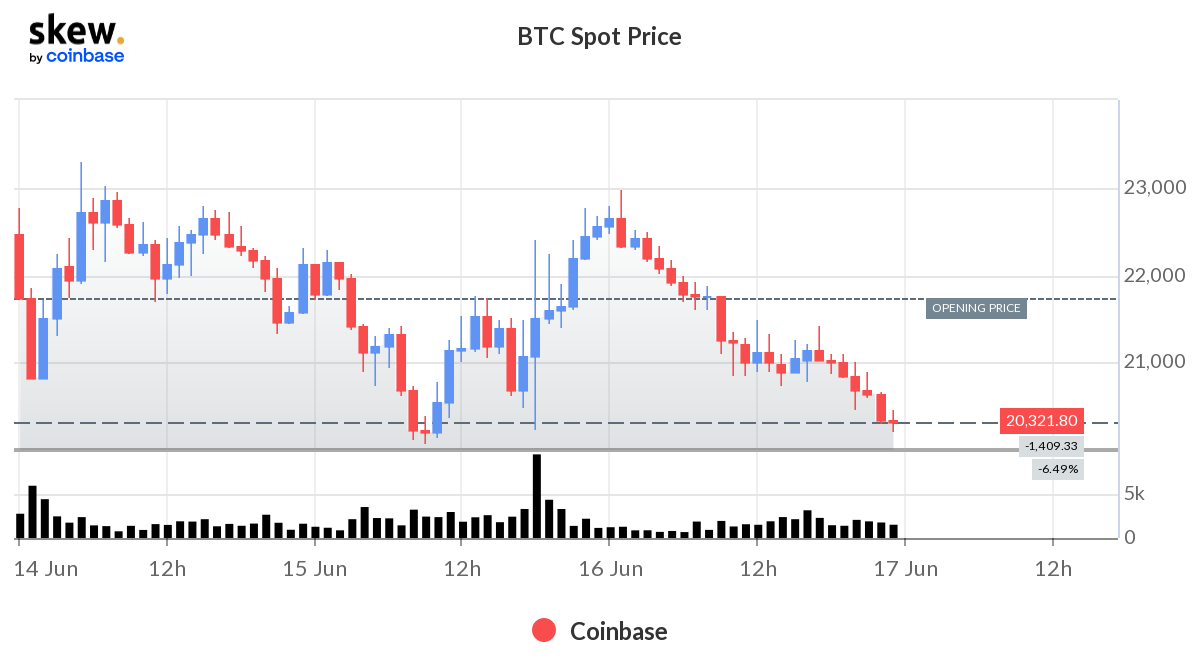
BTC fell sharply by 26% this week, and the market fell across the board. BTC is still in the state of accumulating funds, while ETH has directly returned to the state of selling, reflecting that the confidence in the current bottom-buying ETH has been seriously lacking. The recent rapid decline of ETH is caused by the stETH liquidity crisis of Lido, the ETH2.0 pledge settlement protocol. The U.S. financial platform Celsius, which holds a large amount of stETH, has fallen into a crisis of user trust; institutions led by SBF and Three Arrows Capital have also begun to sell and liquidate, which undoubtedly exacerbated market panic.
market data
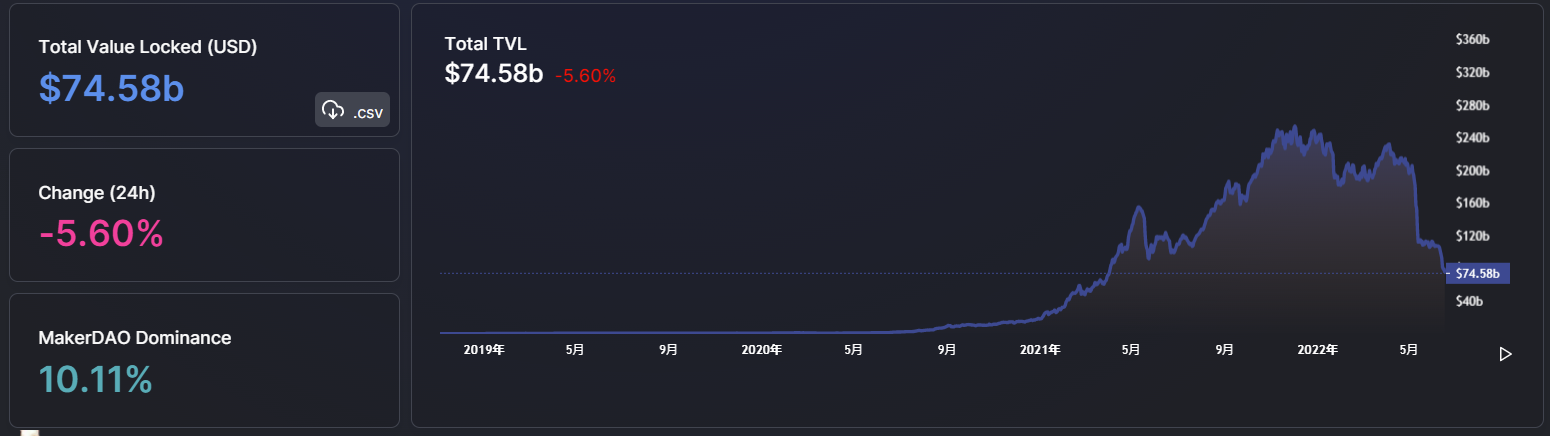
The total lock-up volume of the public chain
secondary title
Proportion of TVL of each public chain
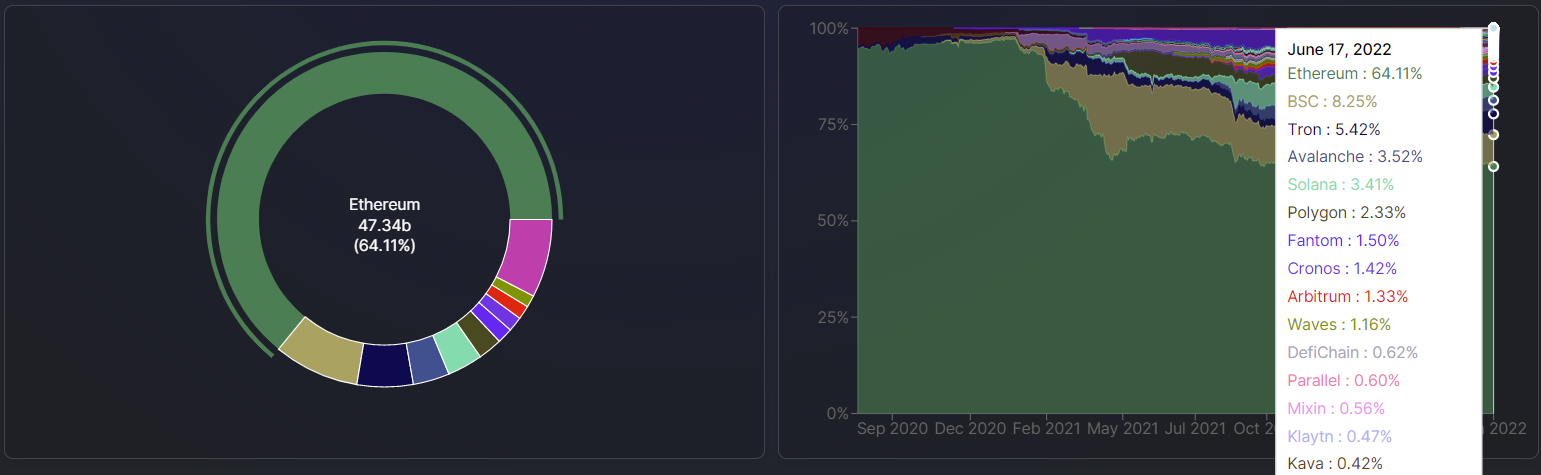
The lock-up amount of each chain agreement
The lock-up amount of each chain agreement
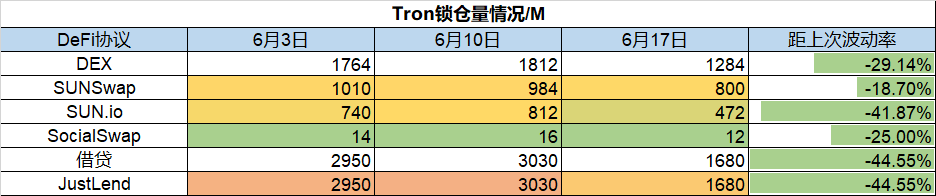
1. ETH lock-up volume
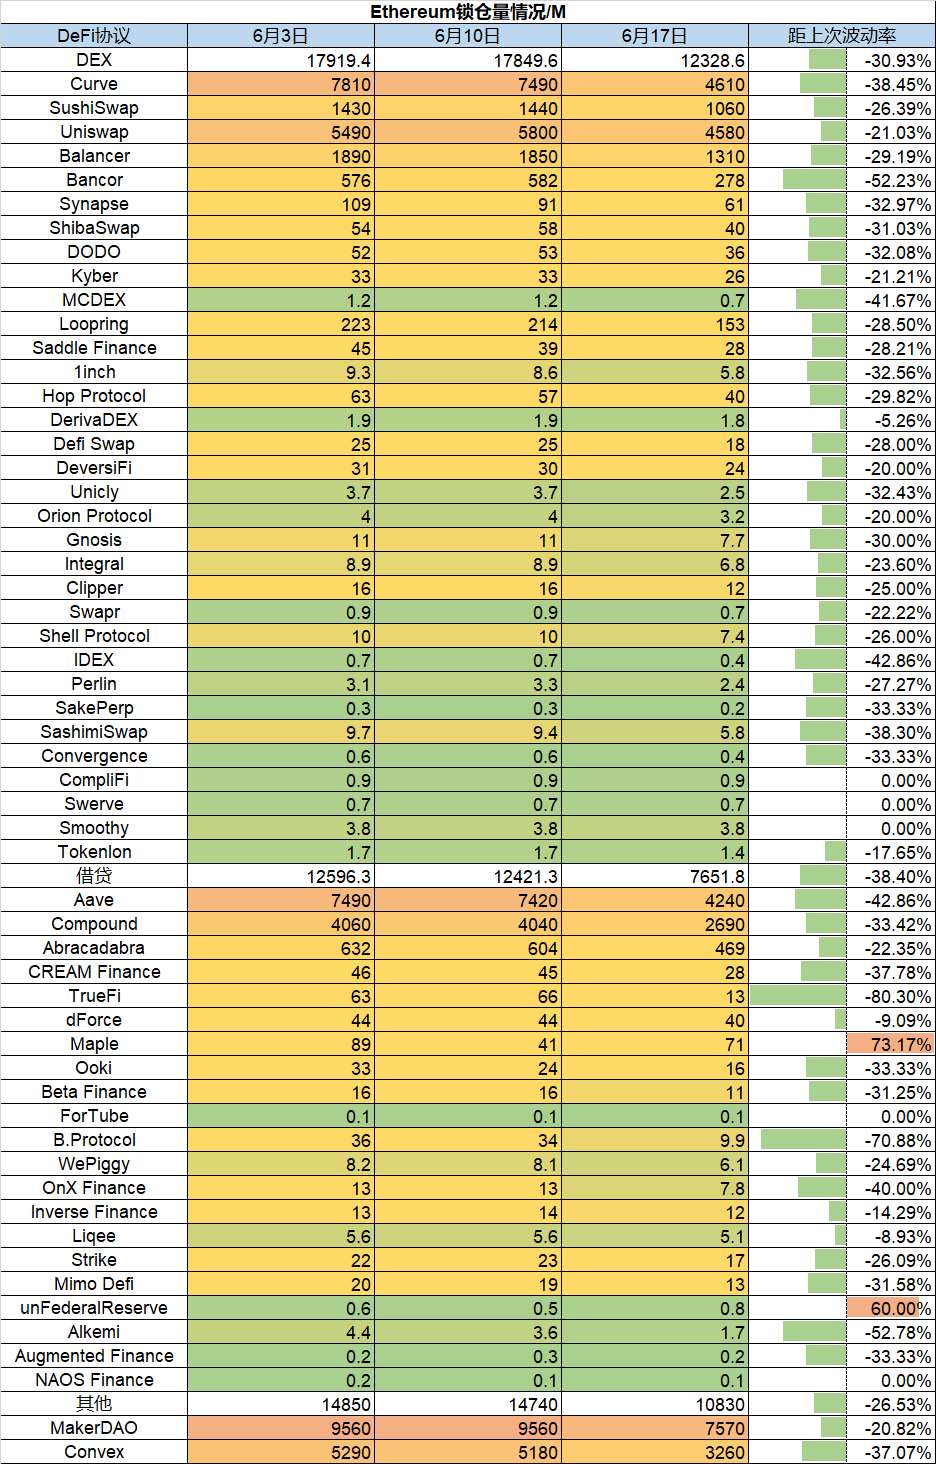
2. BSC lock-up volume
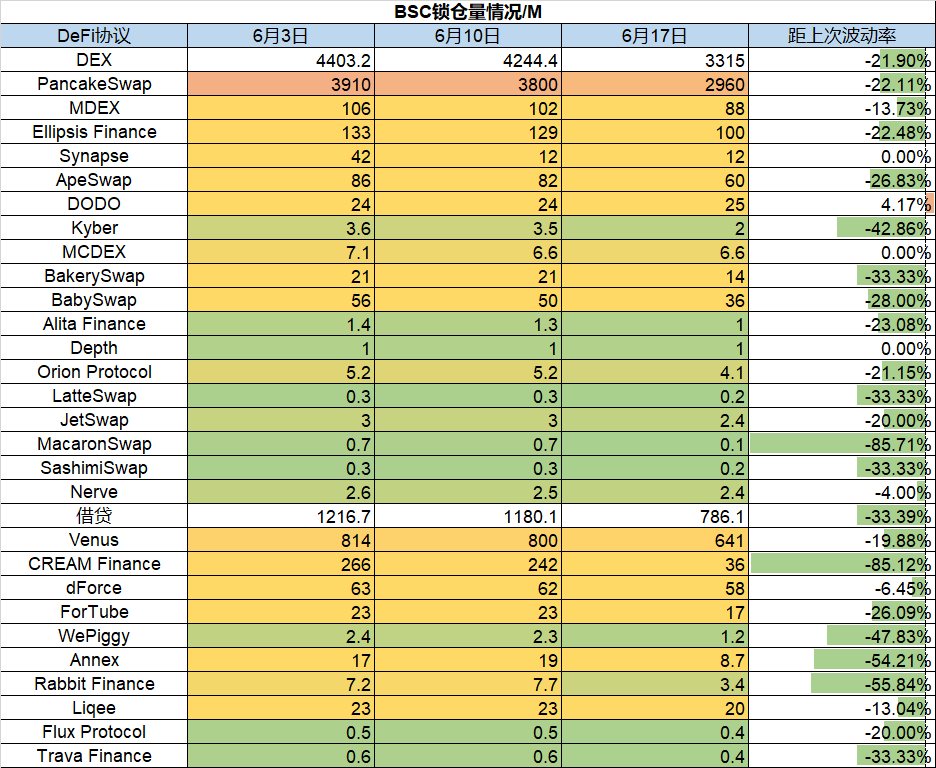
3. Tron lock-up volume
4. Solana lock-up volume
1. ETH lock-up volume
3. Tron lock-up volume
7. Fantom lockup volume
4. Solana lock-up volume
7. Fantom lockup volume
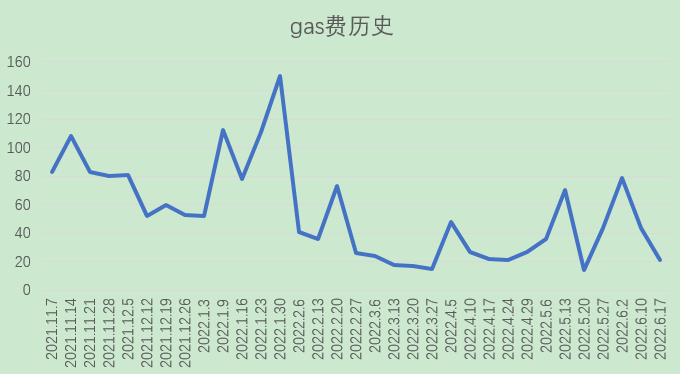
History of ETH Gas fee
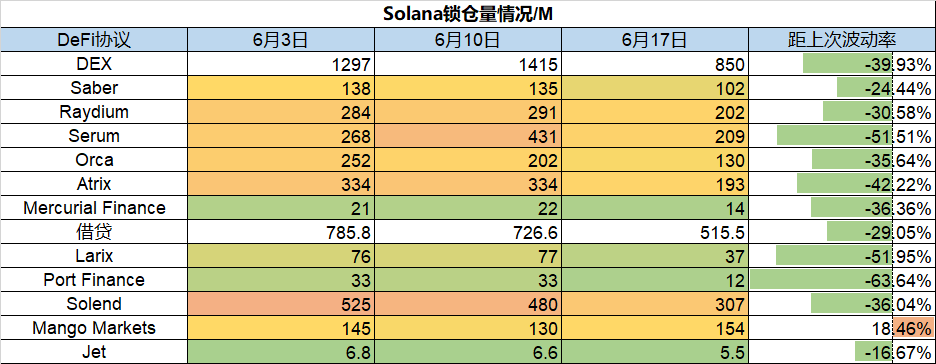
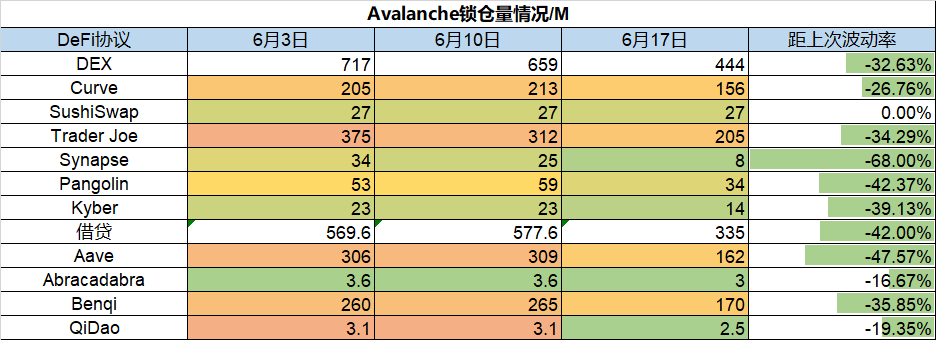
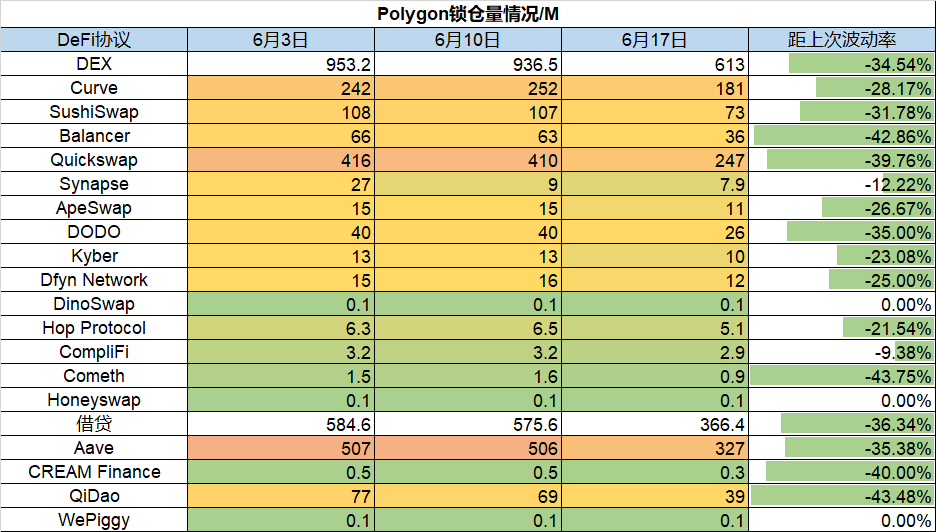
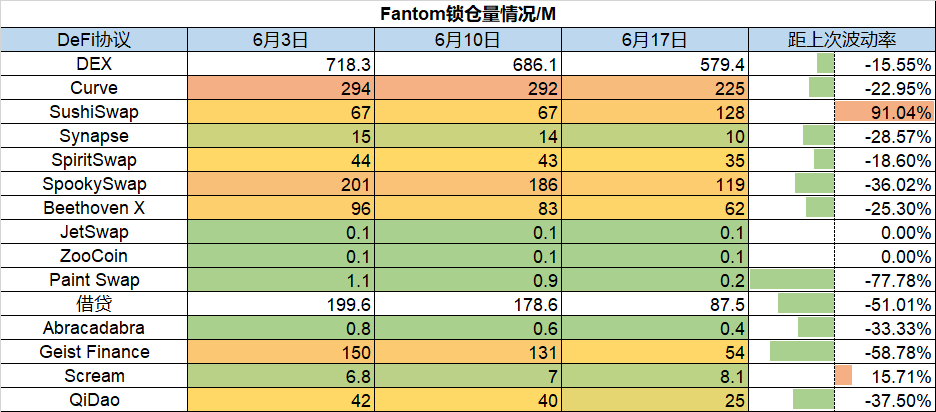
The overall agreement has experienced a relatively large decline, and the agreement with a slight increase is also caused by the short-term TVL fluctuations. The DEX of each chain has fallen by about 32%, while the loan agreement has fallen by around 40%, and the short-term loan agreement has fallen more severely. .
secondary title
NFT index market capitalization
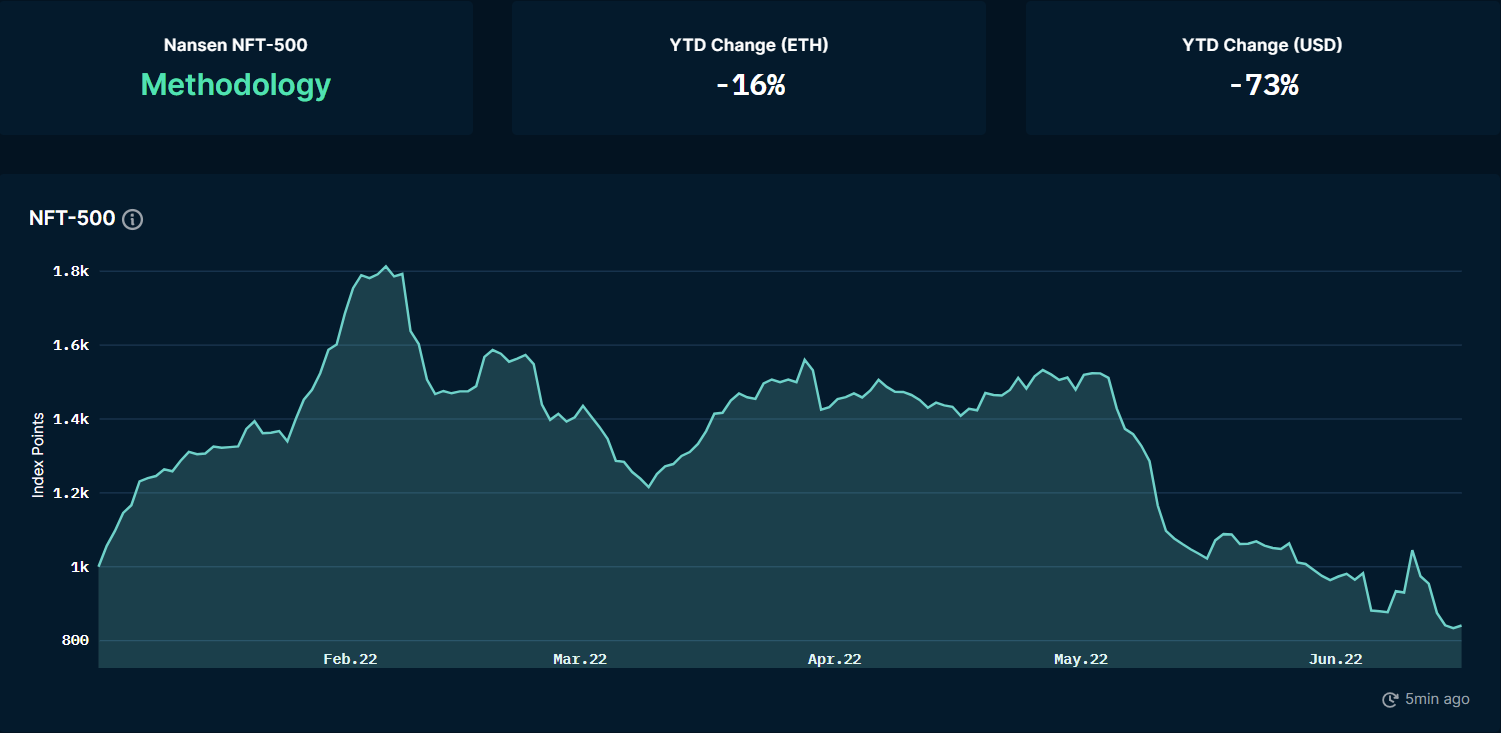
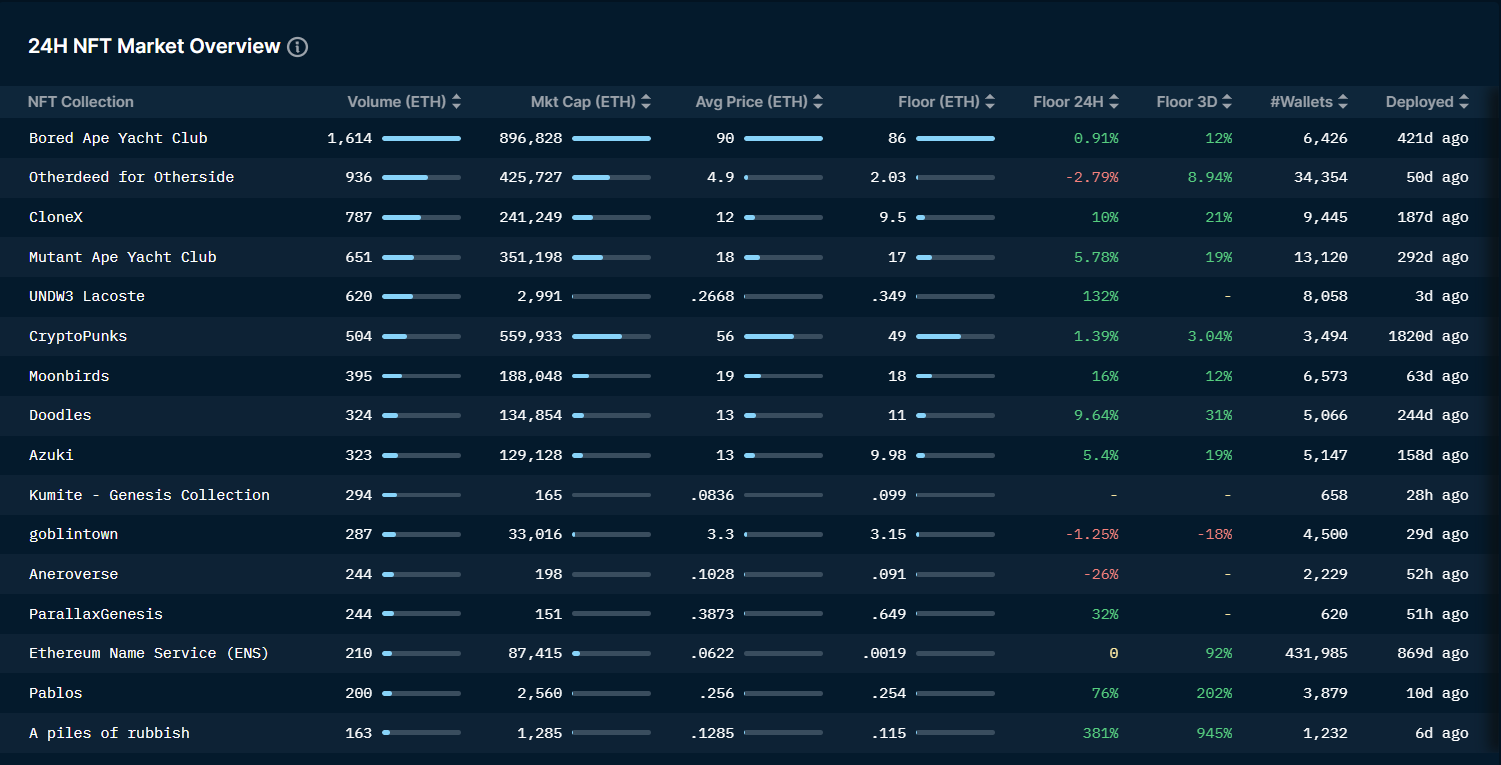
Overview of NFT market transactions
NFT "smart money" purchases sorted
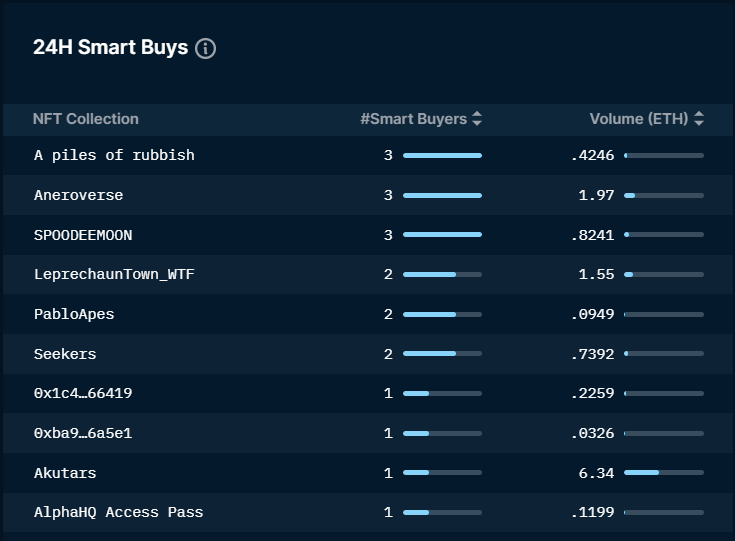
Overview of NFT market transactions
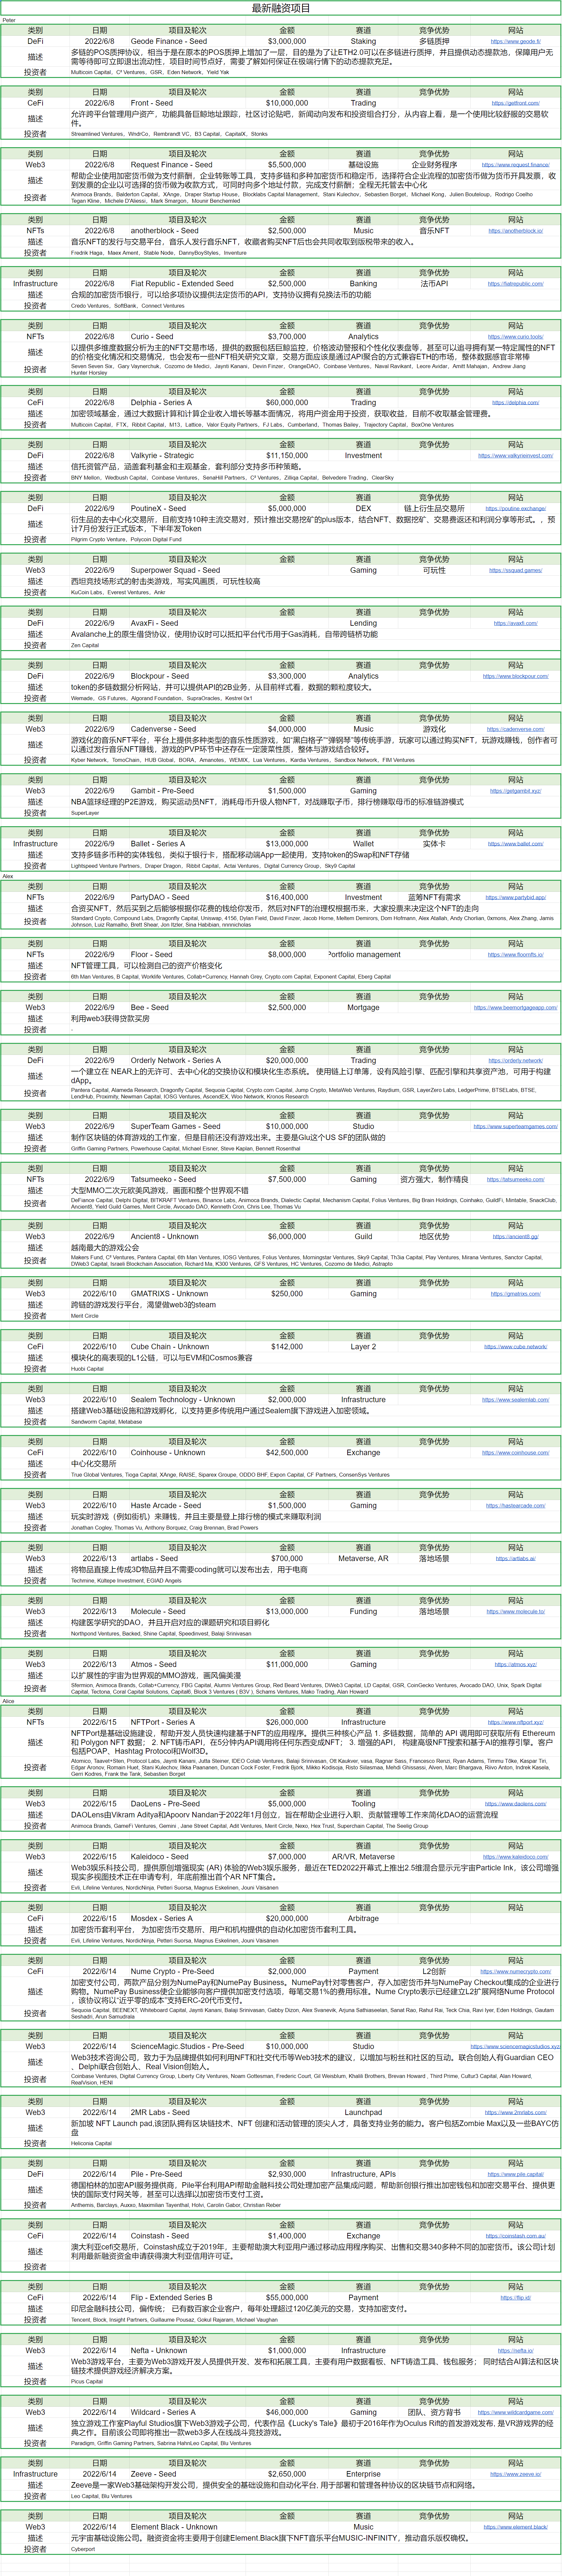
The latest financing of the project