


Bloomberg Outlook for April: Crypto will outperform U.S. stocks, Ethereum may reach $6,100 this year


This article comes fromBloomberg Intelligence, compiled by Odaily translator Katie Koo.

This article comes from
The Waterloo of the oil and gas market and the rise of digital assets are unstoppable. The Russian-Ukrainian war brought oil and gas prices into a period of turmoil, and cryptocurrencies took advantage of the opportunity to successfully rise. The addition of bitcoin and ethereum to portfolios, and the surge in the crypto dollar, these trends are entering an uptrend. The Russo-Ukrainian War enhanced Bitcoin’s value as the world’s digital reserve asset, while Ethereum evolved as collateral for a new kind of internet.
Discounted cash flow valuation model (DCF) analysis shows that as Ethereum approaches an upgrade, its value may be undervalued. Trend signals are positive for Solana, Terra, and Avalanche in Layer 1, but are also subject to economic ebb.
secondary title
Cryptocurrency Performance Amid Macroeconomic Headwinds1. Cryptocurrencies are fighting an economic downturn, but the process is risky
Trading volumes in risky assets declined in the first quarter, with cryptocurrencies among the most exposed assets.
The turmoil in markets for metals like nickel amid the Russia-Ukraine war further underscores that Bitcoin, the most liquid, 24-hour global trading tool in history, is on its way to becoming digital collateral.
2. Crypto vs Stocks: Crypto Outperforms, Volatility DecreasesSince the end of 2019 (to April 4), the Bloomberg Galaxy Encryption Index (BGCI) has risen by nearly 800%, while the Nasdaq 100 Stock Index (Nasdaq 100 Stock Index) has risen by nearly 70%. potential.The 90-day volatility of the cryptocurrency index has dropped to about double that of the stock index
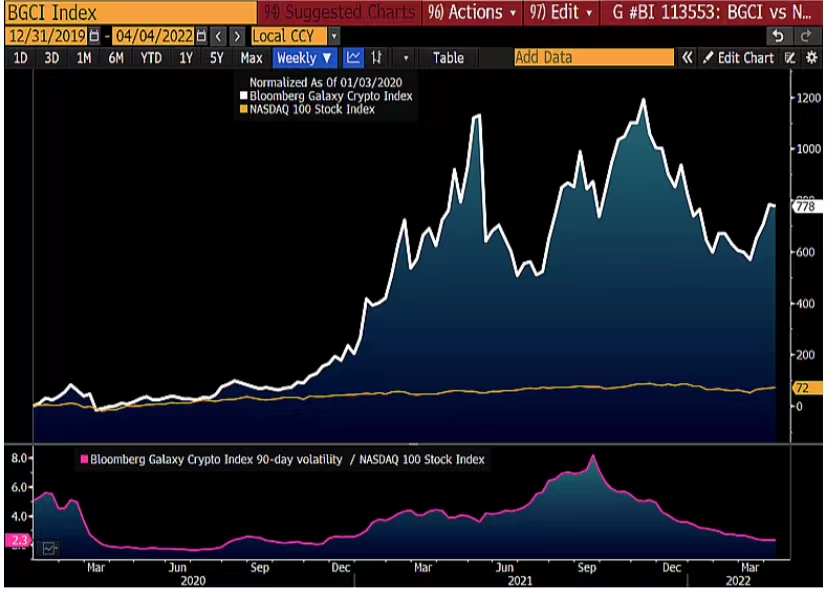
. The Nasdaq 100 is down about 8%, half as much despite doubling the risk.
image description
Volatility comparison between cryptocurrencies and US stocks
Since the launch of the Bloomberg Galaxy Crypto Index (BGCI) in August 2017, its 90-day average volatility has been approximately 4.4 times that of the Nasdaq 100 Index.
Cryptocurrencies still make up only a small portion of most portfolios. We can also feel that cryptocurrency buyers are buying the dips and stock sellers are selling the rallies.
3. Inflection point? Bitcoin recovery and stock market weakness
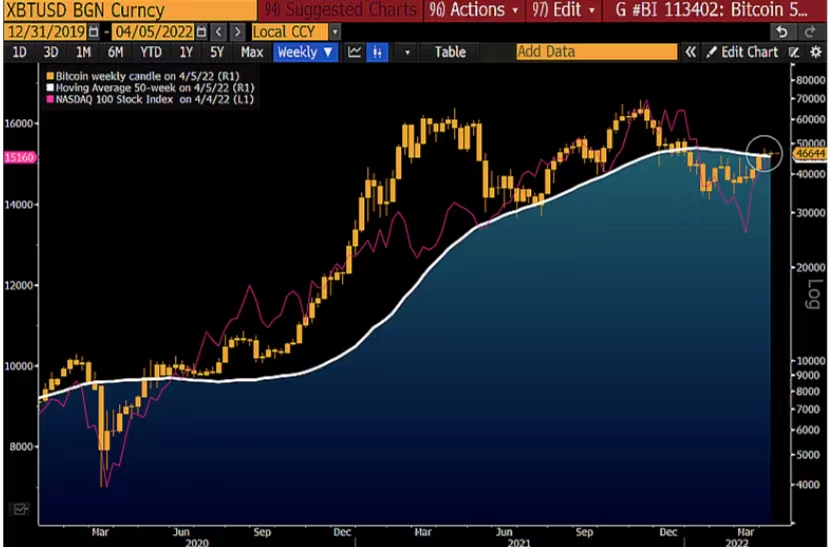
Bitcoin is strong in 2022 and could break key levels around its 50-week moving average and hold above $46,300, but the Nasdaq 100 is still down about 8%. Our Bitcoin chart shows that in 2022, the stock market appears to be pulling the Bitcoin market lower, but at the end of the first quarter, the Bitcoin market is leading the stock market. The decline in the stock market may be more "normalized".
4. Bitcoin could outperform the stock market
When the Fed wakes up to rising asset prices, maybe the Fed will pay more attention to the associated inflation and do something about it. Bitcoin is poised to move ahead of the average risk asset class.
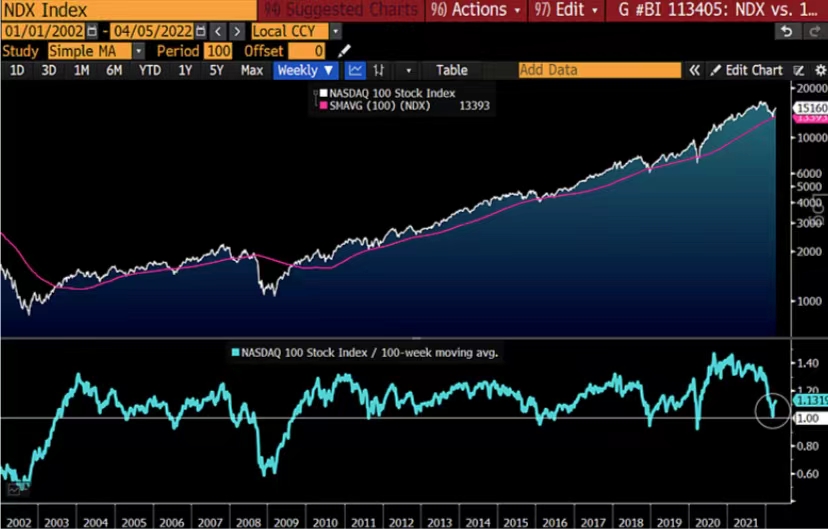
2022 is likely to be heading towards a more turbulent situation. Bitcoin appears set to outperform the Nasdaq 100 in most scenarios. If stock market history since Bitcoin’s inception in 2009 is any guide, the 2022 decline may be over. As the world adjusts to COVID-19, the Federal Reserve tightens monetary policy, and the war between Russia and Ukraine continues, it is unlikely that the market will end up so easily. This chart shows that for the first time since 2020, the Nasdaq 100 has bounced back from revisiting its 100-week moving average. A reshuffle more akin to the financial crisis may be long overdue.
5. Will the crypto market be smooth sailing in 2022?
Similar to Bitcoin, the performance of the nickel market is also a compass for the market. "Good chart data performance" in the nickel market is a benchmark for traders, representing how much traditional markets may be lagging behind digital assets. Decentralized constant price discovery (price discovery) is an attribute of blockchain-based assets such as Bitcoin, and funds are moving to where they are best for them. Our chart shows the stark difference in daily liquidity and price elasticity between Bitcoin and London Metal Exchange (LME)-traded nickel futures, which trade during shorter working hours. Bitcoin's 60-day average volume on Coinmarketcap is about four times the $6 billion volume of nickel futures.
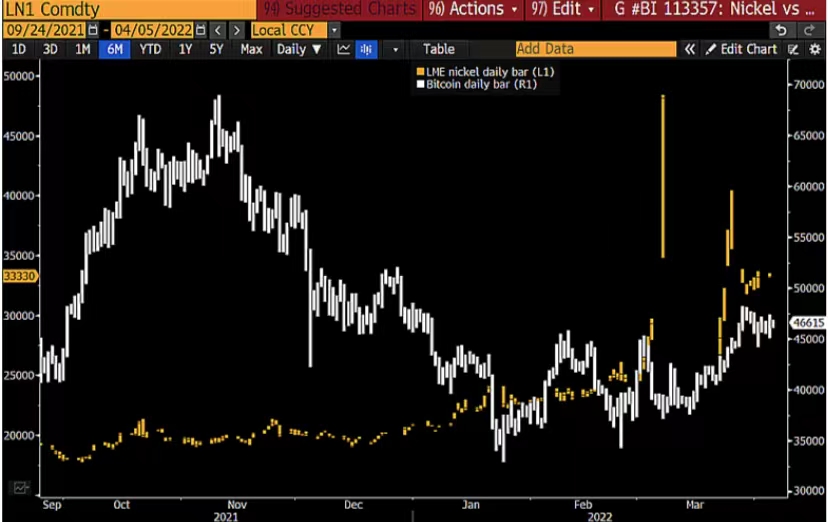
image description
Bitcoin: "Chart Data" and Liquidity vs Nickel Markets
secondary title
The value of bitcoin under the Russo-Ukraine war
West Texas Intermediate (WTI) crude oil (WTI crude oil has become the benchmark for global crude oil pricing) has returned to $100 a barrel, but its history and the rules of supply and demand elasticity suggest that the price rebound may be the same as in 2008 and 2014 Short-lived, especially compared to newcomer Bitcoin. Crypto is not supply elastic, and unless demand and adoption trends reverse, $100,000 seems like only a matter of time.
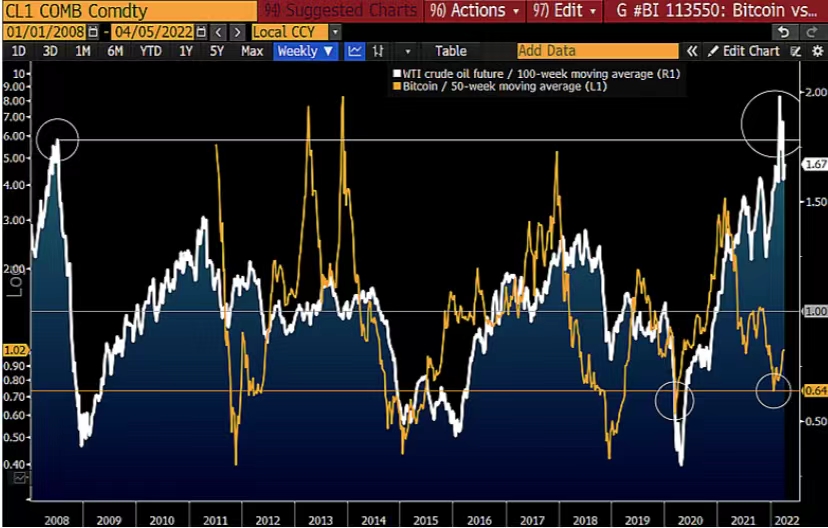
In the first quarter of this year, the underlying price risk is tilted towards a reversal in crude oil prices. Crude oil has been in a bear market since peaking in 2008, with highly elastic supply and demand, and recently reached an all-time high above the 100-week moving average.
1. Favored Bitcoin VS Crude Oil; Market "Hotness" AnalysisIf crude oil prices go to extremes like they did in 1990 and 2008, they could fall toward $50 this year. Such a reversal would provide a point of price support for Bitcoin as it would reduce the need for the Fed to tighten restrictions.
Can Bitcoin's post-Russia-Ukraine war outperformance last? This battle could be another milestone in Bitcoin's value. Since the Russo-Ukraine war ended April 4, bitcoin has risen about 20 percent in value, about twice as much as the price of crude oil, although the bull has been pulled back and forth several times.
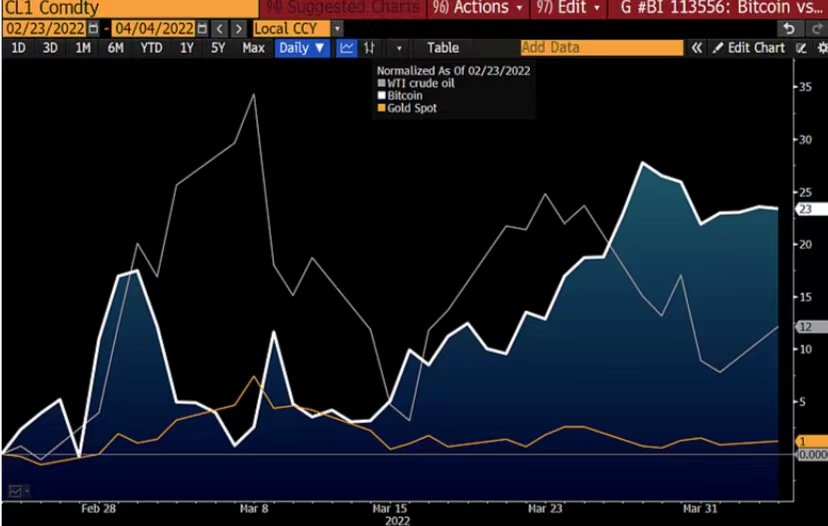
Also worth noting in the chart is that gold, the quintessential store of value, underperforms in this conflict. We remain bullish on gold, but think its performance during the war suggests that traditional collateral is being less used compared to digital upstarts.
2. Advantages of Bitcoin over crude oil and gold
3. Energy decarbonization or currency digitization
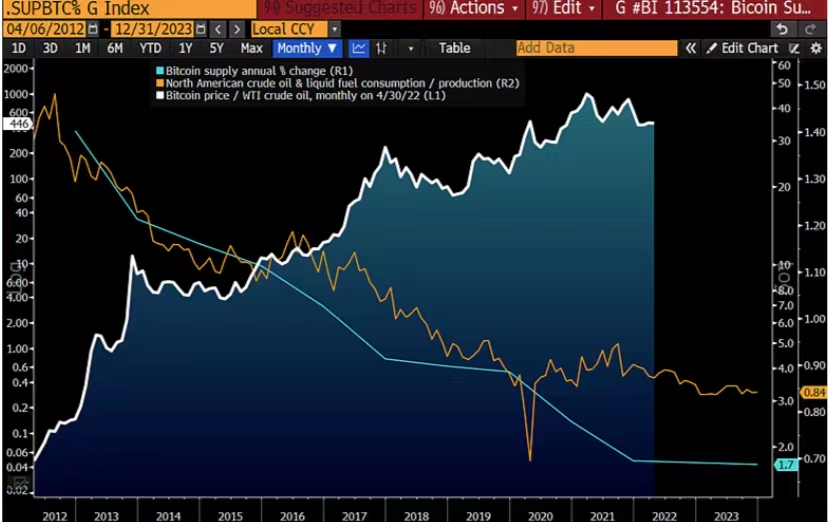
The demand and adoption trends of Bitcoin are in stark contrast to those of crude oil, with people favoring the oldest cryptocurrency. As a representative of advanced technology, Bitcoin is becoming the benchmark for global digital assets, while oil is being replaced by decarbonization and electrification. Pushing the value of one bitcoin to just over 600 barrels of oil in early 2022, up from a fraction of that in 2012. Our chart shows the main reasons why the 10-year price change in WTI is roughly the same.
Traditional Fossil Fuels and Digital Reserve Assets
North America consumes approximately 40% more liquid fuels than in 2012. This year, estimates from the U.S. Department of Energy show supply exceeding demand by 15%. Paired with this is a steady decline in bitcoin supply, which is expected to account for around 1.7% of the total supply this year.
secondary title
Is Ethereum Undervalued?1. Ethereum at its low price could be changing the crypto game
Traditional investors may find that Ethereum has changed the rules of the game. Ethereum is developing into a cross-asset with unique characteristics of equity, commodity and currency.The upcoming ethereum merger, transforming ethereum from a proof-of-work (PoW) model to a proof-of-stake (PoS) model, transforming ethereum into an equity-like instrument, with dynamic supply and demand dynamics, may drive the market towards Significant interest in assets.
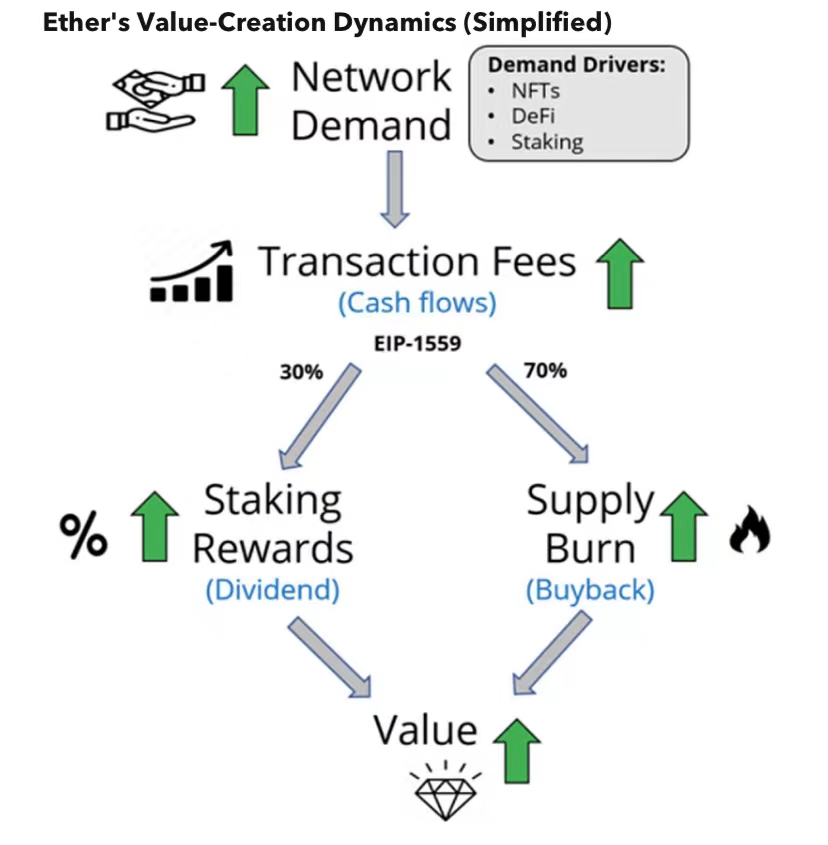
Ethereum stakers (validated owners) will be entitled to share in future revenue (fees) generated by the network, and EIP-1559 states that part of the fees (approximately 70%) should be burned (similar to buybacks) and the rest as rewards (dividends) )distribute.
image description
If the demand for block space and the total fees paid increase, stakers will enjoy higher dividends and less issuance, and vice versa. Blockchain has no direct costs (only indirect costs, in the form of token issuance), so revenue represents the bottom line (profit).
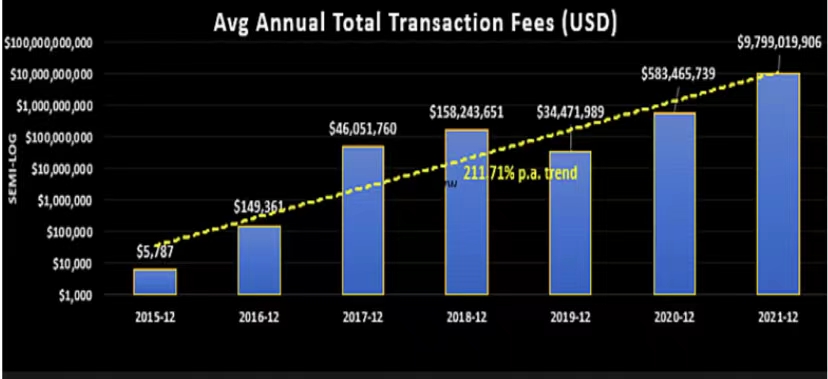
Ethereum Cash Flow is growing 200% per year. Ethereum’s transaction fees (a key measure of the network’s value) have grown exponentially, despite higher gas fees relative to cheaper alternative Layer 1 platforms, suggesting a premium for Ethereum block space in the cryptoeconomy . Since its inception, transaction fee cash flow has grown at an annual rate of 212%, and the Ethereum platform’s on-chain activity has accelerated dramatically over the past two years.
image description
Ethereum transaction fees (in USD)
2. Conservative cash flow forecast behind the valuation
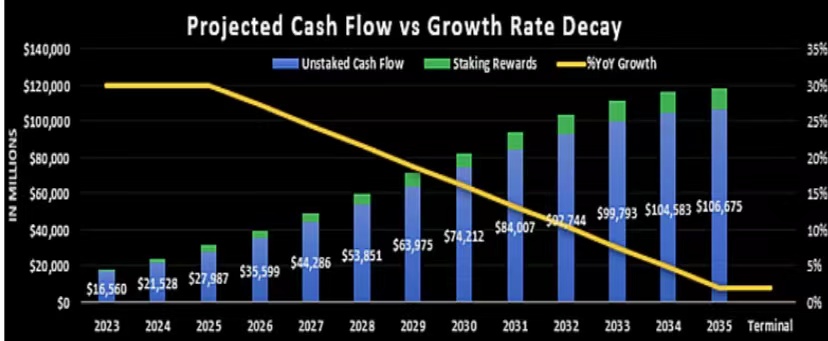
The trend toward decentralized structures in finance, social, and gaming P2E economies, if only partially realized, should be enough to support a period of strong growth for Ethereum, translating into higher prices over the next 12 months. The network is on track to generate $12.7 billion in revenue in 2022, and our base model expects cash flow to grow at 30% per year for the next three years before decaying to its final growth rate in 2035.
image description
Projected discounted cash flow assumptions
Cash flow estimates include all transaction costs (base + preferred). To avoid any double counting errors, our model excludes staking rewards from transaction fees or new issuance. Due to the conservative strategy, we also rule out any deflationary burn that the EIP-1559 repo might have started post-merger.
3. Ethereum could hit $6,100 this year
With improved consolidation prospects in the coming months, Ethereum could close the valuation gap, potentially surpassing other assets in 2022. Our cash flow model excludes staking returns and utilizes three discounted cash flow methods to provide a range of valuations. Our core scenario using the first persistent growth approach gives ETH $6128 (up 110%), while the second hourly model puts it at $5539 (up 90%).
A third DCF approach is with price/earnings (PoS blockchains only have the overhead cost of new issuance, turning cash flow into profit). If we apply a valuation similar to Apple (Ethereum's growth prospects are much higher), we arrive at a valuation of $9328 for ETH (up 219%). The average of the three DCF methods is $6,998, which is 140% above current levels.
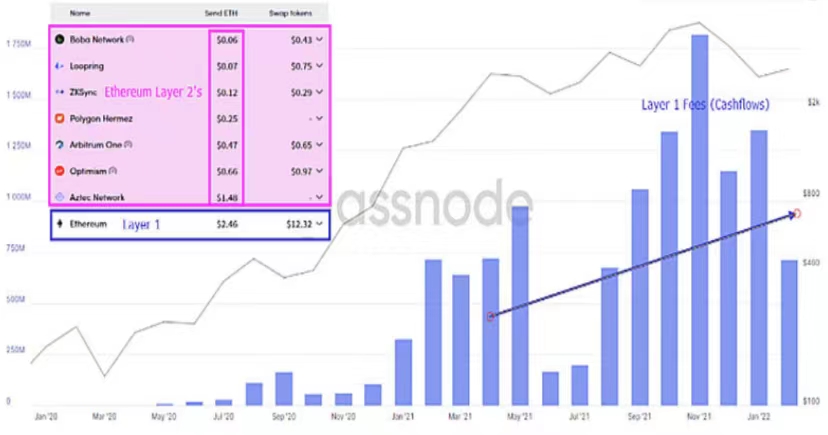
While any network delays or bugs in the merger could have a negative impact, the main risk to revaluation is lower-than-average growth in total transaction fees. Once Ethereum enters the next phase, the Sharding phase, which breaks down the base chain into 64 individual "shards" (shards), significantly increasing Layer 1 block space, gas prices are expected to drop accordingly. Instead, this will unlock the full potential of L2 rollups, which can process more transactions at almost zero cost before publishing to the Ethereum public chain.
Ratio of total monthly fees to L1 and L2 transaction costs
There are early indications that blockspace resilience could lead to ethereum's much-touted blockspace demand offsetting the impact of gas price drops. Layer 2, Polygon, Arbitrum, etc. have been operating since Q2, compressing transaction costs, increasing ecosystem on-chain activity, and Ethereum increasing total fees.
secondary title
Bullish trend signals increased market participation
1. Bitcoin Trend Signals Are Positive
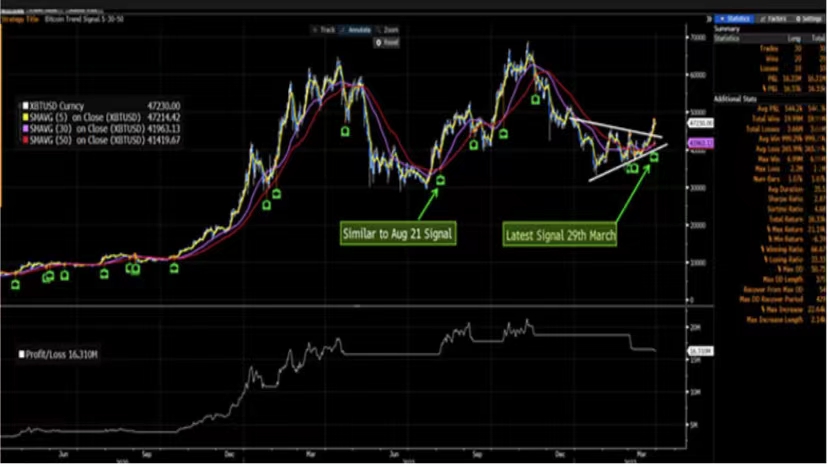
The Bloomberg Intelligence Bitcoin trend signal points to a major momentum change as the price hovers around a 5-month depressed price. Trend Signal is a non-optimized technical filter that catches inflection points when momentum swings from bearish to bullish, while providing complementary trend exit signals when momentum weakens.
image description
Over the past 7 years, there were 30 signals, 66% of which were nominally profitable. That’s a 16x return compared to Bitcoin’s 15x return. This comes with reduced risk. While macro factors remain unfavorable and the big picture remains a broad $30k-$70k range, the current rally could be similar to the August 2021 signal when it saw a 65% rally.
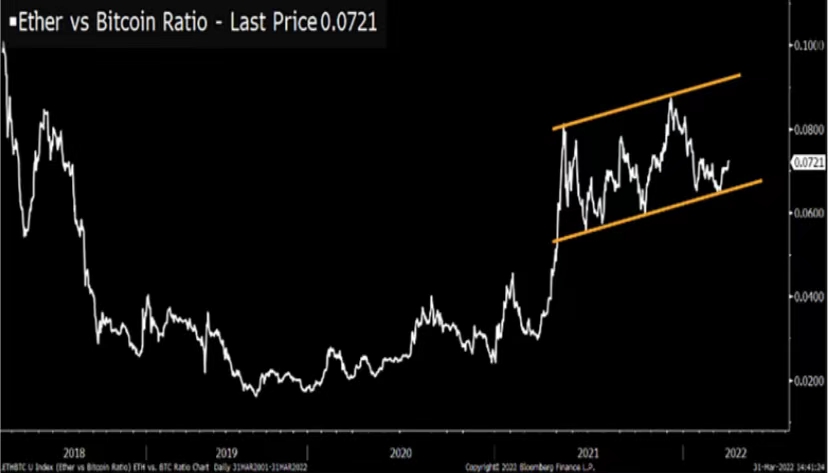
The relative outperformance of Ethereum is likely to continue as the price action of the ratio between the two assets, ETH and BTC, continues to move higher in a large trading range that began 2021. The Ethereum/Bitcoin ratio chart already encapsulates the risk appetite of the broader crypto market complex as managers peg performance to BTC.
image description
ETH to BTC ratio
2. Expand market participation
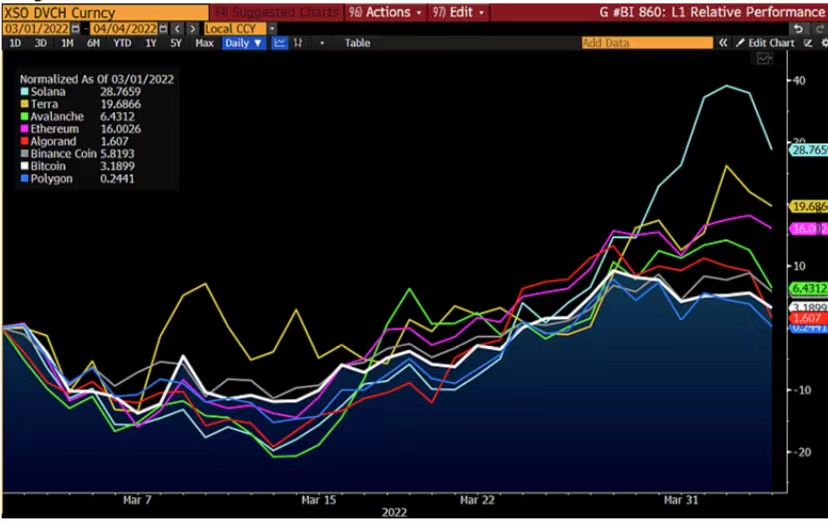
The L1 token in the Bloomberg crypto-asset space has performed relatively well since mid-March, a positive sign of broad participation, despite the bearish macro backdrop and the high likelihood of monetary tightening. Crypto assets have traditionally underperformed in times of shrinking central bank balance sheets, rising yields and a stronger dollar. Considering that the US 10-year Treasury yield soared to 2.34%, Bitcoin’s 8% rise in March is still impressive.
Month-to-day returns on Layer 1 tokens (in percent)
Alternative safe-haven assets such as Solana, Terra and Avalanche lead the recovery of the broader market. Even considering the increased volatility, the return rate in March is still about 1.5-2 times higher than that of benchmark assets, and risk appetite is returning.
secondary title
Policy Threats to Crypto Exchanges, Brokers
1. Encrypted platforms will face strict scrutiny and policy risks from the SEC
Crypto platforms will still face enforcement and policy threats in the U.S. in February, and in some cases could face hundreds of millions of dollars in fines and settlements, as well as new regulatory pressures that will cost companies tens of millions of dollars or more USD price. We believe this new regulatory model works for established companies like Coinbase and FTX, not startups and newcomers.Cryptocurrency platforms will face heightened regulatory scrutiny from the SEC in 2022, whether or not the industry chooses to cooperate with the agency. SEC Chairman Gary Gensler has often said,
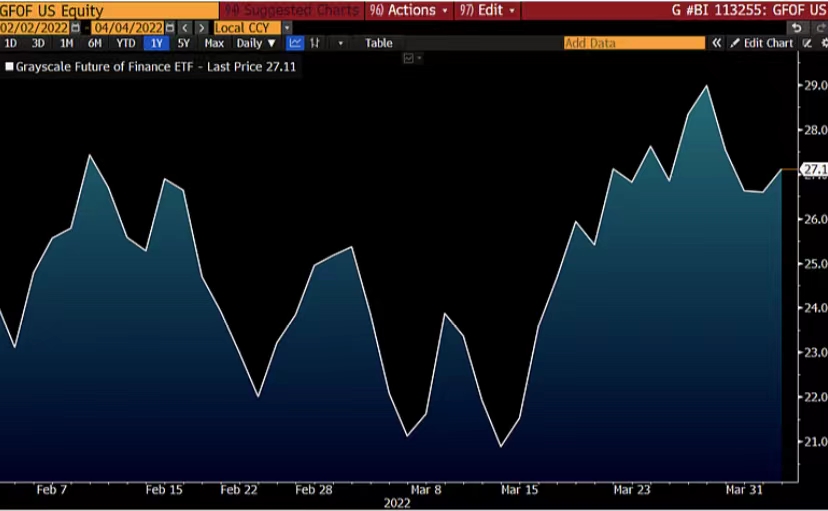
Most tokens operating today should be considered securities, and companies should therefore be "registered" with the agency. While it would provide greater regulatory clarity, registration would also introduce new burdens, customer disclosures and ongoing audits, which could cost tens of millions of dollars.
image description
Grayscale Futures Financial (GFOF) ETF Performance
There are also risks in not registering with the SEC. The SEC suggested that platforms operating without registration violated securities laws, and the agency could take enforcement action or reach a settlement.Coinbase, Binance, FTX, and Kraken are among the most traded crypto platforms, and they may have an easier time coping with SEC regulation and oversight than smaller startups. Smaller companies with less capital may struggle to absorb the same costs. For example, we estimate registration costs to be equivalent to around 1-4% of Coinbase's 2021 net profit.
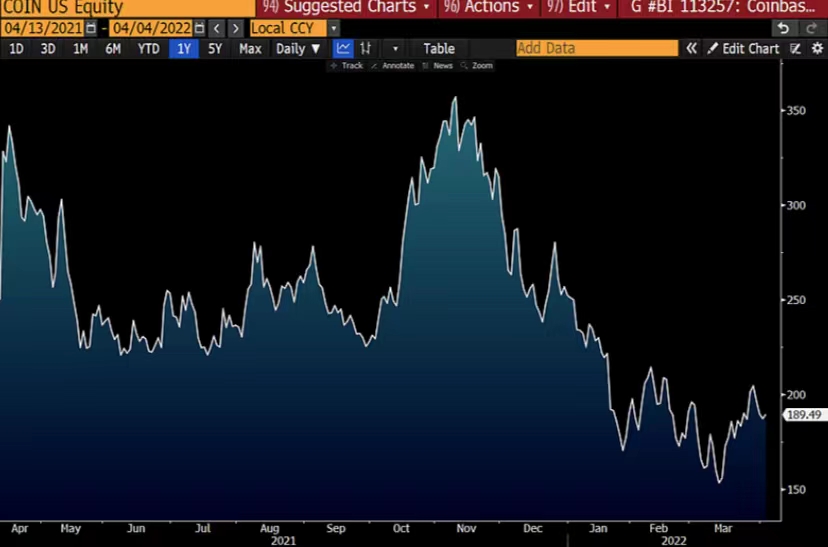
Second, increased trading volumes on large exchanges could expose these firms to additional costs without a major impact on profit margins. Finally, larger companies often have the compliance, technical and legal expertise to make the transition smoother.
image description
Coinbase Price: April 1, 2021 to April 4, 20224. The SEC 2022 development roadmap has been set, but the 2023 vision is still unknown
A proposal in January focused on so-called alternative trading systems (ATSs) and could expand the definition of "exchange" to include cryptocurrencies, which would be defined "in black and white." Companies trading in tokens deemed securities will be required to meet higher regulatory standards.
In the interim, we believe the SEC will continue to press ahead with enforcement actions against companies that own tokens they believe are being traded in securities. It will also seek settlements with companies that did not provide adequate customer protections, such as BlockFi's $100 million payment in February.
secondary title
About policy direction and digital dollar
The executive order on digital assets signed by Biden on March 9 is an important step in the government's response to the encryption market, but it is unlikely to change the overall tone and focus of financial regulation in 2022.
The order mainly requires regulators and financial institutions to submit reports and recommendations on various issues such as systemic risks and central bank digital currencies. None of these recommendations are expected to be implemented before 2023.The Federal Reserve stated that although Republicans and Democrats will push forward legislative opinions on stablecoins and cryptocurrencies in 2022, they will find it difficult to reach an agreement and will not launch a CBDC unless Congress approves it.
Related Reading:





