


DappRadar report: 17 charts to interpret the value flow data of the top four currencies


This article comes fromDappradarThis article comes from
, the original author: Pedro Herrera, compiled by Odaily translator Katie Ku.
In this report, we will analyze how funds enter the blockchain industry and the path followed after entering. We will select the top four cryptocurrencies by market value for analysis, namely Bitcoin, Ethereum, USDT (Tether), and ADA.
In this report, we will explain how fiat currencies flow into the blockchain, and go further for a deeper analysis. Then, we will try to understand how the value increases and decreases, and introduce how the encryption technology is used. Finally, we look at how stablecoins, the primary tool for interacting with DeFi protocols, are impacting the industry.
Key Takeaways:
Key Takeaways:
The number of BTC reserves on centralized exchanges is at its lowest point in 2021; at the same time, wBTC has doubled since the beginning of this year, and wBTC locked in Ethereum DeFi Dapps reached 20,000;
The highest value of ETH leaving a centralized exchange, in line with the highest wETH supply used in DeFi (6% of the exchange’s circulating supply), and a record trading volume of $5.2 billion in August;
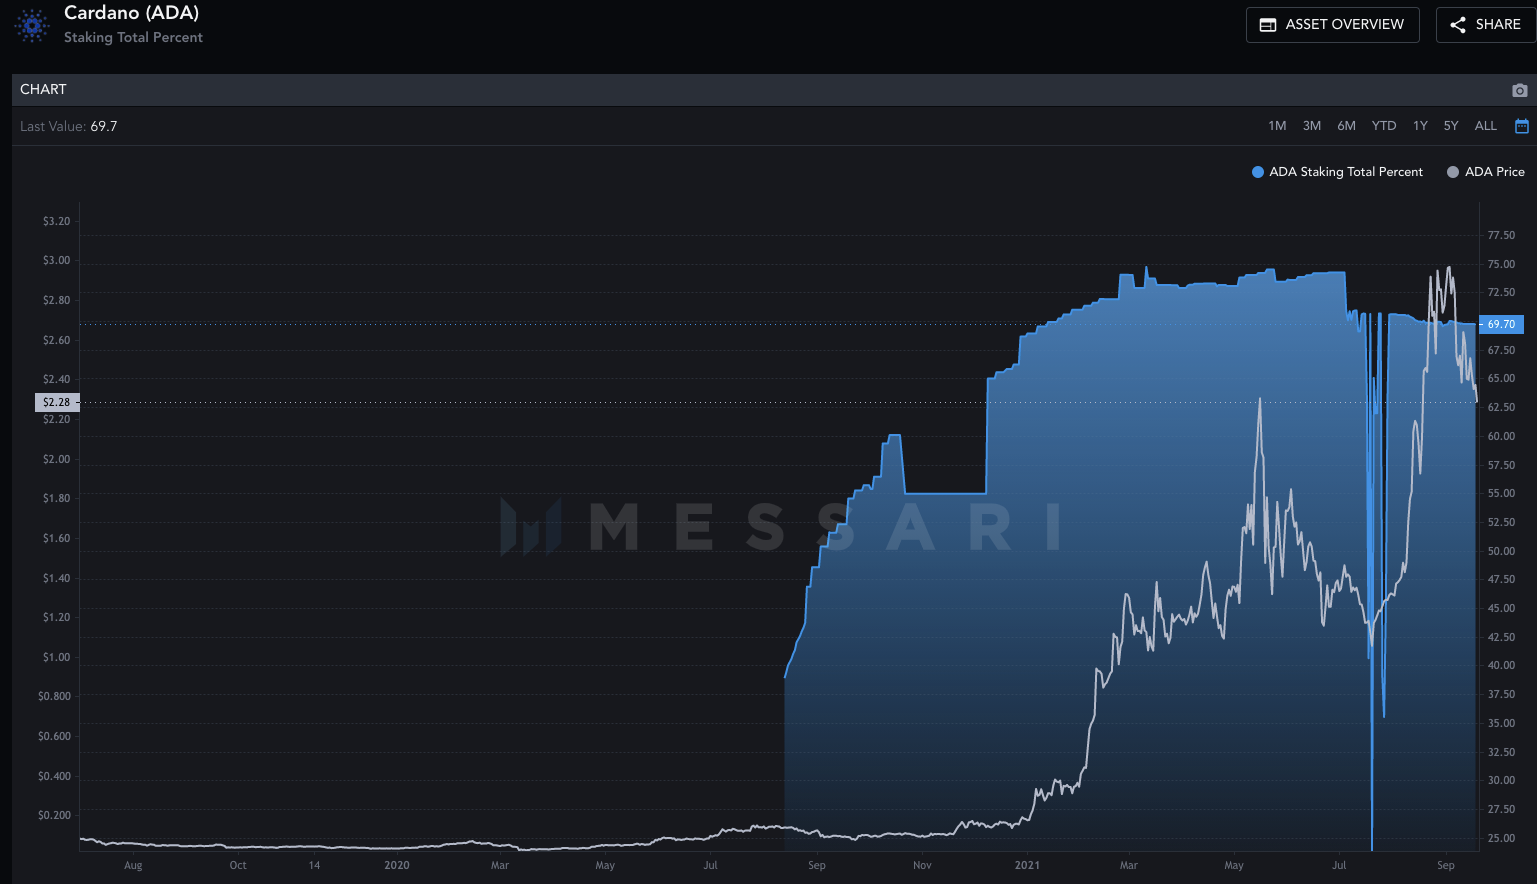
As it stands, ADA is one of the most static assets, as 70% of ADA is locked in staking pools, accounting for 2.45% of the industry's total market capitalization.
secondary title
Cryptocurrency can be used to interact with DeFi Dapp, purchase NFTs such as artwork, and is also widely used in blockchain games as governance tokens or game rewards. In order to access these areas, users need to have cryptocurrencies in their wallets.
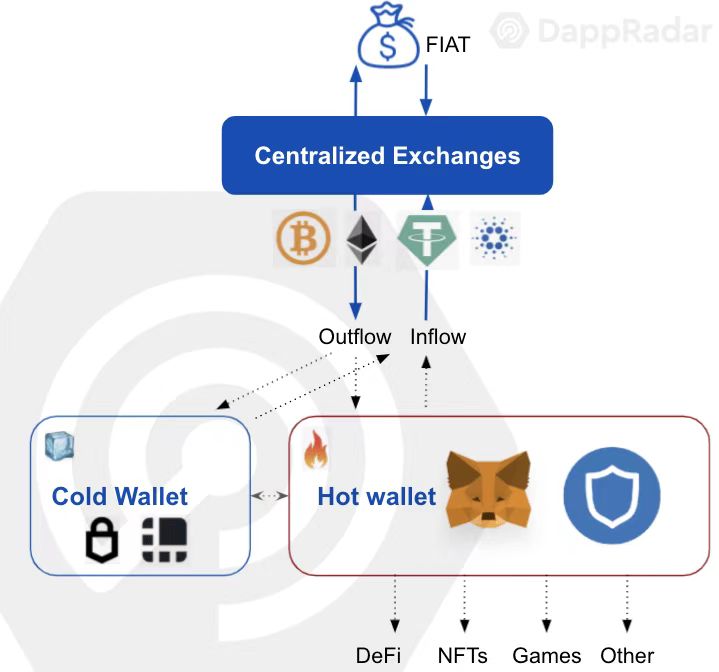
image description
Source: DappRadar
CEX (Centralized Exchange) is one of the most commonly used entrances and is therefore the first layer of the blockchain currency flow structure.
CEX is a platform managed by a third party where users can trade fiat currency and cryptocurrency. In this sense, CEX acts as an intermediary between the two sides of the transaction by providing trust, and it is also a place to store assets. CEX uses commissions and transaction fees as a business model. This forms the first layer of money movement in the blockchain space.<withdrawal) indicates the flow of assets from an exchange to another type of wallet.
secondary title
Bitcoin is clearly one of the most important assets in the industry, even setting the pace of the entire cryptocurrency market. Therefore, it is of great significance to analyze the value provided by BTC. The chart below shows the net BTC inflows to exchanges.
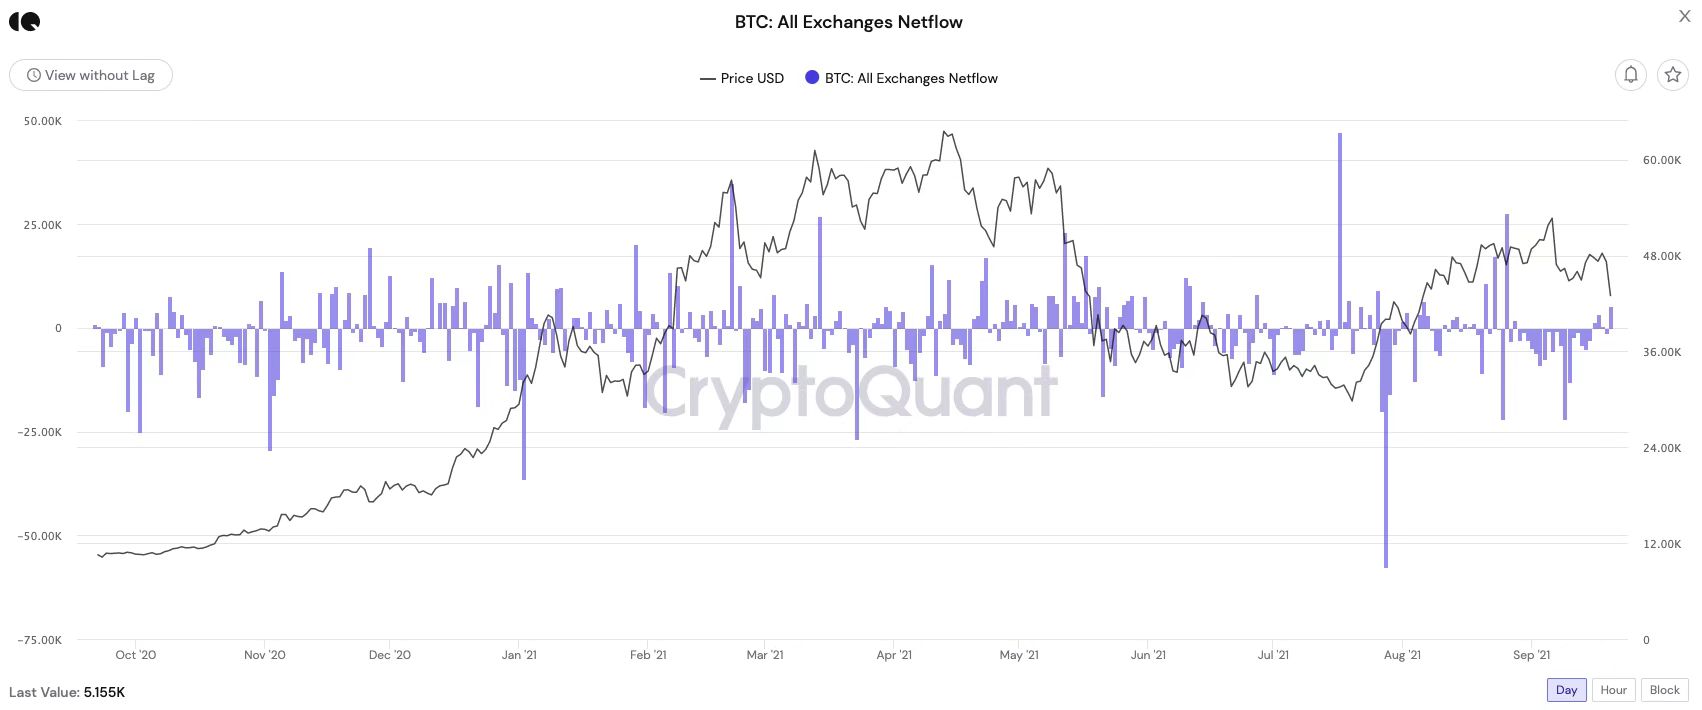
image description
Source: CryptoQuant
By analyzing the net bitcoin inflow to exchanges, we can see that 47,200 BTCs were supplied to exchanges on July 17, while nearly 57,700 BTCs were transferred out.
Based on BTC reserves, we calculate the reserve-to-circulating supply ratio to be 12.67%, the lowest level in 2021. The Reserve to Circulating Supply Ratio represents the amount of assets available in a CEX compared to the total circulating supply. At the beginning of this year, BTC’s reserve requirement ratio was estimated to be around 15%.
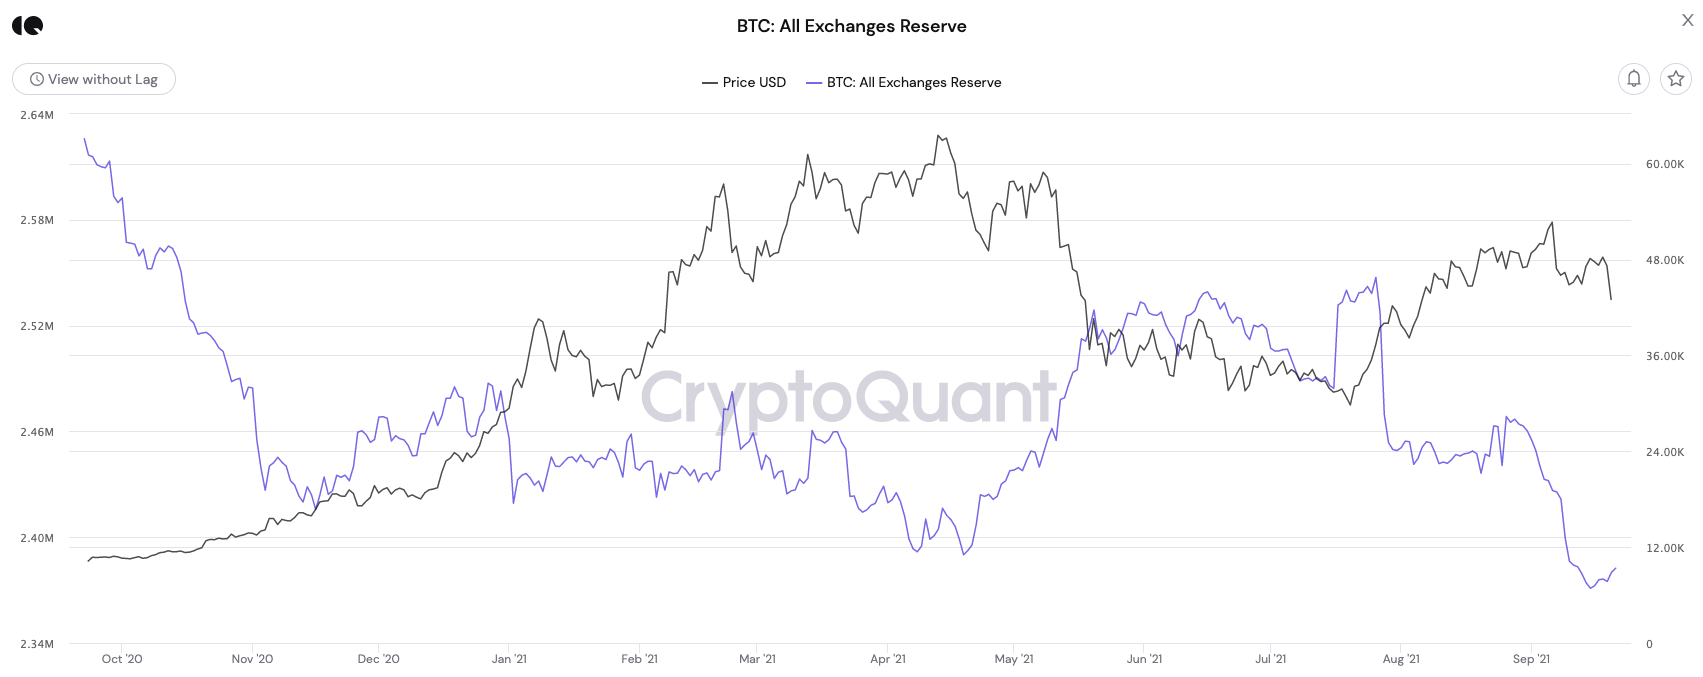
image description
Source: CryptoQuant
A reduction in the reserve of a particular asset can imply two main actions:
On the other hand, a reduction in exchange reserves could also be a signal of real value being generated in other blockchains. Taking the case of BTC as an example, we can observe this trend by looking at wBTC. wBTC is a token locked in a (Ethereum) smart contract whose value comes from BTC, but users can use Bitcoin in a more flexible way in the Ethereum network, for example, wBTC can be used as collateral for a loan agreement, or Provide liquidity for automated market makers.
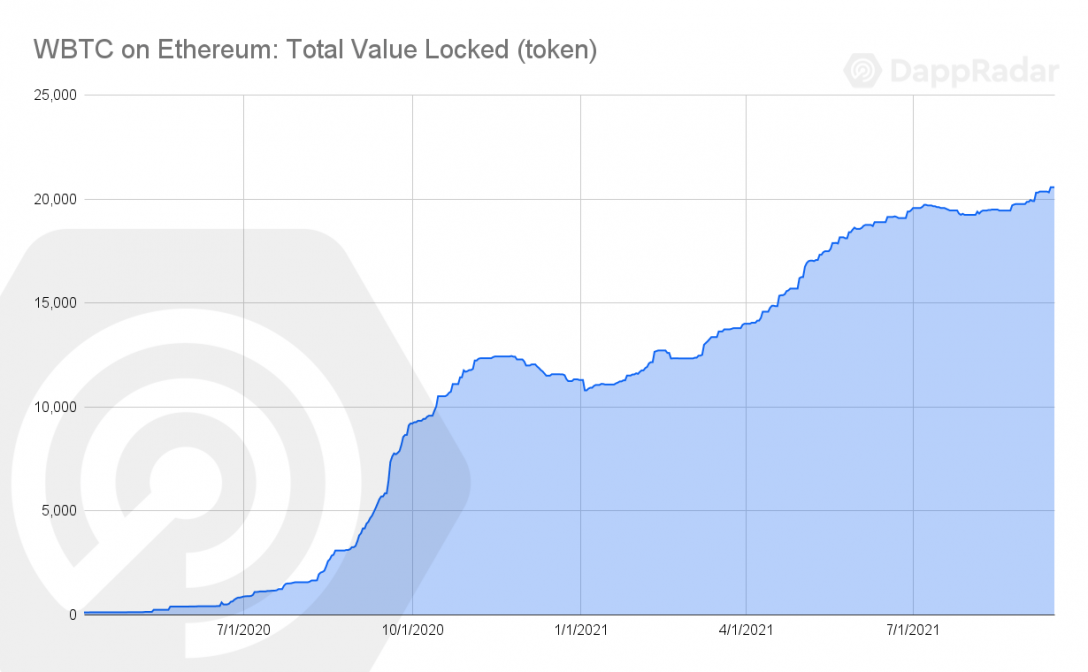
image description
Source: DappRadar
Furthermore, by looking at the largest holders of wBTC, we confirmed the specific use of DeFi: about 65% of wBTC is locked in the following 10 DeFi protocols.
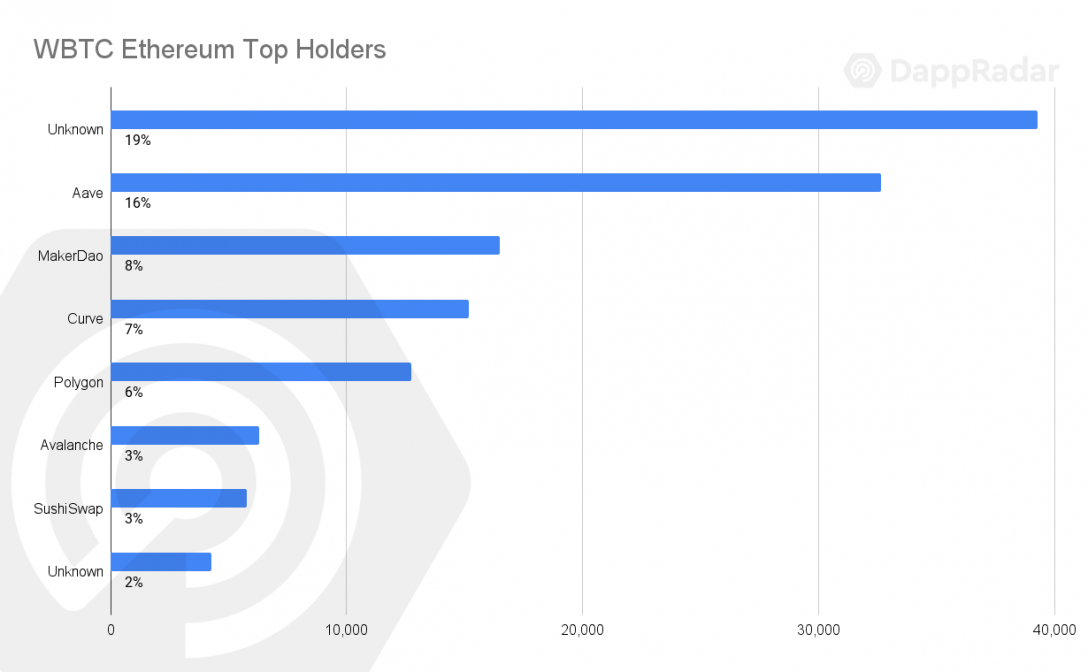
image description
Another blockchain metric that helps us measure the value flow of the industry is on-chain capacity. This metric shows the amount of BTC actively transacted in the blockchain. Since July 2020, at least 2 million BTC have been traded on-chain every day, reaching over 11 million BTC in September. The amount of BTC on-chain has grown exponentially, expanding the size of the blockchain industry. The start of this period of high demand matches that of DeFi last summer.
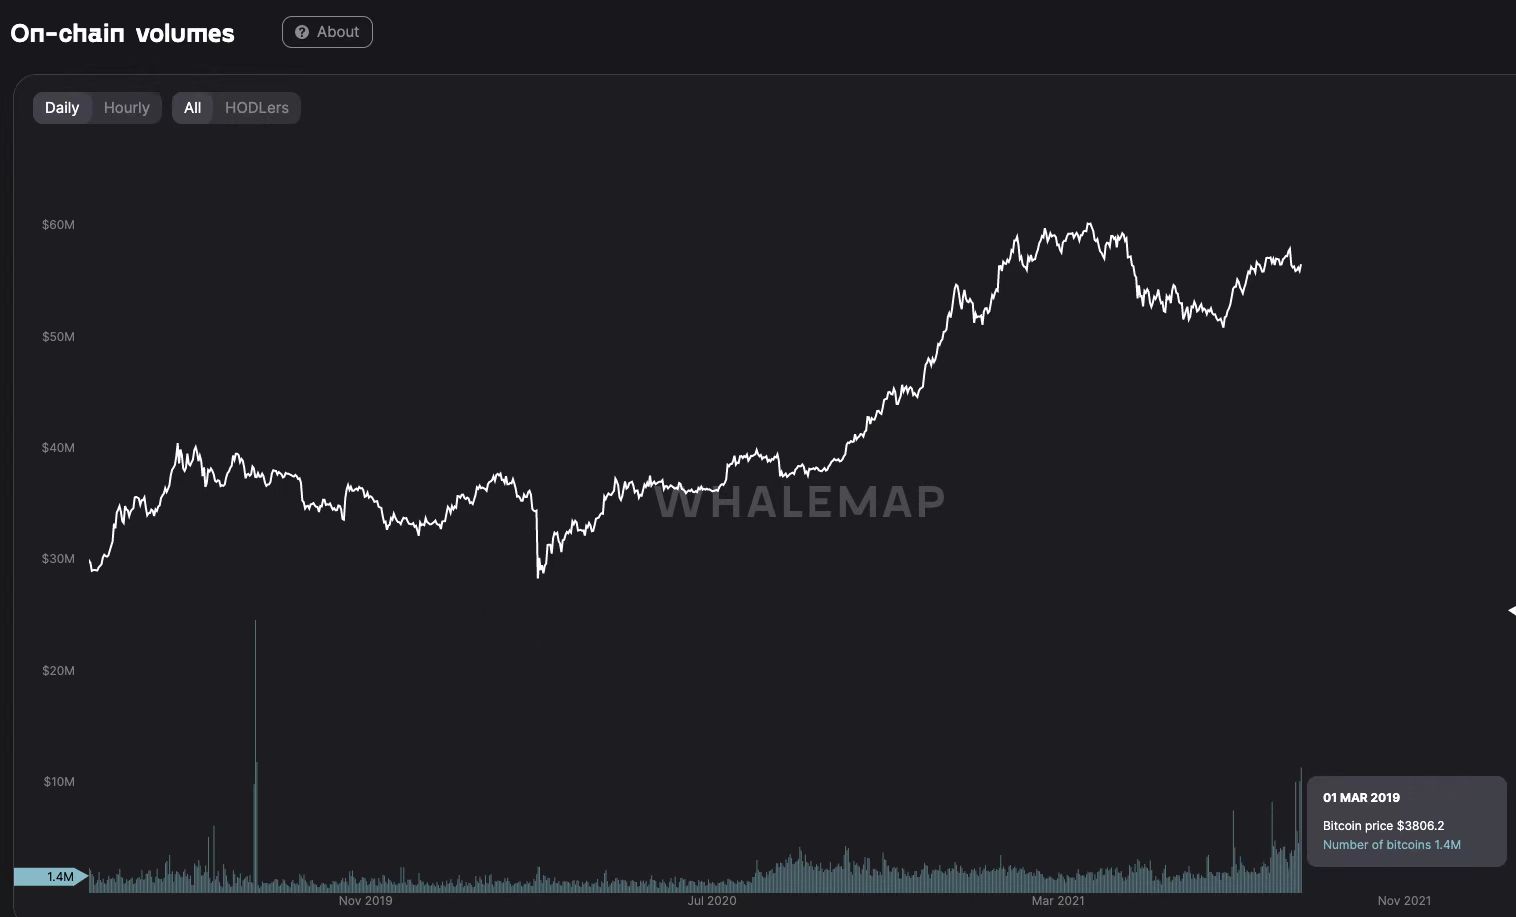
image description
Next, we will turn our attention to Ethereum, where exchanges and on-chain analysis will provide us with more information.
secondary title
Ethereum value flow
First, analyzing the net inflow of ETH, we can see a more distinguishable outflow interval than in BTC. These high withdrawal rates may be related to two important parts of the Ethereum ecosystem.
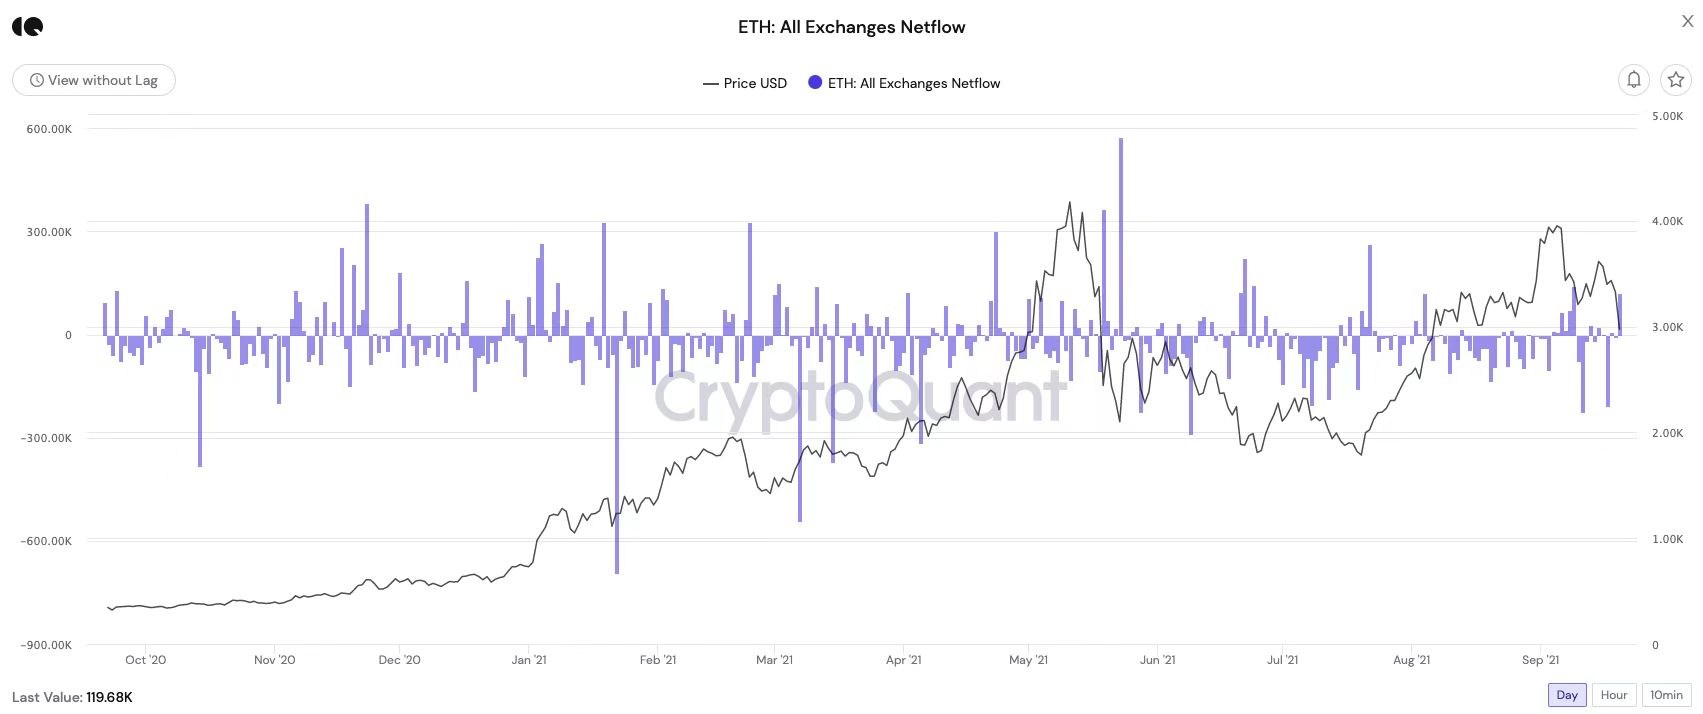
image description
Source: CryptoQuant
First of all, Ethereum is the leading public chain of TVL, currently locked up 122 billion US dollars, accounting for 65% of the industry. Although its dominance has declined with the multi-chain parallel trend, Ethereum is still the dominant position in DeFi.
Looking at the current ETH reserves, we see a significant decline in the amount of ETH held by exchanges, which may be the result of cold storage, or interaction with DeFi and NFT.
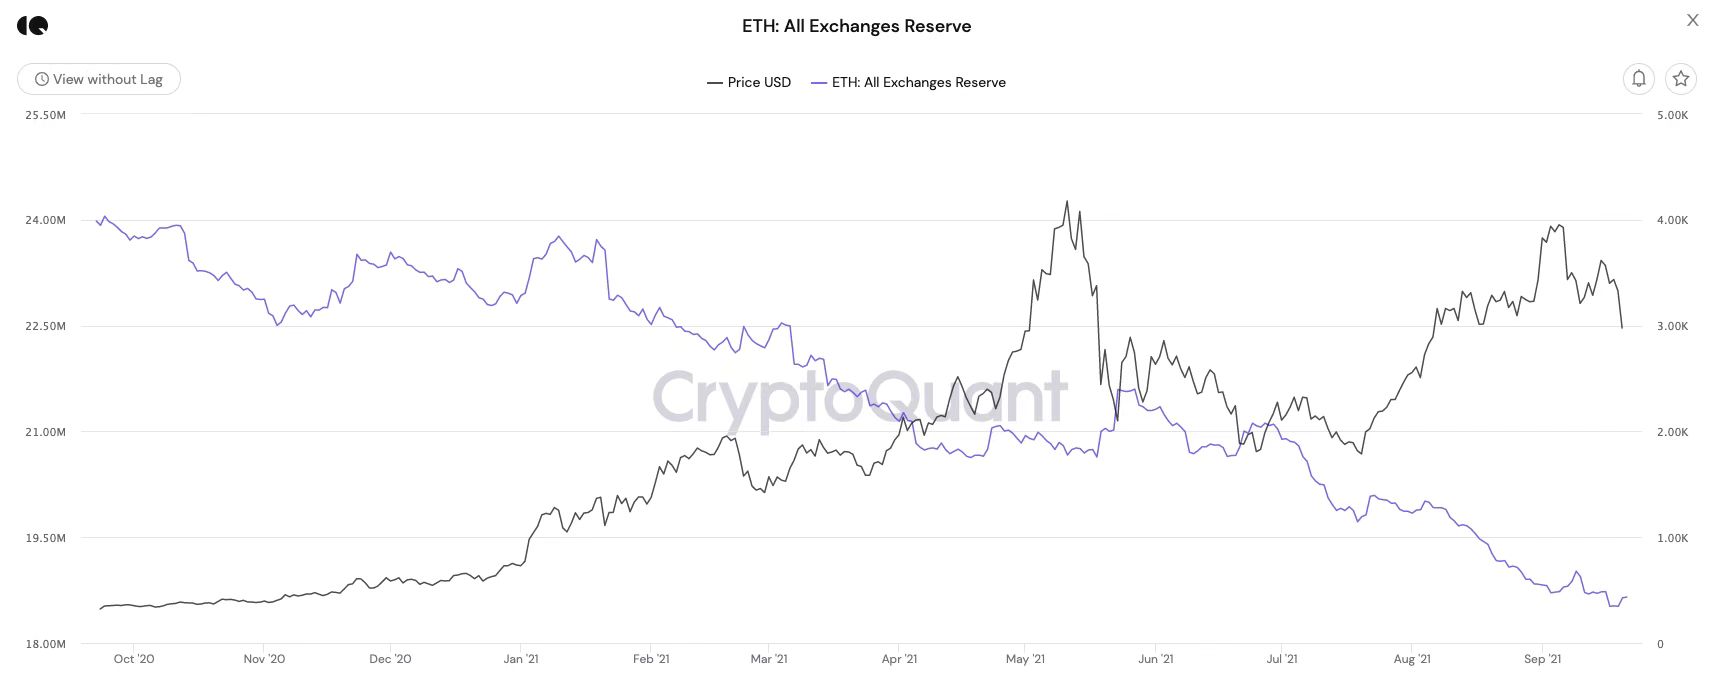
image description
Source: CryptoQuant
At the time of writing, there are approximately 7.069 million wETH in circulation, representing approximately 6% of the total circulating supply of ETH. Looking at the top wETH holders, we find at least 7 smart contracts related to DeFi, and two important bridges, one of which is related to the gaming space, see the picture below:
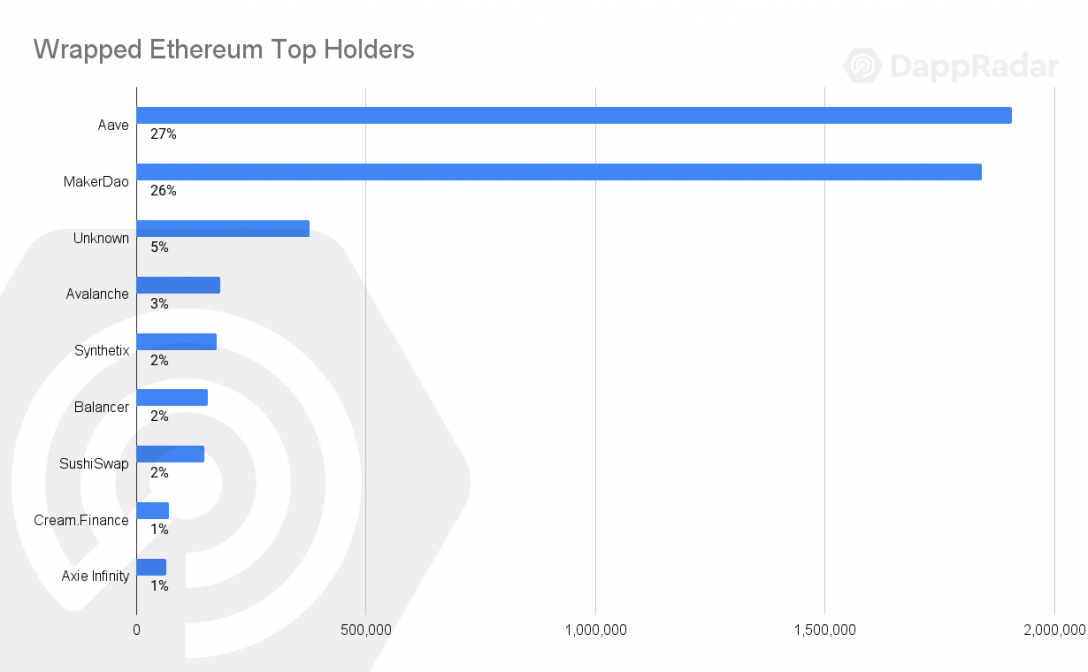
image description
image description
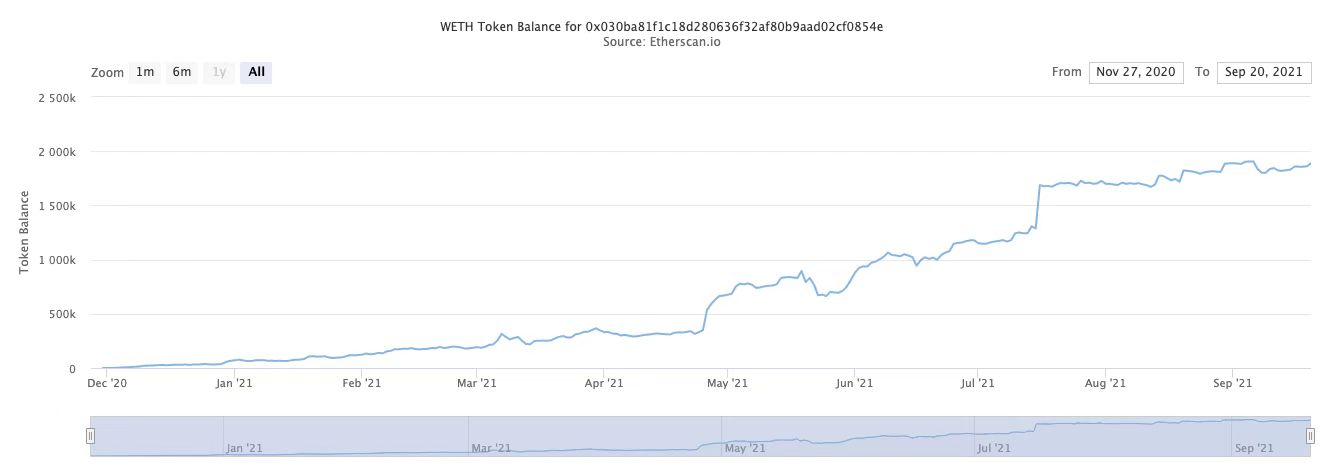
Source: Etherscan
In general, the value flow of Ethereum is not easy to map due to the different applications served by the Ethereum network. The value of DeFi is clearly increasing, and a stronger trend is emerging in the NFT field. We need to conduct a comprehensive in-depth analysis to confirm this trend.
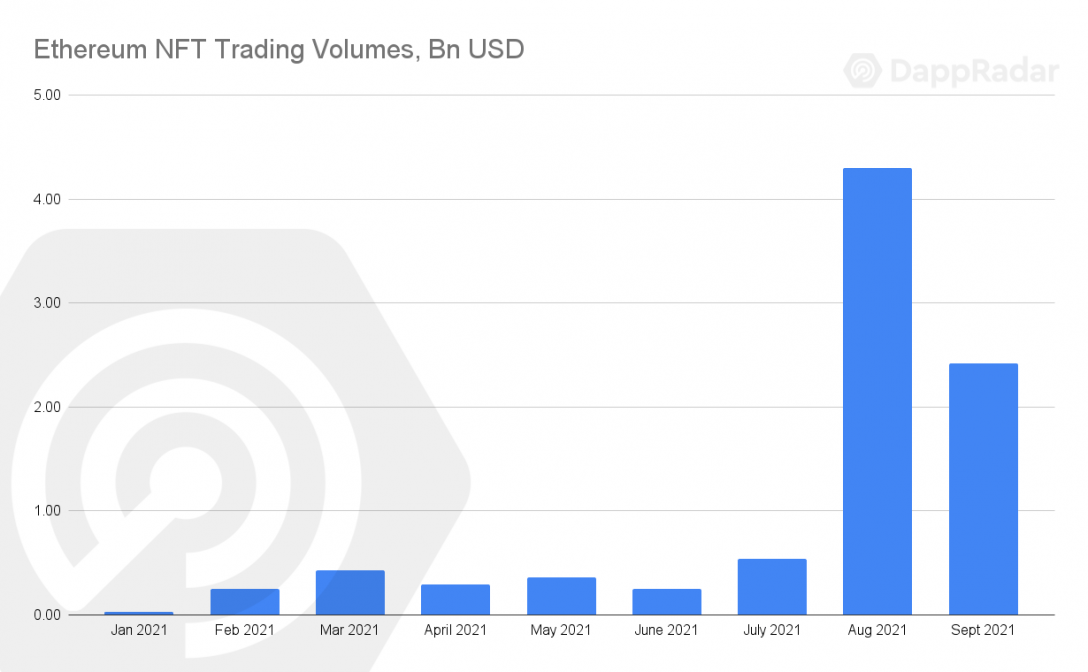
image description
The amount of ETH leaving centralized exchanges is at its highest. Compared to Bitcoin, ETH's main value comes from its flexibility that it can be used in different use cases. The reduction in BTC and ETH reserves bodes well for the long term. Of course, the industry’s prospects are still incomplete without the participation of other related cryptocurrencies. Let’s take a look at USDT.
secondary title
BTC and ETH are the most popular cryptocurrencies, together accounting for almost 60% of the cryptocurrency market capitalization. However, there are two more cryptocurrencies that have strong voices in the value stream of the industry.
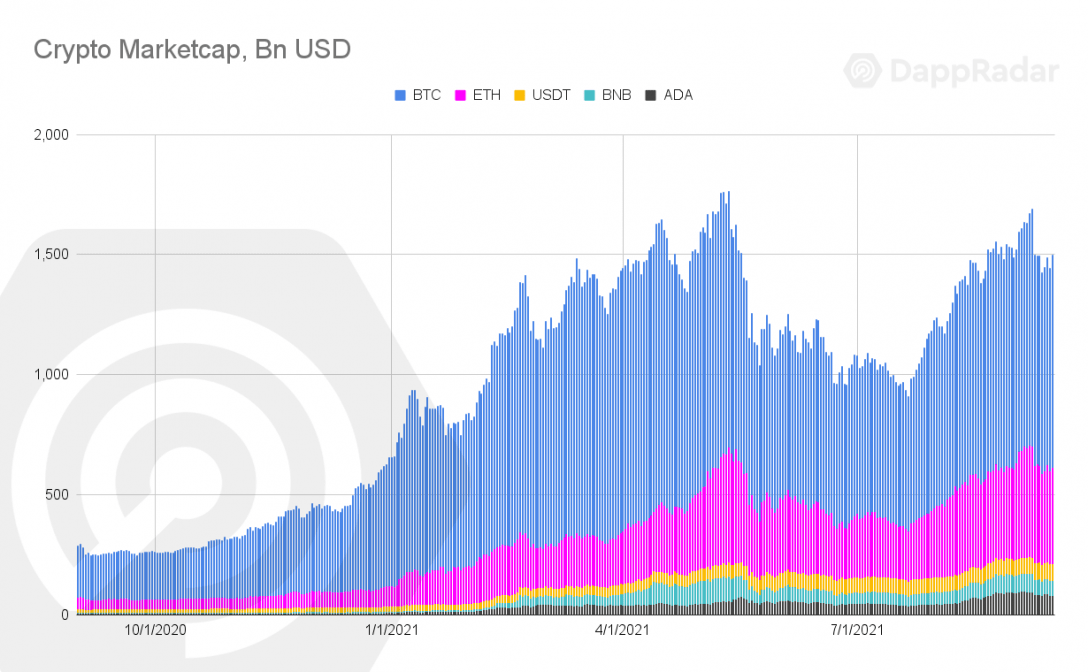
image description
Source: Coingecko/DappRadar
image description
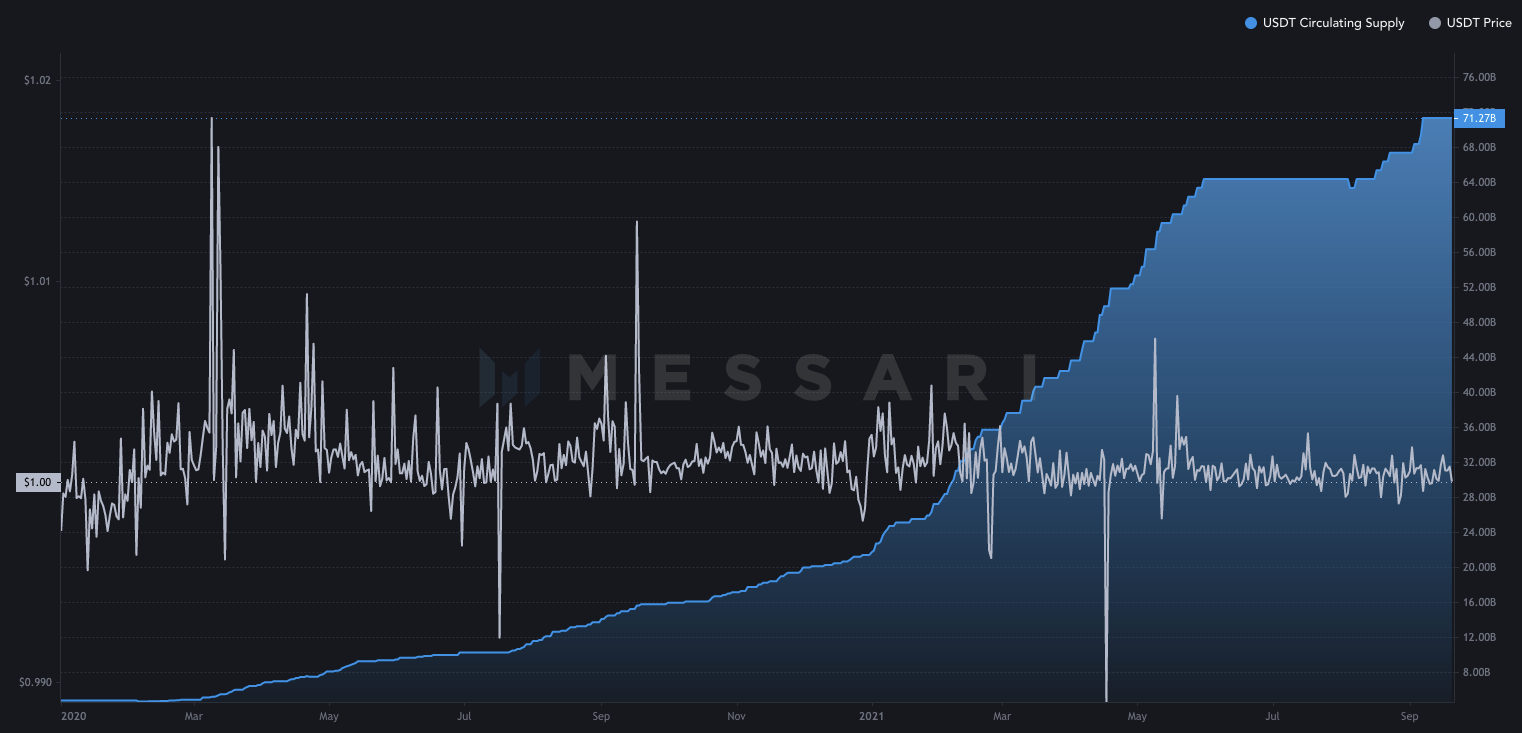
Source: Messari
However, we saw a period between May and August where USDT generation stalled. According to Dune Analytics, the supply of other stablecoins such as USDC, Binance USD (BUSD) or Terra USD (UST) is increasing. Still, Tether is in the lead.
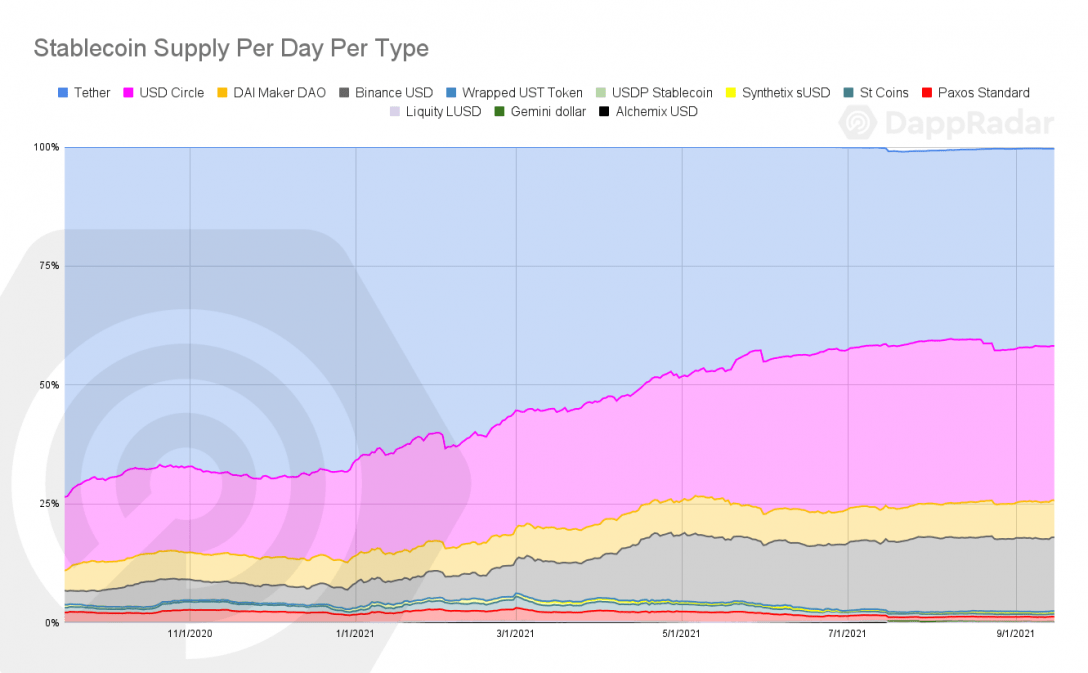
image description
Source: Dune Analytics/DappRadarStablecoins are an important part of the industry, especially a good measure of DeFi.in this case,in this case,. As of now, the above four stablecoins account for around 5% of the total cryptocurrency market capitalization.
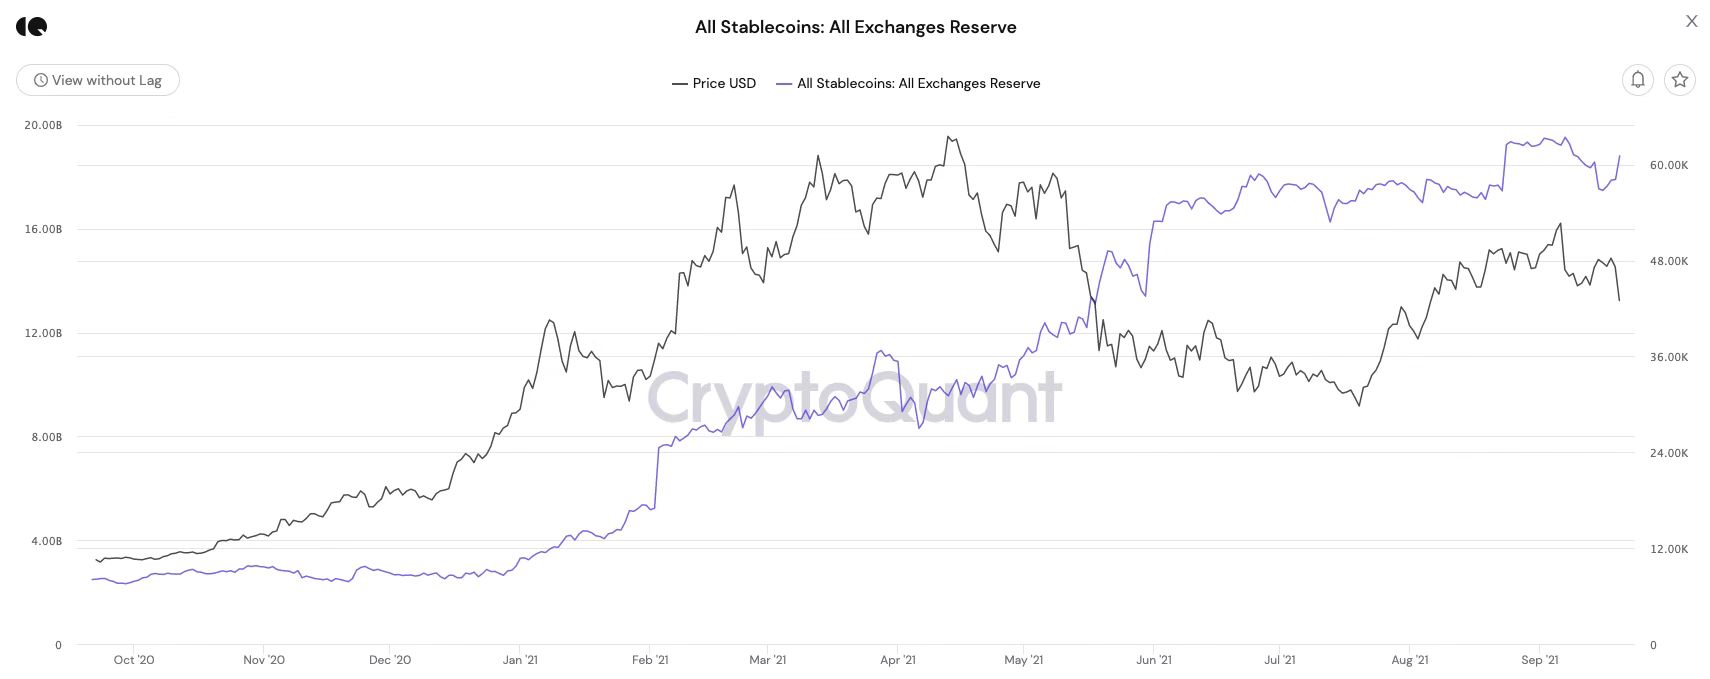
image description
Source: CryptoQuant
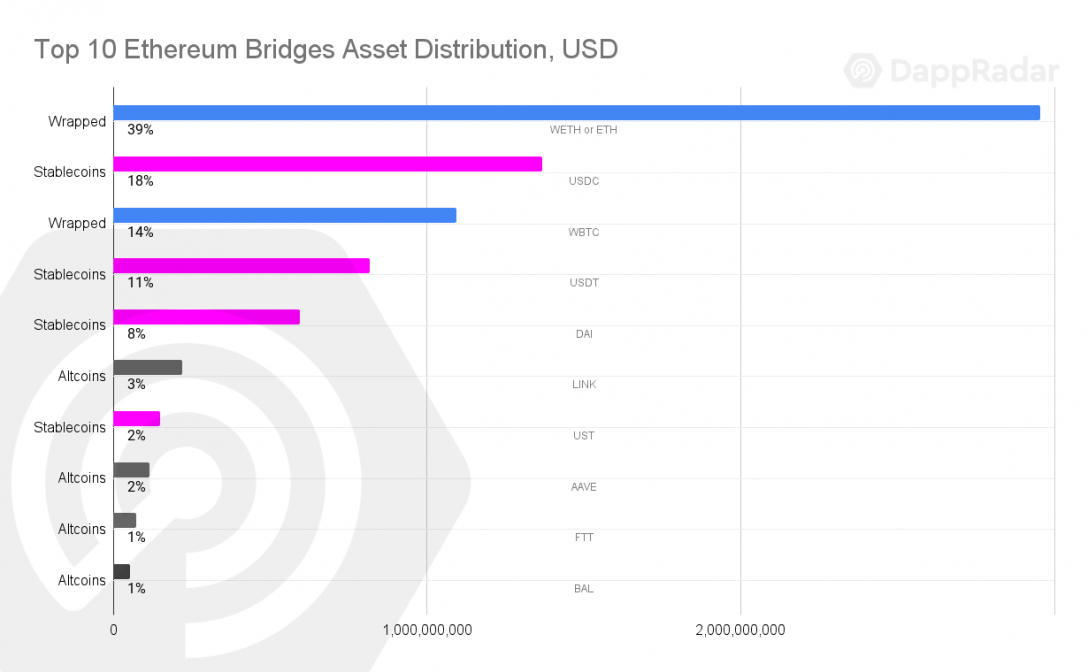
To summarize the value flow of stablecoins, we observe that these types of assets are the most bridging assets in the Ethereum ecosystem. Four stablecoins (USDC, USDT, DAI, and UST) account for 39% of bridged assets on Ethereum, indicating heavy usage in both DeFi and NFTs.
Source: Dune Analytics/DappRadar
secondary title
ADA value flow
image description
Source: Messari
However, it is worth mentioning that the value stream proposition in ADA may change soon. Cardano’s smart contracts are expected to be fully operational in 2022. Once the Cardano ecosystem is fully open, the value narrative of ADA will be different.
secondary title
The top four currencies are just the tip of the iceberg of the industry
The top 4 cryptocurrencies provide visibility to over 67% of the industry’s market capitalization. Combining off-chain analysis with high-level on-chain exploration provides us with an overview of potential value streams within the industry. However, this is just the starting point.
DeFi seems to have become one of the main beneficiaries of value inflows. In the specific case of BTC, we were able to determine how the amount of wBTC has increased in the DeFi space. Coupled with the unusual reserve drawdown on centralized exchanges, we can demonstrate that wBTC usage has increased significantly since the DeFi summer of 2020.
In addition, stable coins such as Tether are key players in the DeFi operating framework. While the reserve analysis does not point to a clear scenario, there is additional on-chain analysis that confirms that stablecoins still drive a particular class of value.





