


Data insight: Looking at the entire encryption market in the near future


Main points of this article:
Main points of this article:
Price movement: DeFi tokens are increasingly correlated with high-cap crypto assets; Bitcoin is losing market dominance.
Volume Dynamics: Litecoin’s hourly trading volume surged above $1 billion, up from just $16 million, after fake news circulated about a partnership with Walmart.
Liquidity: Coinbase’s Tether (USDT) market is becoming more liquid; the cumulative market share of “Ethereum killers” has almost quintupled since the beginning of the year.
Macro trends: Economic uncertainty has increased in El Salvador since it officially adopted Bitcoin as legal tender; U.S. inflation data reignited panic; and macro uncertainty weighed on investor risk sentiment.
first level title
main market
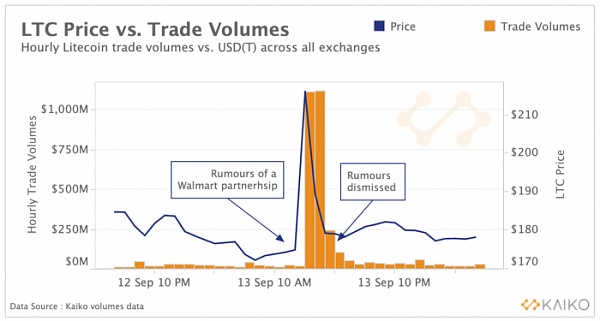
The enormous "power" of the mainstream media. Earlier this month, Litecoin suffered a bogus pump and dump scheme involving a Walmart partnership that somehow infiltrated the mainstream media, causing the price to spike briefly before the news broke. The incident underscores the influence of the media on the cryptocurrency market and how quickly rumors can spread unabated. The culprit of the false story remains unknown, and the incident generated a relatively muted reaction across the cryptocurrency market.

DeFi tokens are increasingly associated with high market cap crypto assets. Last fall, the DeFi industry experienced rapid growth that far outpaced the returns of high-cap crypto assets such as Bitcoin and Ethereum. In September 2020, UNI issued by the decentralized exchange Uniswap is not necessarily the leader of the entire DeFi field, but its price trend has historically been in line with other DeFi tokens such as Aave (AAVE), Synthetix (SNX), and Sushiswap (SUSHI) different. At the time of publication, UNI’s positive correlation with BTC and ETH is relatively weak, hovering around 0.5 in April when prices reached their highs. UNI and other DeFi tokens have historically been more correlated to Ethereum (Uniswap runs on the Ethereum blockchain), but this year its correlation to Bitcoin has increased significantly. (As shown below)
Bitcoin is losing market dominance. Bitcoin has been losing market dominance as ethereum and other altcoins become more and more people's investment choice. Over the past year, the trading shares of bitcoin and ethereum on top legal exchange Coinbase have been changing. It can be observed that today, compared to the trading volume of ETH/USD, BTC/USD trading volume only accounts for 44% of the total trading volume, down from 70% a year ago. This trend points to continued changes in the structure of the cryptocurrency market as investors spread their cryptocurrency investment class beyond Bitcoin.

Ethereum is not the only beneficiary of this diversification trend. Growing concerns about Ethereum's scalability have led to increased attention to Layer 1 blockchain protocols (L1, such as Solana and Cardano), dubbed "Ethereum killers." (As shown below)
Overall, the rise in L1 dominance is a recent trend that has not yet proven to be a lasting shift in market structure.
first level title
market liquidity
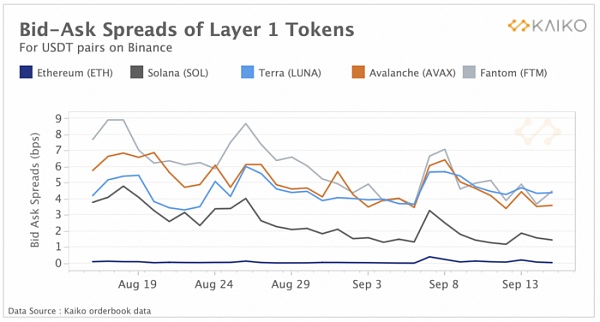
The liquidity of L1 tokens is improving. The liquidity of the L1 token has improved significantly with a growing market share of trading volume. Below we plot the bid-ask spreads for these L1 tokens against the USDT trading pair on the Binance exchange over the past month. Generally, the tighter the spread, the more liquid the trading pair. For Solana (SOL-USDT), the spread has more than halved from 3.8 basis points in mid-August to 1.4 basis points today. The spread on Avalanche (AVAX-USDT) also narrowed from 5.7 bps to 3.6 bps, suggesting market maker investors are providing liquidity to more L1 tokens on Binance.
Price slippage is an indicator of liquidity that is calculated by the difference between the expected price of a trade and the price at which the trade is executed. As shown in the figure below, we plot the price slippage of BTC/USDT on the "traditional three exchanges" Binance, Huobi, Okex and Coinbase. It can be observed that Coinbase's average slippage hovered around 0.03% in early September, down from a high of 0.08% after the May crash. Slippage on Binance, Huobi and Okex is still significantly below around 0.01%.

first level title
Derivatives market
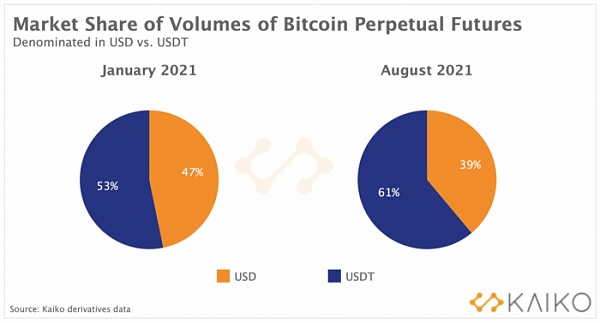
As shown in the figure below, we plotted the market share chart of USD and USDT perpetual contract trading volume on 8 exchanges in January and August 2021 (Binance, Bitmex, Bybit, Huobi, Okex, Kraken, FTX and Deribit). The market share of USD-denominated perpetual contracts has dropped from 47% to 39% over the past 8 months, indicating that traders prefer stablecoins to trade these futures contracts. Stablecoins, especially Tether, are gaining popularity in the derivatives market.
first level title
macro trend
Bitcoin adoption has fueled investor concerns about El Salvador's economic outlook. The recent adoption of Bitcoin as legal tender in El Salvador has increased investor concerns about the country's economic performance and fiscal sustainability. As shown in the chart below, we plot the spread between El Salvador's 30-year and 2-year government bond yields (also known as the yield curve). The yield curve is an indicator of the country's future economic performance. In general, a positive yield curve is associated with economic expansion. By contrast, when yields are higher in the short term than in the long term, the yield curve is negative, often seen as a harbinger of an impending recession. Investors have become cautious about holding shorter-dated bonds as concerns about debt financing mount, pushing up short-term yields.

Since El Salvador passed its bitcoin law in June, short-term yields on the country’s bonds have been rising. The spread turned negative in August after credit ratings agency Moody's downgraded the country's credit rating amid concerns about its fiscal sustainability. The agency believes that El Salvador's use of Bitcoin as legal tender has endangered El Salvador's credit and hindered cooperation with the IMF (International Monetary Fund), which is a key obstacle to its desire to raise public debt financing. El Salvador's debt has been on the rise over the past few years and now exceeds 88% of GDP. El Salvador’s bond spreads fell to their lowest levels in the past year after the bitcoin law came into effect on Sept. 7.

US inflation data reignited panic. The U.S. core consumer price index (CPI), which excludes volatile energy and food prices, is often seen as a measure of long-term inflation. As the chart below shows, CPI rose 0.1% MoM in August (+4.0% YoY at the same time last year), a smaller-than-expected increase and the Fed is correct that inflation is temporary. However, traditional markets fell in response as monetary policy uncertainty added to concerns over a possible increase in corporate taxes. The S&P and Nasdaq 100 closed down 0.6 percent and 0.3 percent. In contrast, the crypto market is up slightly, with BTC up 3% on Sept. 14. This move confirms that the price of Bitcoin is trending in the opposite direction to inflation.
Macro uncertainty weighed on global risk sentiment. The ratio between copper prices, considered a "global indicator of risk appetite," has leveled off in the past few weeks after falling between May and June. The trend suggests economic uncertainty is weighing on investor demand for risky assets even as global central banks maintain loose monetary policy. A rising copper-to-gold ratio suggests that investors are investing more of their assets in copper than in "safe-haven" gold. When the ratio falls, it means that the demand for the "safe haven asset" gold is increasing, and investors' risk appetite is intensifying.
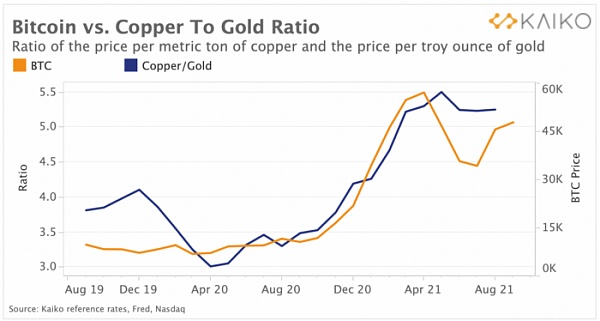
As shown in the chart below, we plot the copper-gold ratio alongside the price of Bitcoin and observe that they have been moving upwards in tandem since 2020. However, the copper-gold ratio was largely flat this summer and appears to have plateaued in August. And the crypto market has experienced a V-shaped recovery after a brief "bear market." But with the price slump in early September and this week, bitcoin has returned to the trend of lower investor risk sentiment, with the price of bitcoin falling 9% since the beginning of the month.





