
MEXC Alpha Trader Research Weekly | Rate cut expectations completely reversed, crypto legislation breaks the ice but faces historic ETF selling pressure
- Core Insight: In the third week of May 2026, the US Senate Banking Committee's passage of the CLARITY Act marks a milestone in regulatory thaw for the crypto industry. However, this positive development was offset by a complete macro reversal. April CPI and PPI far exceeded expectations, eliminating expectations for a Fed rate cut and pushing the probability of a rate hike to 28%. Bitcoin came under pressure, falling below $77,000, and institutional capital ended six weeks of net inflows, shifting to a net outflow of approximately $1 billion in a single week.
- Key Factors:
- The CLARITY Act passed the Senate Banking Committee by a bipartisan vote of 15-9, marking the first time in US history a committee has voted on comprehensive crypto market structure legislation. It now requires a full Senate vote.
- April PPI surged 6.0% year-over-year, with core PPI rising 5.2% year-over-year, its largest increase in over three years; CPI jumped to 3.8% year-over-year. The CME's implied probability of a December rate hike soared from 2% to 28%.
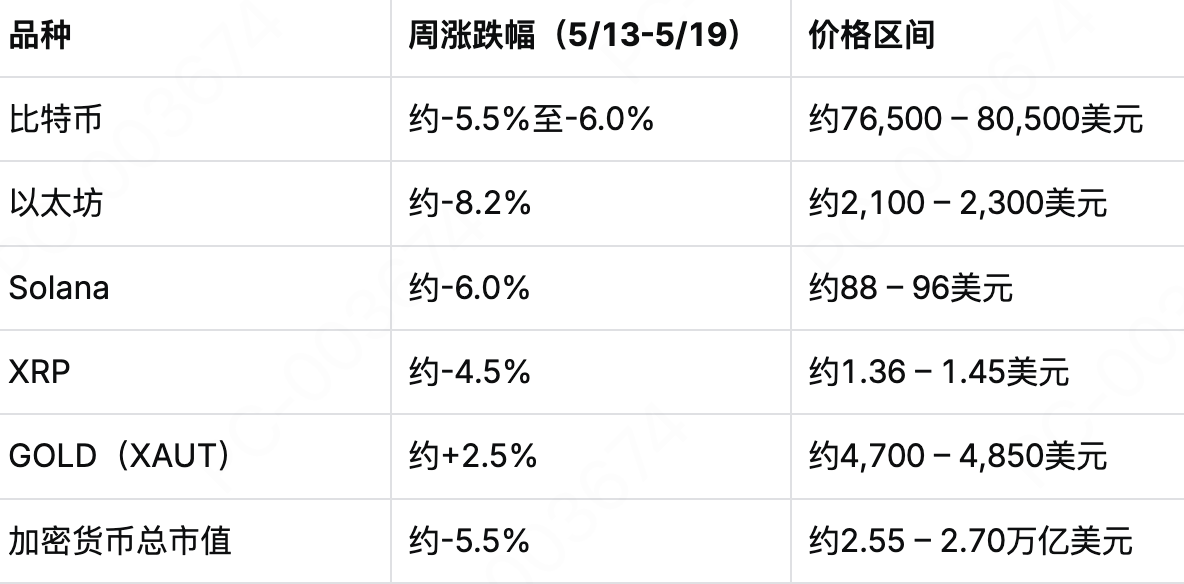
- Bitcoin continued its decline from $82,000 to approximately $76,700 by May 19, erasing most of its gains for the month; Ethereum fell to around $2,100, hitting a two-month low.
- Bitcoin spot ETFs recorded a net outflow of approximately $1 billion for the week, ending a streak of six consecutive weeks of net inflows totaling around $3.4 billion. A single-day net outflow on May 13 reached as high as $635 million.
- Stalemate in US-Iran ceasefire talks pushed Brent crude oil above $110 per barrel. High energy prices reinforce inflation stickiness through transportation costs, further solidifying expectations for Fed tightening.
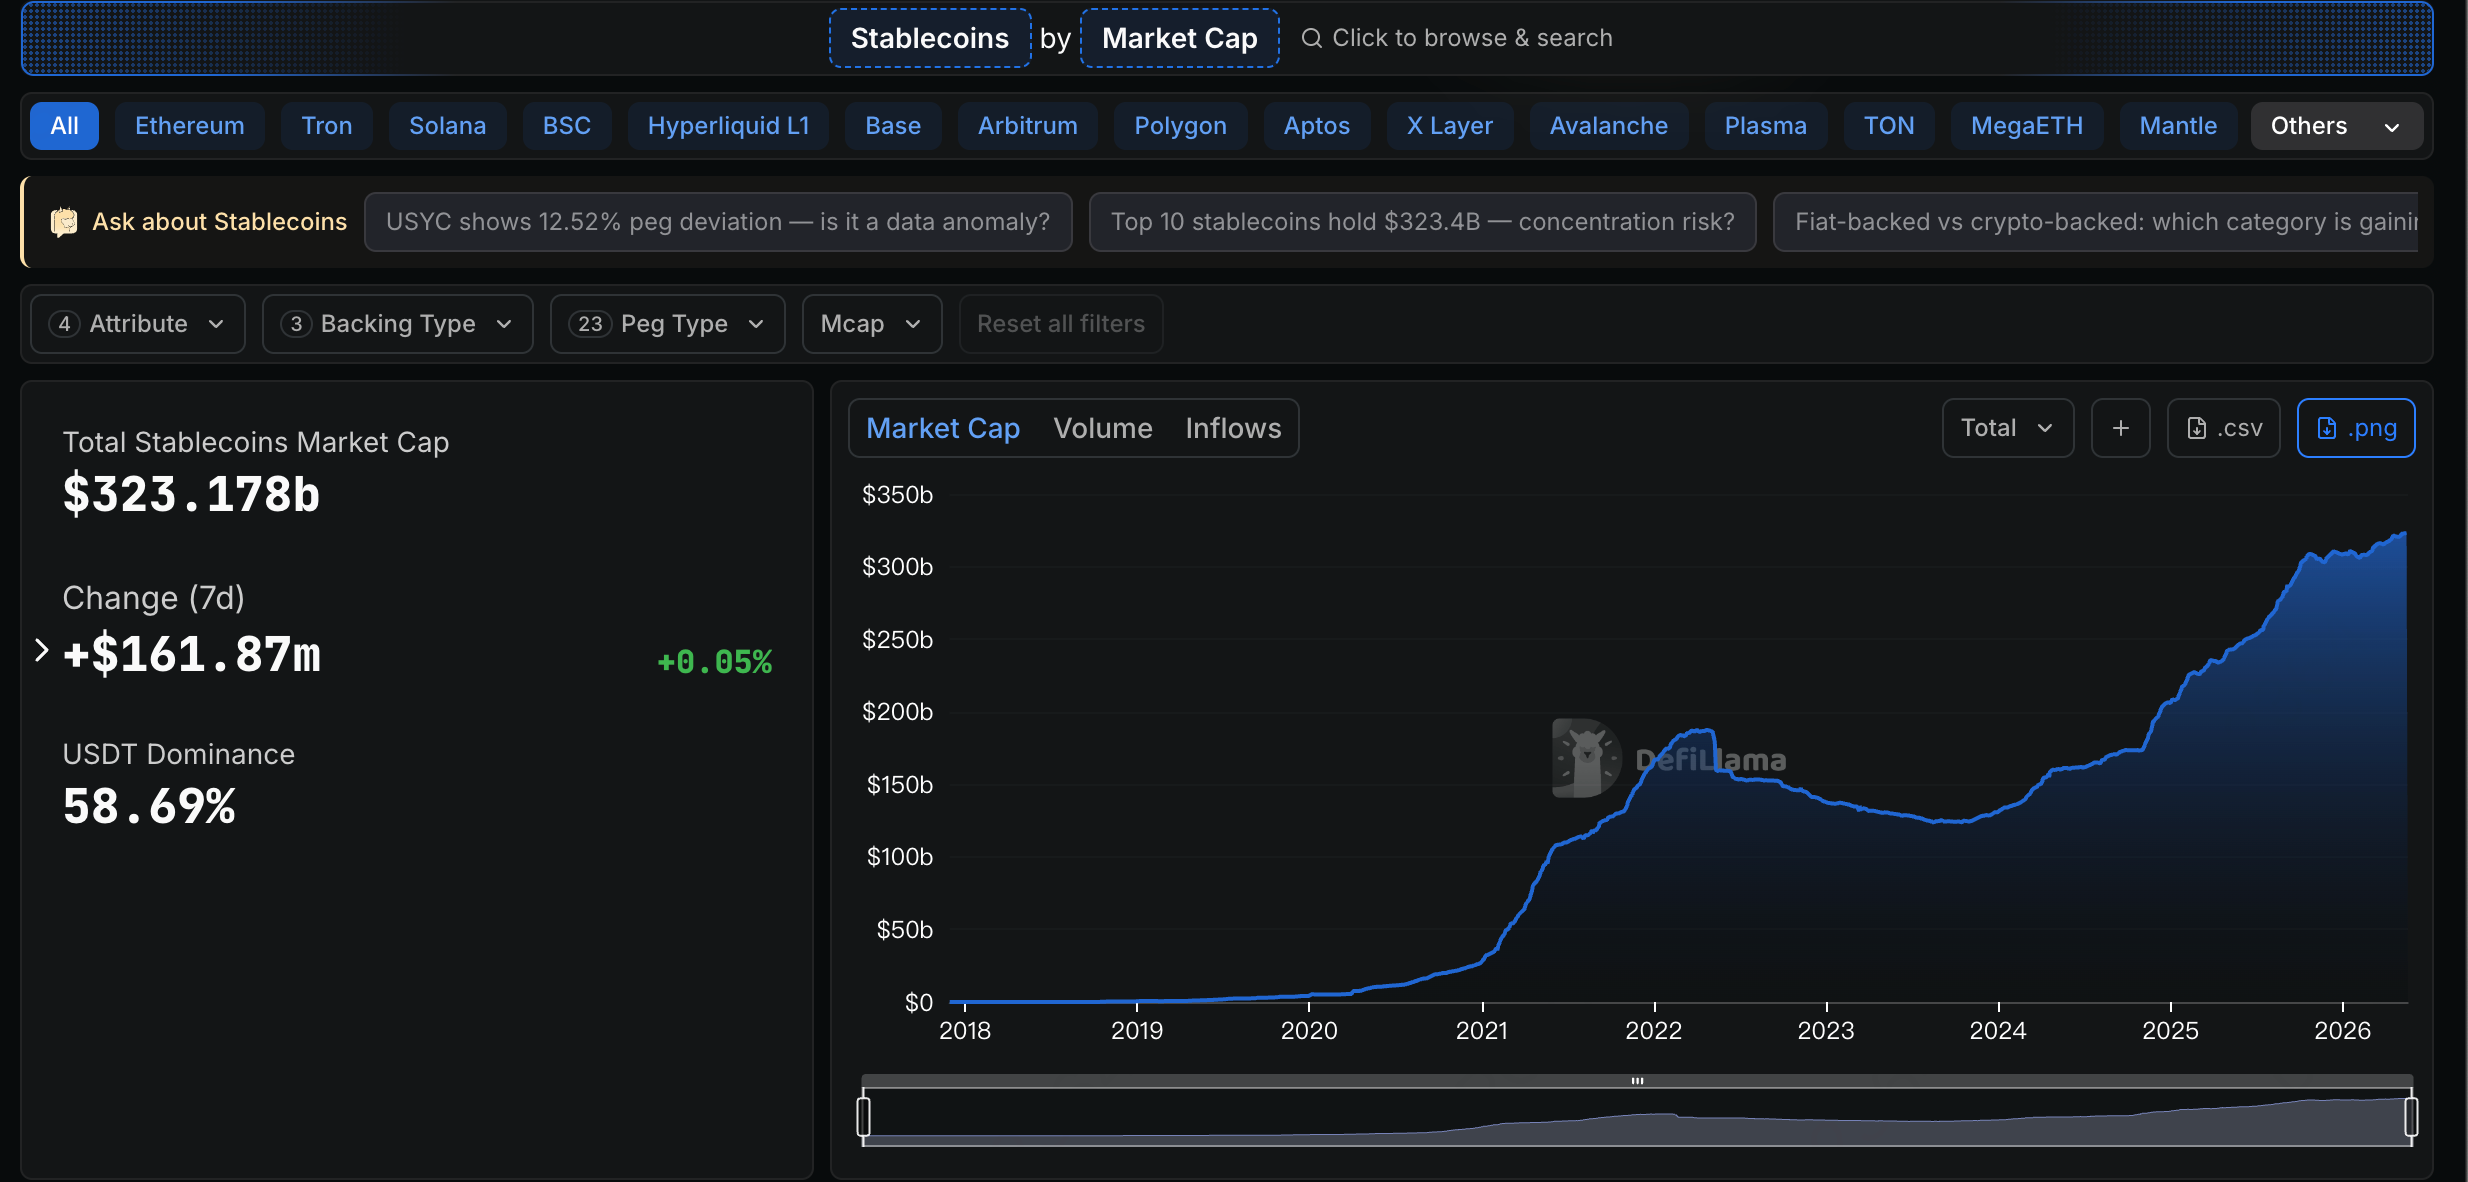
- The total market capitalization of stablecoins surpassed $320 billion. Circle minted 250 million USDC on Ethereum in a single transaction, indicating the on-chain capital pool continues to expand.
- The Nasdaq and S&P 500 ended their six-week winning streak. The 30-year US Treasury yield returned to the 5% threshold. Market focus shifted from "earnings season driven" to "inflation pricing driven".
Week 3 of May 2026
Statistical Period: May 13, 2026 – May 19, 2026
Data Cut-off: May 19, 2026
Core Narrative
The past week marked a critical window for the complete reconstruction of the macro logic underlying the crypto market since 2026. On May 14, the U.S. Senate Banking Committee voted 15-9 in a bipartisan fashion to formally pass the CLARITY Act. This marks the first time in U.S. Congressional history that a committee-level vote has been held on comprehensive crypto market structure legislation, signaling an end to the industry's nearly decade-long regulatory "grey area." However, this legislative breakthrough was unable to offset a deeper macro reversal.
A landmark inflection point has emerged on the macro front. Following the April CPI reading jumping to 3.8% year-over-year on May 12 (the highest level since fall 2023), the Bureau of Labor Statistics reported on May 13 that the April PPI surged 6.0% year-over-year, far exceeding all economist expectations, posting the largest monthly increase since 2022. Core PPI rose 5.2% year-over-year, the largest gain in over three years. This upside inflation surprise, coupled with rising energy costs driven by geopolitical conflicts, has fundamentally shifted the Fed's monetary policy trajectory. The CME's implied probability of a Fed rate hike by December 2026 has skyrocketed from about 2% a month ago to approximately 28%. The 30-year Treasury yield has returned to the 5% threshold, and the market consensus has shifted directly from "rate cuts this year" to "possibility of rate hikes."
Bitcoin experienced significant downward pressure this week. From above $82,000 in early May, Bitcoin slid steadily, breaking below $77,000 during the Asian session on May 19 and briefly approaching the $76,500 level, giving back most of its gains from earlier this month. Ethereum weakened in tandem to around $2,100, its lowest level since April 7. Against the backdrop of a macro reversal, the crypto market entered a risk reset phase in mid-May, shifting from pricing in "regulatory optimism + accommodative expectations" to the more complex narrative of "regulatory breakthrough + tightening liquidity."
Geopolitical factors continue to provide imported volatility. U.S.-Iran ceasefire talks have made no substantial progress. During the Asian session on May 18, Brent crude stood above $110/barrel, and WTI crude broke through $107/barrel, the highest levels since May. Rising oil prices continue to feed into core inflation through transportation costs, further reinforcing the expectation of Fed policy tightening.
In the U.S. stock market, although the Nasdaq and S&P 500 had previously hit record highs for six consecutive weeks, U.S. stock futures fell broadly starting May 13, with the semiconductor sector leading the decline. The market is undergoing a shift from being "earnings season-driven" to "inflation pricing-driven." Nvidia's earnings report and the Fed's meeting minutes will be the two major focal points for the market in the coming week.
1. Core Crypto Market Dynamics
1. Institutional Flows: Six-Week Net Inflow Streak Ends; Weekly Outflows of ~$1 Billion
The strong six-week net inflow streak for spot Bitcoin ETFs officially reversed this week. According to multiple data sources, over the five trading days ending May 15, 2026, U.S. spot Bitcoin ETFs recorded total net outflows of approximately $996 million to $1 billion, ending a previous six-week streak of cumulative net inflows totaling around $3.4 billion.
May 13 was the core day for this wave of selling pressure. According to reports from BingX, CoinDesk, and others, spot Bitcoin ETFs saw a single-day net outflow of $635 million (other reports cite $630.4 million), one of the largest single-day net outflows since 2026. Amidst the triple resonance of ETF selling, inflation data shocks, and long liquidations in the derivatives market, Bitcoin's price accelerated its decline from near $82,000 to around $78,000. Ethereum spot ETFs also recorded net outflows for most of the week, with BlackRock's Bitcoin and Ethereum ETFs seeing combined net outflows of approximately $653.9 million for the week, reflecting a phase of defensive position reduction by institutions after the macro risk reset.
A brief respite in capital flows occurred on May 14. On that day, Bitcoin ETFs recorded a net inflow of $131 million, with total trading volume reaching $2.76 billion, higher than the previous trading day's $1.99 billion. However, this rebound did not continue – a net outflow of approximately $290 million occurred again on May 15, forming a weak weekly pattern of "cliff-like outflow → minor replenishment → outflow again."
It's worth noting that despite the single-week net outflow reaching about $1 billion, the cumulative total net inflow for Bitcoin ETFs remains above approximately $59 billion, and the held positions have not been severely eroded. As of press time on May 19, Bitcoin was trading at approximately $76,769, with total market derivatives liquidations for the day around $180 million. The Crypto Fear & Greed Index has fallen back to 31, placing it in the "Fear" zone.
2. Price Action: Bitcoin Breaks Below $77k; Ethereum Hits Two-Month Low
This week's Bitcoin price action exhibited a pattern of sustained unilateral decline, which can be summarized in three phases on a fundamental basis:
- Phase One (May 13-14): Inflation data shock, breaking below $80k. Following the release of the double-beat inflation data – April CPI at 3.8% YoY and PPI at 6.0% YoY – Bitcoin rapidly fell from above $81,000, breaking the $80,000 psychological level and briefly touching the sub-$79,000 area. On May 13, Bitcoin broke below $80,000 intraday, down more than 2% from its daily high.
- Phase Two (May 15-17): Regulatory good news provides a brief boost, but the rebound is limited. The news of the Senate Banking Committee passing the CLARITY Act on May 15 provided some emotional support to the market, with prices briefly stabilizing in the $78,000-$79,000 range. However, the continued outflow pattern of ETFs capped the rebound's height.
- Phase Three (May 18-19): Macro pressures accumulate, breaking below $77k. Entering the latter part of the week, concerns over mounting macro pressures – including the U.S.-Iran negotiation stalemate driving up oil prices and rising expectations of a Fed rate hike – continued to fester. Bitcoin broke below $77,000 on May 18 and further declined to the $76,500-$76,800 range by May 19, giving back most of its gains since the start of the month.
The Crypto Fear & Greed Index (FGI) dropped to 31 on May 19, entering the "Fear" zone.
Source: CoinGecko, MEXC
Technically, after breaking below the 100-hour moving average and the $80,000 psychological level, Bitcoin's short-term trend weakened. The $76,000 level represents a core support zone since February – it also corresponds to low areas tested multiple times previously. An effective breakdown could open up deeper downside potential. On the Polymarket prediction market, traders are pricing in a 74% probability that Bitcoin will fall below $75,000 by the end of May.
3. Stablecoins: Total Market Cap Breaks $320B; USDC Continues to Expand
The stablecoin market continued its moderate expansion trend. As of mid-May, the global stablecoin total market cap has officially broken through the $320 billion mark. Among them, USDT's market cap stands at approximately $189.6 billion, accounting for about 60% of the total stablecoin market cap; USDC's market cap is around $77-78 billion, accounting for roughly 24-25%. Together, they command nearly 90% market share.
Newly circulating USDC continues to be minted. On May 19, according to Whale Alert's on-chain monitoring report, the USDC Treasury executed a large-scale minting transaction on the Ethereum network, issuing 250 million new USDC tokens in one go. Yield-bearing stablecoins are becoming the fastest-growing niche sector. In Q1 2026, the market cap of yield-bearing stablecoins increased by approximately $4.3 billion, with sUSDS alone attracting over $2.5 billion in new capital. The latest moves by USDT and USDC indicate that the on-chain "dry powder" capital pool is still expanding in an orderly manner.
2. Global Asset Performance
1. Equity Markets: Inflation Data Weighs on U.S. Stocks; Nasdaq and S&P 500 Six-Week Winning Streak Ends
The U.S. stock market shifted this week from being "earnings season-dominated" to "inflation pricing-dominated." With April's CPI (3.8% YoY) and PPI (6.0% YoY) both significantly exceeding expectations, the CME's implied probability of a Fed rate hike by December 2026 surged from about 2% a month ago to 28%, and the 30-year Treasury yield returned to the 5% threshold.
The Fed's April FOMC meeting on April 29 kept the federal funds rate unchanged in the 3.50%-3.75% range. The vote was 8-4, the most divided since 1992. Following the inflation data release, institutions like CICC have revised their previous "possible rate cut this year" forecast to "further rate cuts unlikely this year." Under the base case scenario, U.S. PCE inflation is expected to remain above 3.5% for the year, and core PCE inflation above 3%, both significantly above the Fed's 2% policy target.
On May 13, futures for all three major U.S. stock indices fell, chip stocks broadly declined, and the semiconductor sector led the losses. After hitting record highs for six consecutive weeks, both the Nasdaq and S&P 500 began to feel pressure at elevated levels. The repricing of the Fed's policy path is driving capital out of growth sectors.
Key earnings and events this week: Cisco (CSCO) earnings on May 13; Home Depot (HD) earnings on May 19; Nvidia is expected to report earnings in late May, seen as a litmus test for market sentiment.
2. Commodities: High Oil Prices Oscillate; Precious Metals Face Overall Pressure
Over the past week, the international commodity market showed a clear pattern of "strong oil, weak gold." On May 18, Brent crude broke through the $110/barrel mark, and WTI crude stood at $107/barrel. Key drivers behind this rally include: irreconcilable core differences in U.S.-Iran ceasefire talks; the continued closure of the Strait of Hormuz reducing global oil supply by over ten million barrels per day; the expiration of Russian oil sanctions exemptions in mid-May; and a drone attack on Gulf energy facilities over the weekend.
As of the week ending May


