
代币解锁如何影响价格?基于5000个项目的大数据分析
原文作者:MUSTAFA、CARL
原文编译:深潮 TechFlow
与其他任何投资一样,加密货币也有其独特的风险和挑战,其中之一是了解代币的解锁计划如何影响价格波动和整体表现。在本文中,我们将探讨代币解锁与价格表现之间的关系,并提供创始人的最佳实践以最小化价格波动的影响,并促进社区的健康参与。
TL;DR
作为代币工程师,我们的目标是了解代币解锁设计的不同元素——即解锁的规模、频率、周期和分布——如何影响代币价格的稳定性和长期健康。
我们收集并分析了 5000 多个不同解锁事件的数据,并得出以下结论:
小规模的解锁事件(即将流通供应量从 0 %增加至 1 %)与价格没有实质性关系。
较大规模的解锁事件(即将流通供应量增加超过 1 %)则有明显的负相关关系:随着解锁规模增加,价格下降。
已解锁大部分供应(超过 70 %)的代币其波动率明显较低,相对价格也较高,而在解锁期早期的代币价格则相对较低。
与公募(例如生态系统、社区)相比,对私募(例如团队、投资者)有更多分配的协议表现稍微更好。然而,在我们看来,这种结果不足以以成为代币工程师的首要考虑因素。
从这些结论中,我们提出了创始人在代币经济学上需要考虑的三个方面,简要总结如下:
考虑将解锁的规模控制在不超过流通供应量的 1 %。更倾向于每天或每周解锁,而不是季度或年度解锁。
重新考虑是否包含大规模的解锁事件。这些事件可能会产生重大且不必要的价格压力。
注意,代币价格在分配时间表的早期可能会大幅波动。
目标
尽管几乎每个募资的项目中都存在大规模代币解锁的影响,这是代币设计中一个未被充分研究的方面。这些解锁可以产生相当大的波动性,对社区、代币设计师和交易者造成困扰。
然而,如果做得正确,代币解锁有助于协调质押持有者之间的激励。那么什么是最佳方法?我们深入研究数据,了解代币解锁如何在历史上影响价格走势和整体协议成功。我们能否从数据中收集可概括的原则?创始人如何根据这些见解采取行动?
我们的目标是了解不同解锁设计元素(规模、频率、周期和分布)如何影响代币价格稳定性的普遍见解。
我们假设,更大规模的解锁事件将对价格产生更大的负面影响,而大部分已解锁的代币将优于大部分未解锁的代币,因为许多代币接收者会在解锁事件时出售代币。
数据集
我们从 20 个协议中收集并验证了数据,包括 Uniswap(UNI)、Galxe(GAL)和 BitDAO(BIT),产生了超过 5000 个不同的解锁事件进行分析。数据验证包括查看链上数据和/或确认代币解锁计划与协议核心团队。
截至 2023 年 4 月的归属百分比:
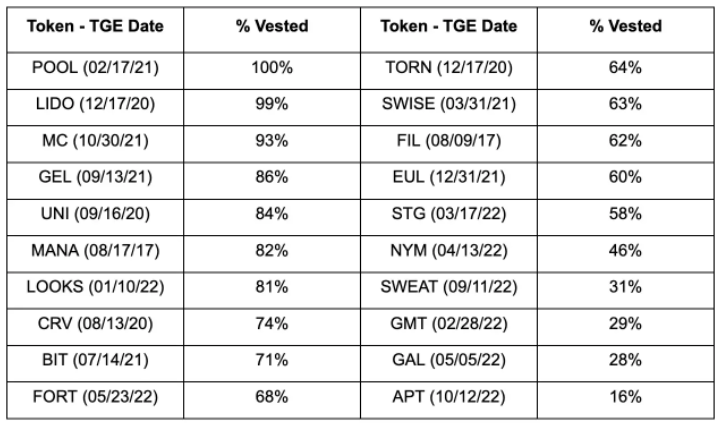
该数据集代表了代币不同的归属计划和市场条件:
分析
一开始,我们调查代币解锁大小与历史价格变化之间的直接关系。为了获得数据的一般趋势背景,我们收集了每个解锁的标准化价格数据,并在一个图表上绘制平均线和中位数线。我们查看一个月的价格数据,解锁发生前后 15 天的窗口期。
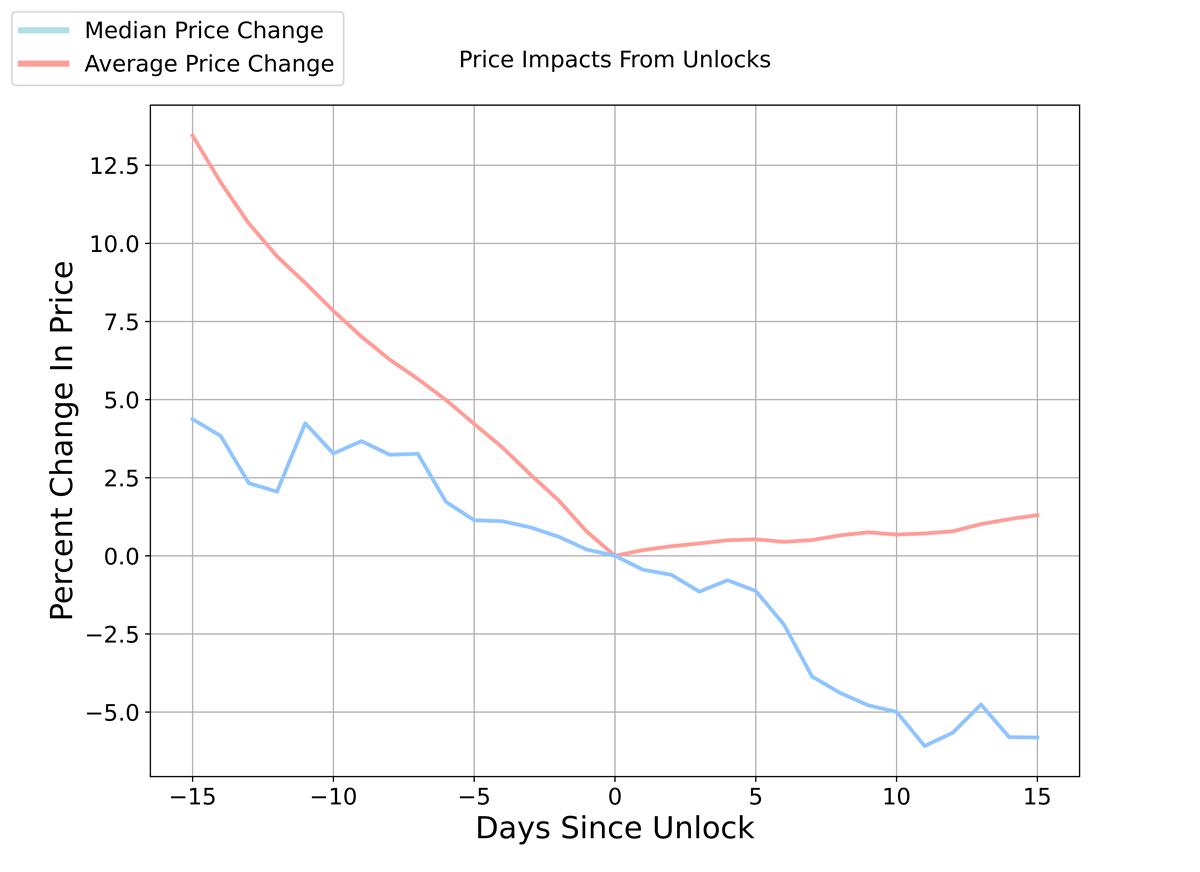
平均而言,代币价格在解锁前 15 天约高出 13 %,并在解锁后适度上涨。中位数线显示了更强的价格下降趋势,在解锁后又下降了 5 %。我们将中位数和平均值之间的偏差归因于极端市场事件中的一些异常事件。因此,我们认为中位数是边际解锁的更好代表。
这些结果符合基本的经济直觉:如果供应快速增加而需求没有相应的变化,价格应该会下降。然而,这种情况显然更加复杂。解锁计划通常是公开的,为叙事构建和事件交易提供了机会。最近,由于轧空*,一些代币解锁已成为看涨叙事。这种预期性活动使情况更加复杂。有没有方法来缓解它?是否值得去缓解呢?
(深潮译注:轧空,股市术语之一,当做空者被迫平仓(清空头寸)而不断买入标的股票时,市场上出现股票的需求量远超过市面流通量情况,因供应不足而导致价格陡升现象发生)
尽管这种分析水平证实了价格围绕代币解锁的自然直觉,但我们可以应用更严格的分析技术来挖掘更强大的见解。
相关性分析
当日分析
我们首先通过分析单日价格变化来评估市场对解锁的反应。下面我们绘制了价格百分比变化(与前一天相比)与流通供应量百分比变化之间的图表。本质上,这试图衡量解锁规模和价格影响之间的关系。如果我们的相关性显示负相关关系,那么就意味着更大的解锁与更大的价格下跌有关。
我们将两种不同类型的解锁进行分类:私募解锁和公募解锁。私募解锁包括团队、合作者、投资者和顾问,而公募解锁包括国库、生态基金、社区分配和空投。总共,我们收集了 2187 个公募解锁事件和 4546 个私募解锁。
在比较私募和公募解锁时,我们发现公募解锁很小——通常低于总供应的 2 %——而私募解锁的规模和价格影响范围更大,并呈现负相关关系。这是有道理的,因为向内部人员解锁通常包括类似于悬崖式解锁(Cliff )和/或季度解锁这样的大事件,其中一些内部人员可能会在收到代币后出售。
对私募解锁进行隔离得出以下结论:
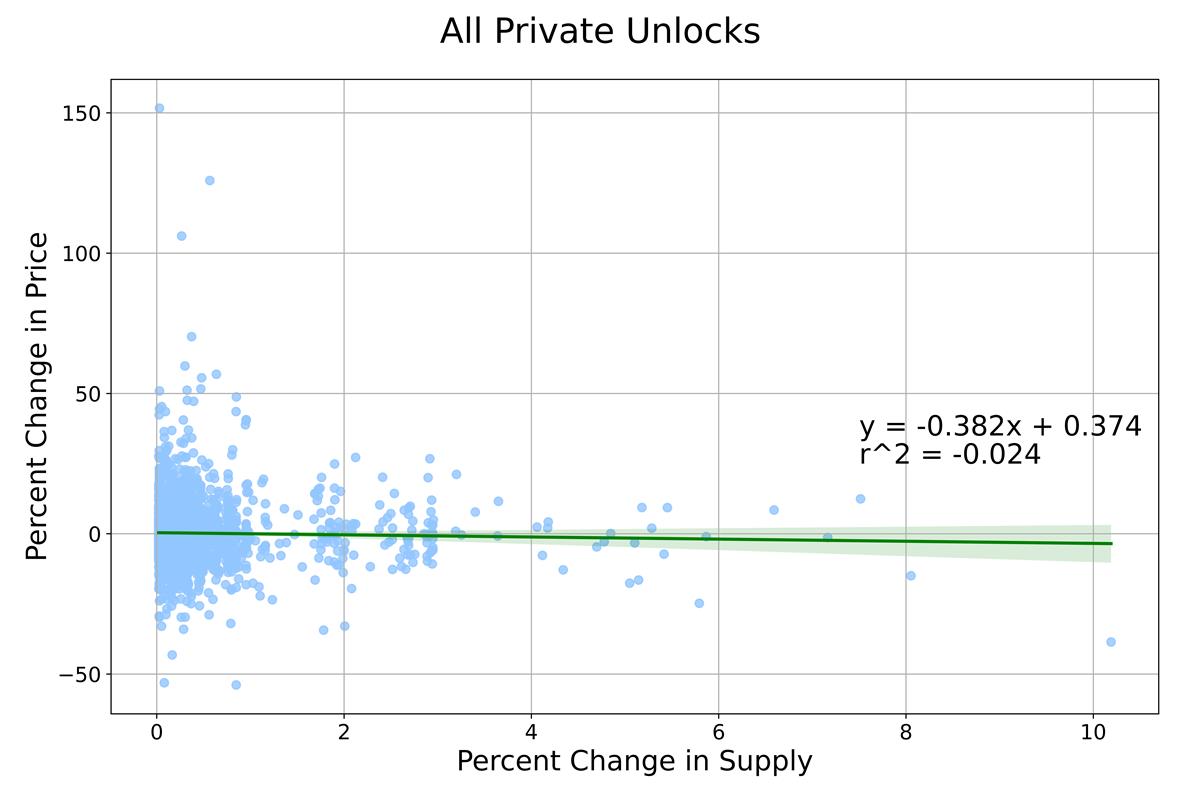
一个值得注意的特征是供应量解锁的 0% 和 1% 之间的点簇,表明在不同的解锁规模范围内可能存在不同的关系。为了调查这一点,我们分别观察解锁量在 0 %至 1 %和大于 1 %之间的情况。
对于第一个簇(解锁量为 0 %-1 %),我们发现没有线性关系。这符合小规模解锁对价格影响较小的判断,但人们仍然预期随着解锁规模的增加,价格影响会增加。相反,似乎在此范围内的任何解锁规模通常具有类似的影响。
对于第二个簇(解锁量大于 1 %),我们看到更强的负相关关系,表明随着解锁规模的增大,价格下降。这与我们的假设一致,即更大的解锁会导致更大的价格下降。由于代币价格中有几个外生变量,我们知道不会期望高度相关,但认为 16% 对代币价格数据有意义。
此外,宏观因素在我们的分析中也起着重要的作用。如果我们的数据在很大程度上受到宏观经济因素的影响怎么办?我们进行了许多分析,以了解宏观经济因素的影响,并得出结论,宏观经济因素对流通供应量的变化的影响很小。
更长时间窗口期
单日分析的一个明显缺点是缺乏解锁前后的价格数据。我们假设在代币解锁发生时存在前瞻性和反应性效应,这可能需要几天或几周才能显现。例如,在重大解锁事件前几周,空头卖方可以建立头寸,或者内部人员可能需要几天才能因流动性不足而退出头寸。为了调查这一点,我们对更长时间范围进行了类似的相关性分析,包括解锁前后 3 天、 1 周和 15 天。
对于解锁事件的前期,我们计算了解锁当天与窗口期第一天之间的价格变化。因此,相关性的符号意义被倒转。正相关意味着解锁前的价格较高,负相关意味着价格较低。如果我们认为直觉是正确的,那么我们预计在解锁前几天会看到正相关关系,因为预期的抛售压力导致价格下跌导致解锁。同样,随着价格继续下跌,我们应该会在解锁后的几天内看到负相关性。
同样地,我们发现 0 %至 1 %的解锁关系很小。在解锁前和解锁后,最佳拟合线通常是平坦的,表明对于这种规模的解锁,两种类型的分析都没有表现出持续的价格影响。
而对于流通供应量大于 1 %的解锁,我们得到以下关系:
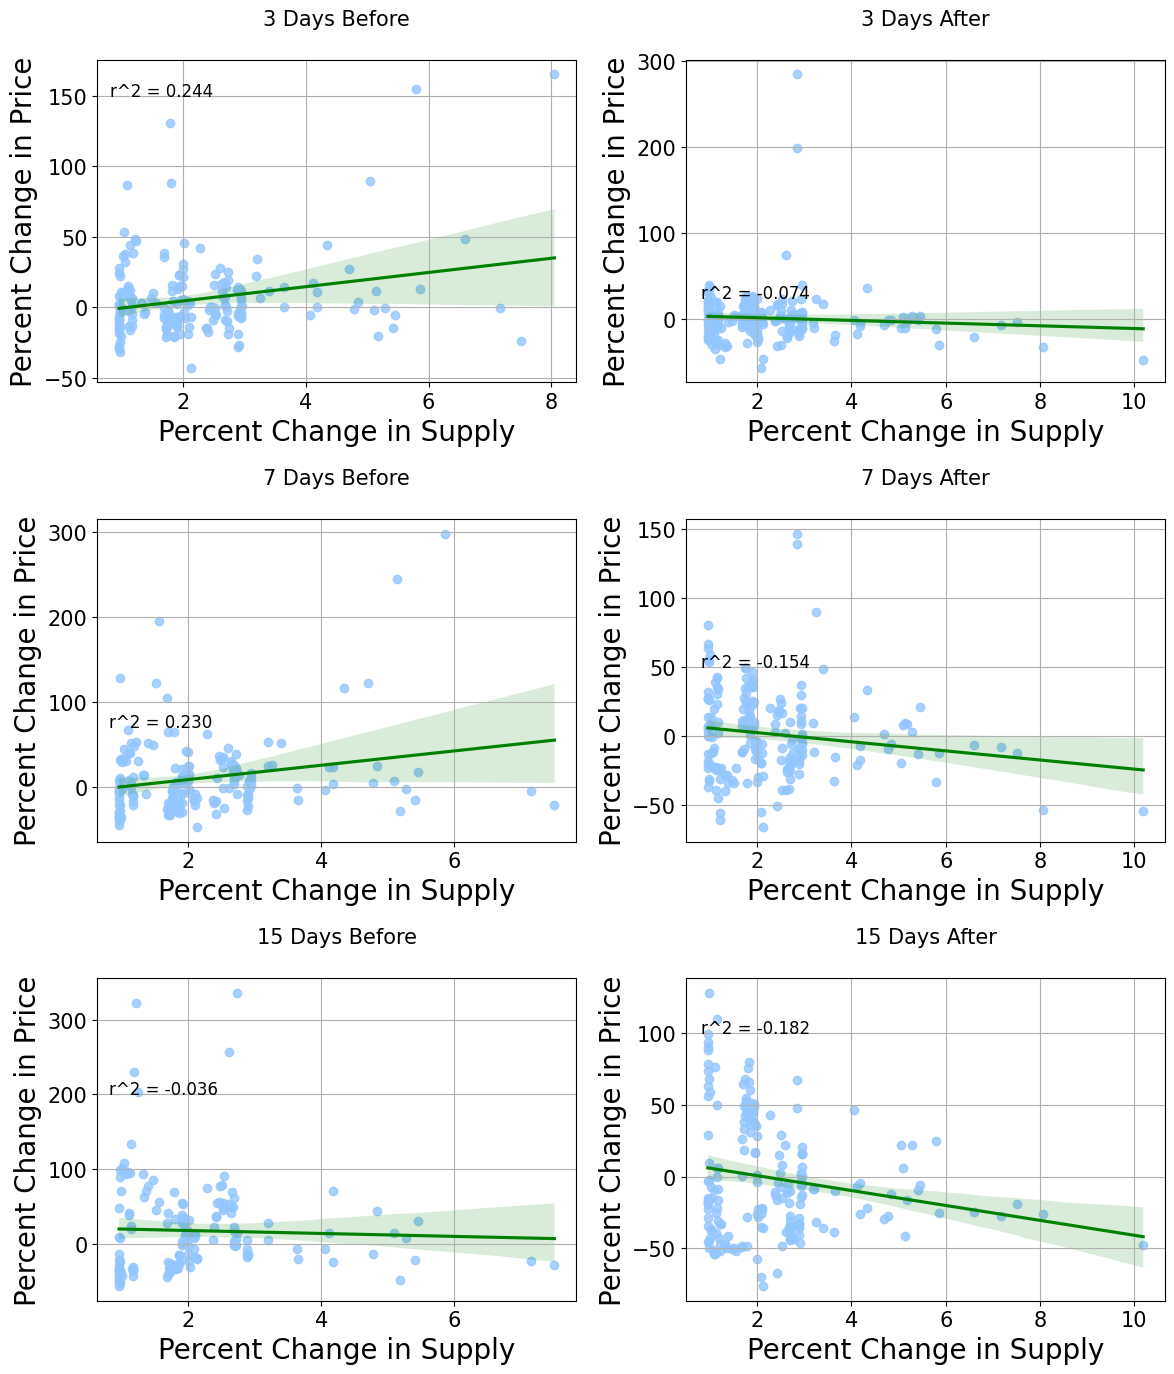
作为初步的警告,我们强烈声明严格来说无法证明因果性,而是将这些结果作为相关性可能的证据,以供考虑和进一步研究。此外,我们将相关性分析限制在两周的时间窗口内,因为长期测量将越来越包含不可知或不可测量的因素。最后,随着时间窗口的增加,可能会有一些代币解锁重迭,但我们认为这些影响的影响极小。在考虑到这些注意事项的情况下,我们的结果应该作为一个有用的、基于证据的指示,表明价格通常倾向于以某种方式围绕价格解锁。
乍一看,这些结果似乎支持了我们的假设。通常在解锁前出现正相关性,表明解锁前价格较高。在解锁发生后,我们看到负相关关系,表明价格下降了。
在解锁发生前的 3 天和 7 天时间窗口中,我们看到价格和解锁规模之间存在相对较强的相关性(24 %和 23 %)。此外,在解锁后的 3 天和 7 天期间,相关性为-7 %和-15 %。这表明在解锁发生前最多一周,存在更强的价格压力,这很可能是由于公开已知的解锁事件的预期。另一方面,我们的数据更接近解锁后几天的回归线,表明对这个结果更有信心。
在解锁前 15 天的时间窗口中,相关性发生了转变,成为一个弱的-3 %相关性。我们过滤了所有每日解锁,仅检查每周和不太频繁的解锁,以减少解锁之间的“交叉污染”。缺乏结果可能表明预期效应在这个时间跨度内不那么强烈,而是更常见于接近解锁日的时间点。然而,在解锁后的 15 天内,该效应是我们所有时间窗口中最强的,相关性为-18 %。这表明虽然预期效果可能不会在 15 天前开始,但最终抑制价格的效果会在 15 天后出现。
模型分析
我们无法依靠经验数据进行长期分析,因为在太长的时间段内存在许多外生因素。然而,我们可以使用基于代理的模型(Agent Based Models)*,这些模型是具有离散变量的封闭系统,以了解长期影响。
(深潮译注:一种用来模拟具有自主意识的智能体(独立个体或共同群体,例如组织、团队)的行动和相互作用的计算模型,通过图像展示评估智能体在系统整体中的作用)
我们模拟了三种不同的情况和一个对照组。在对照组中,没有代币分配给机构投资者。然后,我们引入一个持有 8 %代币供应量的机构,用于我们的实验:代币每隔一天、每月和每 6 个月解锁。
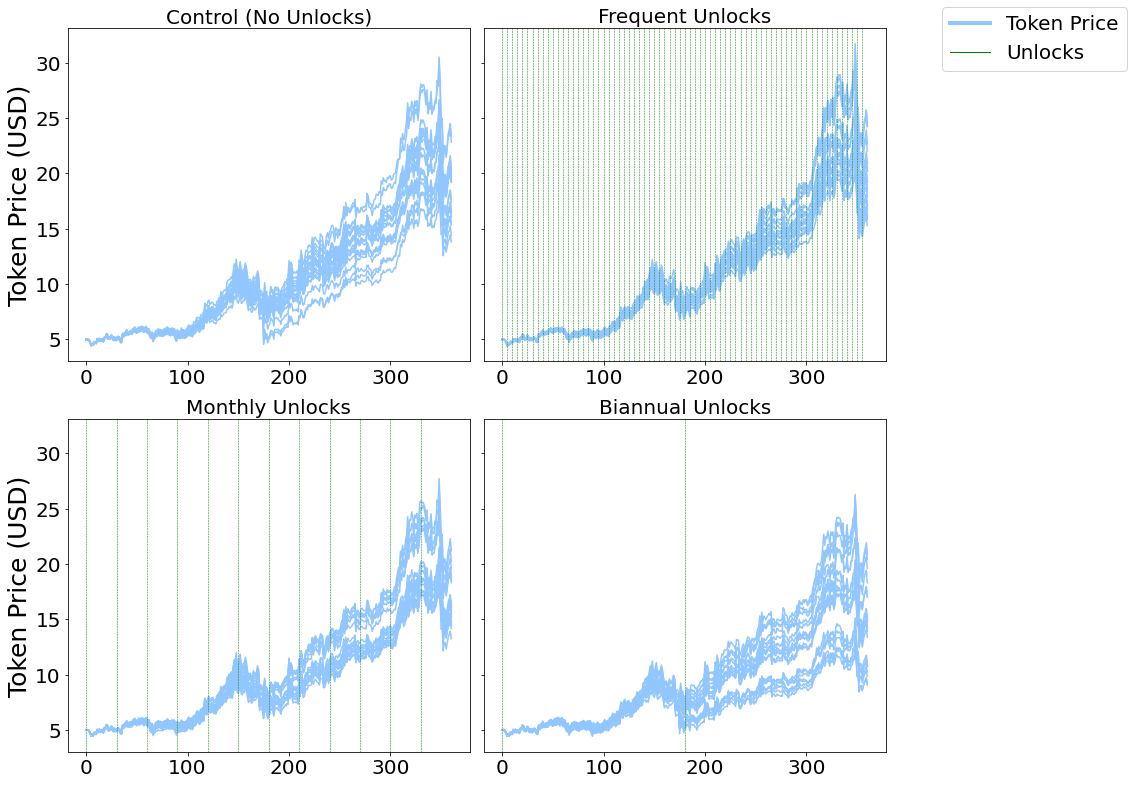
总体而言,我们发现与经验结果类似的结果,表明更大的解锁会产生更大和更持久的代币价格下跌。在更长的时间范围内,随着解锁规模的增大,我们看到了越来越大的差异和变化。
相关性总结
当查看特定的解锁事件时,我们发现在解锁发生前后,价格通常会下降,下降程度与解锁规模成比例。我们不打算严格证明因果关系,因为市场影响复杂且不可知,并且无法进行并行实验,因此在分析价格数据时单因素回归是不够的。
解锁期限
我们的另一个假设是,一些代币接收者在收到代币后可能进行抛售,这意味着与大部分已经或完全解锁的代币相比,早期解锁的代币可能会在较低的流动性环境中有到更大、更持久的抛售压力。
为了评估这一点,我们将数据集分成两个部分:大部分解锁(>= 70 %解锁)和大部分锁定(<70 %解锁)。其中大部分已解锁的代币有 9 个,而大部分锁定的代币有 11 个。
应该注意的是,这些代币在发布时属于这些类别,因此我们检查最近一段时间以衡量它们在当前既得状态百分比下的表现。我们看 4 个月,从今年 1 月 15 日到 4 月 15 日。为了衡量表现,我们重点关注两个指标。
平均方差。我们不使用方差或标准差,而是使用变异系数,这是一种将标准差除以均值的度量方法。这样可以直接比较不同资产之间的波动性,而不会受到代币价格变化的偏斜影响。本质上,我们测量了在时间段内代币价格出现的差异和波动性有多大。
平均价格变化。从时间段开始到结束的价格百分比变化。我们使用这个指标来了解代币与市场相比的表现。
经过对比特币和以太坊运行相同指标的测试之后,我们得出以下结果:
这两个组的行为差异很大。大部分已解锁的代币更加接近 ETH 和 BTC,意味着它们基本上会按照市场的走势而运动。然而,在大部分还未解锁的代币中,我们看到它们在同一时间段内价格有相当大的下降,并且方差比大部分已解锁的代币高 2.6 倍。显然,已经解锁了大部分代币的代币比仍在解锁代币的代币要稳定得多,并且价值上升得更多。这证实了我们的假设:一旦大部分代币解锁,代币的价格就变得更加稳定。我们认为这是因为代币已经转移到了那些对协议有更长期信仰的社区和投资者手中。
Token 分配
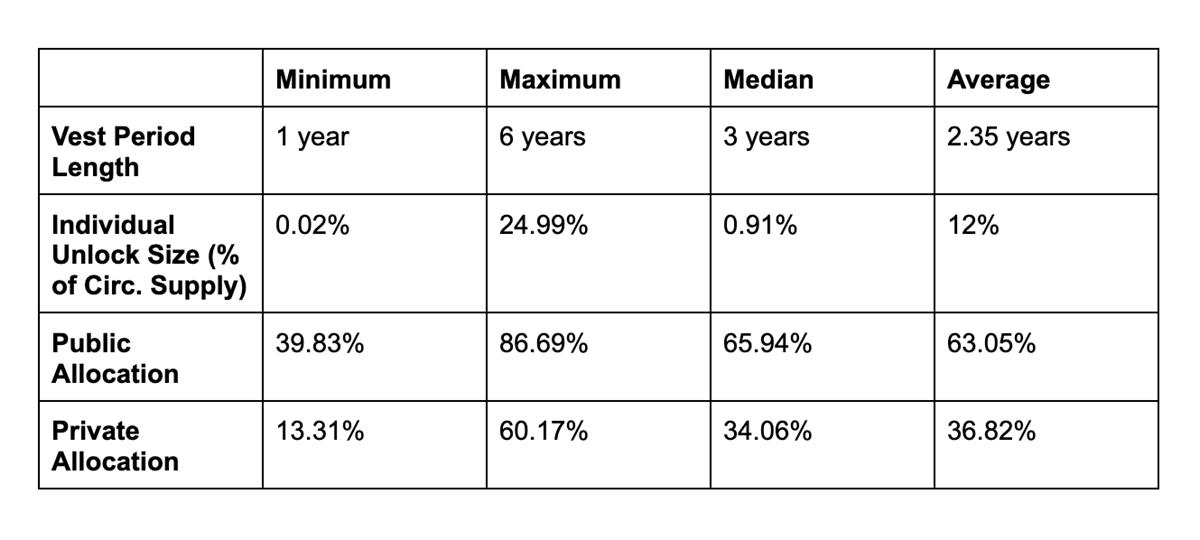
如我们的汇总的统计所示,代币的平均分配为 63 %的公募和 37 %的私募。同样,我们将 20 个代币分成了两部分:“更多公募分配”(8 个代币)和“更多私募分配”(12 个代币),然后按照与上面类似的方式进行了分析。
我们的假设是,拥有更多私募分配的代币会经历更大的波动,因为围绕大规模私募解锁可以建立叙事,特别是来自“内部投资者”的抛售。在进行相同的分析后,我们得出以下结论:
2023 年 1 月 15 日至 4 月 15 日
2022 年 10 月 1 日至 2023 年 1 月 1 日
有趣的是,私募代币在两个时间段中的波动性和价格表现都稍微好一些。这可能是因为一些私募代币持有者利用场外交易服务来买卖代币而不会影响价格,而这些服务通常不向社区(即散户参与者)提供。然而,这些结果并不足以为代币分配创建强有力的建议。作为一个普遍的立场,我们始终更多的向社区分配,并认为社区对于健康的协议和更广泛的加密行业至关重要。
总结
总的来说,我们的模拟研究结果显示了与经验相似的结论。解锁量大于流通供应量的 1 %会导致解锁规模与价格之间的负相关关系。有趣的是,对于较小的解锁而言,影响几乎不存在。我们还发现,大部分代币已经解锁的协议更接近市场,并且表现好于那些处于早期解锁周期的代币。最后,私募分配比例较高的代币的波动性略低,价格表现也较好。
这些结果为项目创始人提供了一些结论。
1% 规则:寻求减少代币价格波动的创始人应该在相对于流通供应量中解锁更少的代币数量。我们的数据表明,解锁不到供应量的 1 %与价格影响无关,这意味着可能更喜欢按块、每日或每周的时间表进行解锁,而不是季度和年度的解锁事件。较小、更频繁的解锁的另一个显著优点是潜在的卖压更平稳地分布,而不是集中在大型事件上。
重新考虑分配:我们观察到在代币大型分发前价格下降最为明显。在某些情况下,这会导致价格下降 20 %,需要长达 2 个月才能恢复。减少分发大型事件,有助于消除任何强化负面故事以及不健康的杠杆交易行为。创始人应该考虑解锁一年的代币数量可能会产生的后果,而不是将大型分发作为默认的代币设计。美国团队可能需要延迟 1 年的解锁来保持符合现有法规。为了实现这个目标,团队可以在一年后开始解锁代币,而不是在一个事件中一口气解锁一年的代币。
在解锁时间表周期初期可能会出现更高的波动性和价格压制:知道这个理论的创始人将能够更有效地向投资者和社区传达期望。此外,创始人可能考虑设计解锁时间表以更快地达到“大部分解锁”的状态,而不是在长时间内拉长解锁时间表。然而,在长时间段内,由于存在太多外生因素,无法有意义地确定最佳的代币解锁时间。


