
DeFi避坑指南: 五步帮你找到值得投资的DeFi项目
撰文:Footprint分析师Bella(bella@footprint.network)
日期:2021年10月
数据来源:How to Discover Valuable Projects(https://footprint.cool/valuableprojects)
随着加密市场的发展与热度上升,吸引着越来越多的DeFi项目涌入,同时也吸引着大批量的投资者。2021年DeFi发展可以用迅猛来形容,TVL(截止发稿前)较年初的214亿美金增长860.42%;链上的DeFi项目也从年初的174个发展到554个,增长率高达218.39%。DeFi市场的繁荣之势不仅让投资者获得高于传统金融投资的收益,也增强了信心。
由于DeFi具有去中心化的属性,一个新项目的开启无需获得相关部门的审批,成本也极低,打着各种旗号进行招摇撞骗的项目也屡见不鲜,稍有不慎就会误入诈骗平台的圈套,项目如此多,如何避坑并挖掘具有投资价值的项目,对个人投资者来说是参与DeFi投资的必修课。
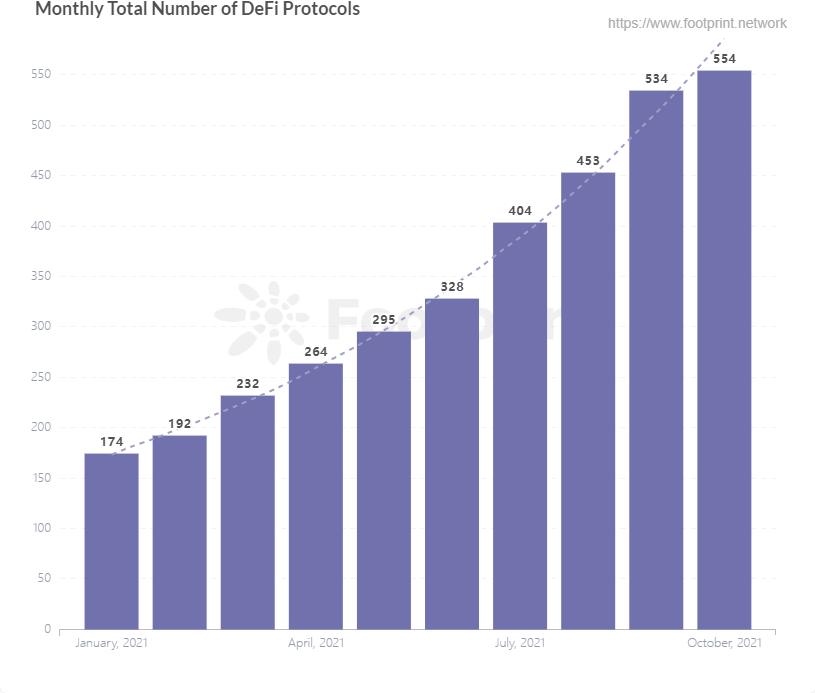
2021年每月DeFi项目数量变化,数据来源:Footprint Analytics
为更好理解不同指标的评估意义,让我们先看看目前TVL排名前10的平台的各项基本指标有何特点:
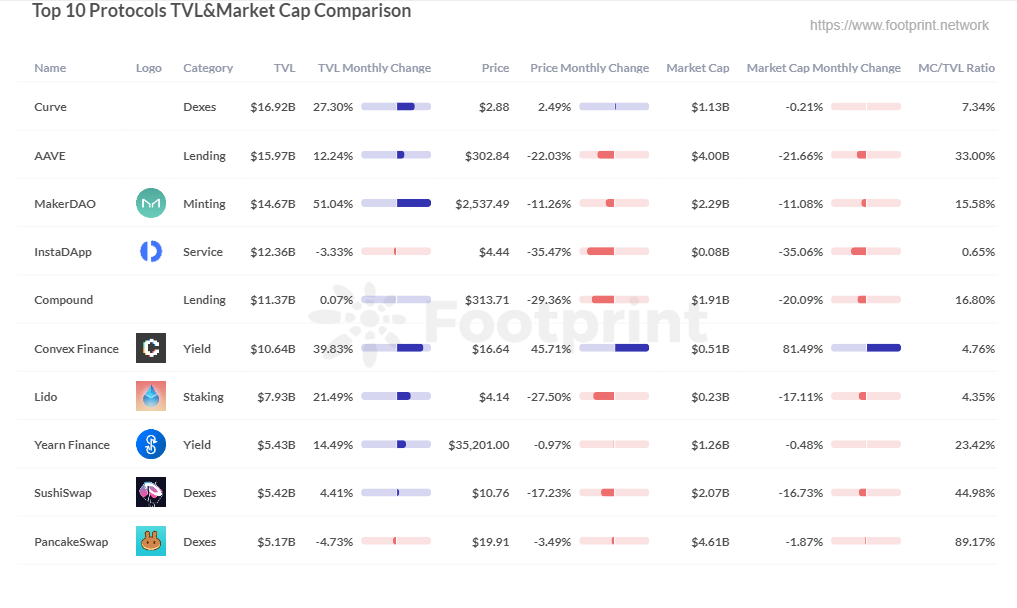
前10大TVL平台各项指标对比(锁仓量、价格、市值),数据来源:Footprint Analytics
1. 总锁仓量(TVL)
对参与DeFi投资的人来说,TVL这个指标并不陌生,可在各大数据平台(如DeFi Llama、CoinGecko、CionMarketCap)上获取所需的DeFi平台TVL数据。TVL指用户存入并锁定在协议中的资产总额,该值越大代表着该项目集聚的资产越多,用户对该项目的信任度高,更愿意将资产存入该平台进行各类经济活动(如提供流动性、提供抵押等),汇聚的用户量也越多,受欢迎的程度越高。
从上图看,TVL排名前十的平台,除了体量大(高于50亿美金)外,TVL月度基本保持增长趋势,这证明项目在持续保持其活力和实力。
2. 市值(Market Cap)
市值反映一个项目在DeFi行业的市场价值,该指标与传统股票市场的计算方式类似,主要受币价与已流通可供交易的代币数量影响。
如上图所示,由于代币数量受流通量以及供需影响,币价是随时变化从而影响市值变化,但市值涨幅或者跌幅保持在20%左右的合理区间,并无出现暴涨再悬崖式暴跌的情况。
对基础指标了解后,让我们看如何利用基础指标进行项目评估,发掘有潜力、值得投资的项目。
TVL排位不宜太后,在排名位列于中段及以上项目挑选对象
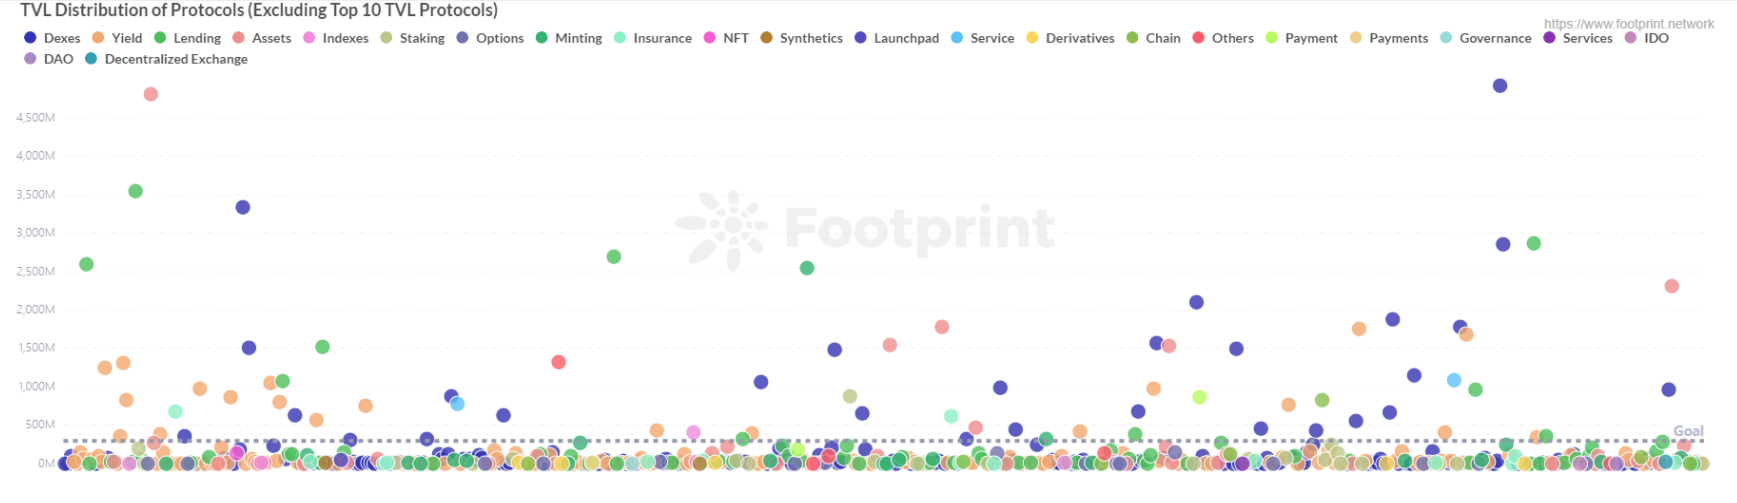
各TVL平台分布情况,数据来源:Footprint Analytics
如上散点图,当前的DeFi项目有五百多个,其中,刚兴起以及TVL体量小的项目众多(TVL低于500万美金的平台占比高达33%),如何从众多项目挑选适合投资的项目?安全起见,为防止规模太小的项目出现卷款跑路的风险,个人投资者在确定投资对象时,尽量从TVL位列中段及以上的范围内进行项目挑选(约2,000万美金)。
对DeFi项目来说,100万美金到1,000万美金的项目适合于投资机构进行种子轮投资,不适合于个人投资者,因该类型项目未来的发展定位、战略方向并不明确。
TVL在1,000美金到2,000万美金的项目虽说已找到合适的发展战略,投资者也能获取该部分项目的数据,但从稳定性方面考虑,此类项目存在增长受阻的情况,一旦增长力不足,极易出现增长疲软抑或下跌的风险。
TVL在2,000万美金到5,000万美金规模的项目,一定程度上已经找到明确适合的产品机制与增长点,社区与技术支持逐渐趋于完善,若想要获得高于头部平台的收益,此类平台是一个不错的选择。
如若风险承受能力较低,对收益需求没有太高,则可以从头部平台依据自身喜好的DeFi项目类别(如DEX的提供流动性,Lending的借贷等)选取项目进行投资。
代币价格稳定,代币分配机制合理
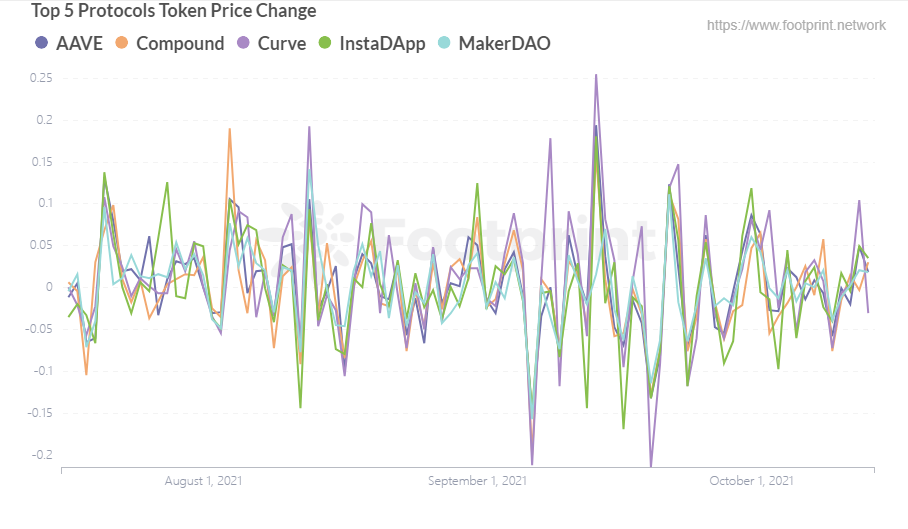
前5大TVL平台代币价格变化情况,数据来源:Footprint Analytics
通过TVL指标挑选合适备选项目后,则需要通过项目代币的情况进行进一步筛选,依据头部平台代币价格变化规律(如上图),主要从两方面进行评估:
其一,代币价格是否保持相对稳定的涨跌趋势(涨幅或者跌幅不宜超过20%)。若代币价格相对保持稳定则表名代币的流通性较为稳定,因单个投资人大量抛售代币而对项目造成损害的可能性变小。
其二,代币的发行机制是否合理。如团队/基金会持币比例是否过高,若过高则该项目为“圈钱”而来的目的性增加;代币释放速度是否过快,释放过快会导致币价被严重稀释,代币被抛售的可能性加大,不利于币价的持续发展。
用MC/FDV比率确认资产是否适合长期持有
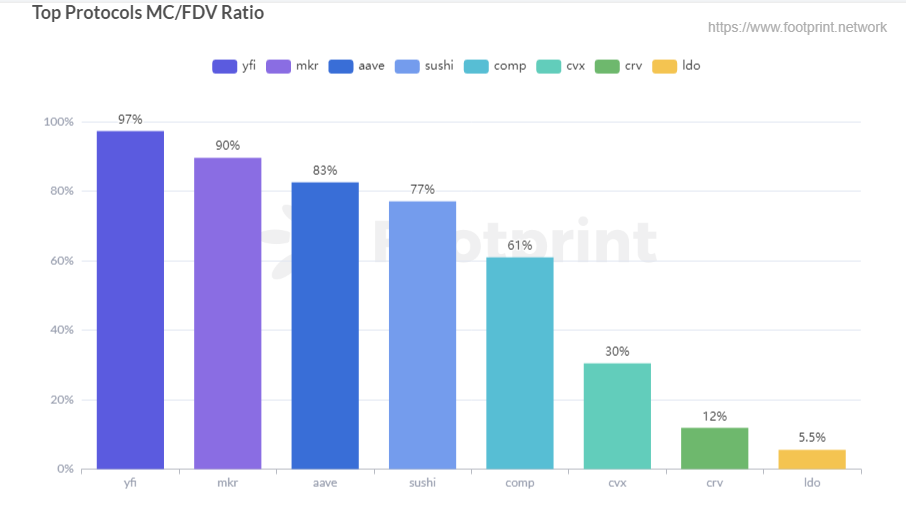
头部平台市值 /完全稀释估值比率,数据来源:Footprint Analytics
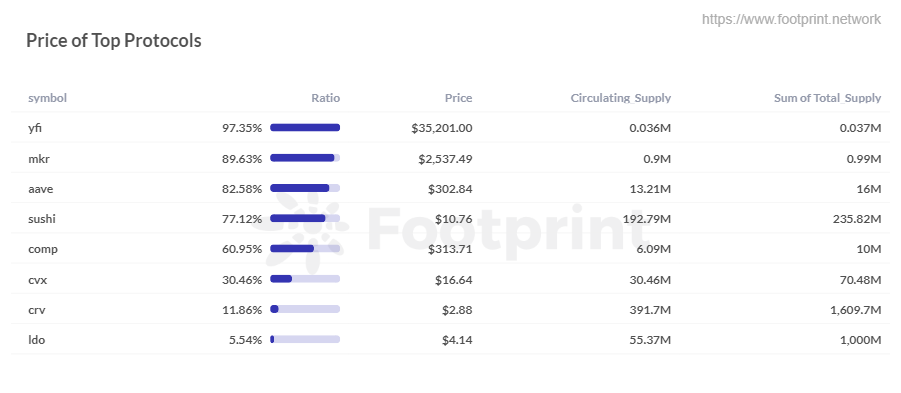
头部平台市值/完全稀释估值比率、价格、代币流通量、代币总供应量对比,数据来源:Footprint Analytics
完全稀释估值指币价与代币最大供应量的乘积,当所有代币释放完毕,市值与完全稀释估值则相等。若项目代币的“MC/FDV”之比(即市值与完全稀释估值比率)过小,意味着有大量代币还未释放,此时投资者则需慎重考虑,重点关注项目的上线时长、代币供应时间表以及币价增长是否过热。
对有长期投资需求的个人投资者而言,评估项目“MC/FDV”的比率是有必要的,随着新代币释放并逐渐流入市场,当供给的代币高于实际所需,估值会变得不合理,随着市场的调节,代币价格随之下降,对长期持有者来说将会面临更大的抛售压力,此时所持的项目代币将会变得一文不值。
以排名靠前的项目为例,对“MC/FDV”比率高于60%的平台,该类平台代币较适合长期持有,安全性有保障,但弊端在于入手价格高;相较比率偏低的平台,如Curve(CRV),虽比率不高,但币价在较为合理的范围,是一个可考虑的平台;相较来说Lido的“MC/FDV”比率低于Curve6.32%,但代币价格高于Curve43.75%,市值估值偏高,目前不适合长期持有,随着市场的自我调整,币价可能会下降。
用MC/TVL比率评估项目是否值得投资
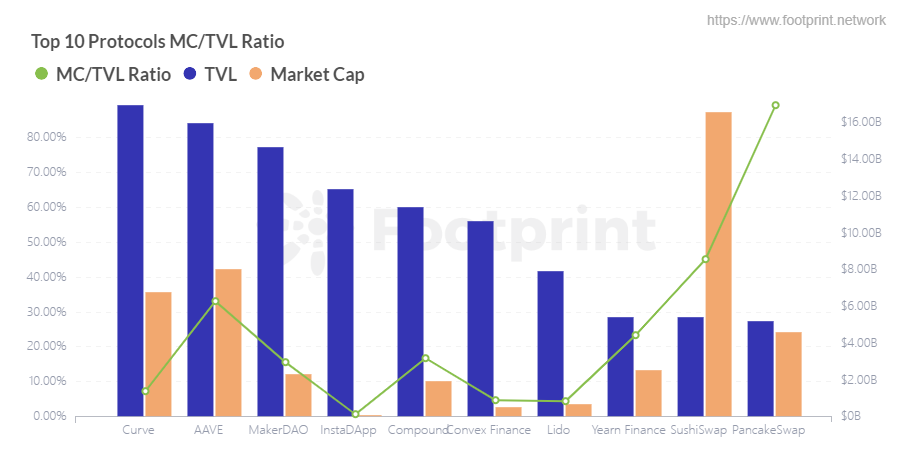
前10大头部平台市值/锁仓量比率,数据来源:Footprint Analytics
据Footprint提供的数据,当前TVL前十的项目“MC/TVL”比率(即市值与锁仓量之比)基本小于1,这代表项目估值处于低估状态,是值得投资的,特别是InstaDapp比率只有0.65%。从经济维度出发,项目的TVL越高,意味着MC也应该越高,因为高TVL表名项目被看好,能为项目带来经济效用更大,市值也应随之提高,达到与TVL相同的体量。
因此在寻找可投资项目时,投资者可以从“MC/TVL”之比的角度出发评估项目的可投资性,比率大于1表明估值可能过高,可投资性偏低,若小于1表明项目被低估,从中获得的回报增加。除此以外,还可将确定投资的项目与头部同类别平台的比率进行对比,看比率与头部平台的差异在何处。
总结
读者可使用本文的评估指标,对所投资项目进行评估,汇总如下:
● TVL排名位于中段以及以上位置,约2,000万美金以上
● 代币价格相较稳定:月度涨幅或者跌幅不宜超过20%
● 代币分发机制合理:团队持币情况以及代币释放速度是否合理
● 用MC/FDV比率小于5%,项目代币不适合长期持有
● 用MC/TVL比率小于1,项目适合投资
关于上述涉及计算的指标,读者可直接在Footprint Dashboard获取(点击链接),无需额外计算。
通过上述指标进行一番分析后会发现,DeFi作为新型的投资市场,由于“新“与容纳性,创造出相较传统金融更多的投资可能性,样式也越发丰富,有许多值得投资的项目被人知悉与了解,也有许多有潜力的项目还未被发掘。
但机遇与风险是并存的,我们不能仅依赖上述的指标就能对项目是否值得投资、是否具有发展潜力做定论,因为DeFi市场变幻莫测、更新换代的速度太快了,指标也会有失灵的时候,为减少踩坑的可能,在投资前还是需要对项目背景、项目经营模式等多做一些搜索与了解,切勿盲目跟风。
Footprint Analytics官网:https://www.footprint.network/
Discord社群:https://discord.gg/3HYaR6USM7
微信公众号:Footprint区块链分析 (FootprintDeFi)
关于Footprint Analytics:
Footprint Analytics是一个一站式可视化区块链数据分析平台。Footprint协助解决了链上数据清理整合的问题,让用户免费享受0门槛的区块链数据分析体验。提供千余种制表模板和拖拽式的作图体验,任何人都可以在10秒内建立自己的个性化数据图表,轻松洞察链上数据,了解数据背后的故事。


