






MEXC Alpha Trader Research Weekly | Bitcoin Loses $75,000: How Do Rate Hike Expectations and Institutional Tailwinds Pull the Market?


- Core View: In the fourth week of May 2026, the crypto market trended downwards amid the conflicting forces of macro tightening and regulatory tailwinds. The Fed's hawkish minutes elevated rate hike expectations, pushing Bitcoin below $75,000 to lows not seen since February. Meanwhile, the CLARITY Act has been scheduled for a Senate vote, providing long-term institutional support for the market, though this is currently overshadowed by the macro liquidity squeeze.
- Key Elements:
- The Fed's May FOMC minutes explicitly discussed "rate hike options" for the first time. The 30-year Treasury yield rose above 5.10%, with CME's implied probability of a December rate hike reaching 35%, resetting market interest rate expectations.
- Bitcoin broke below $75,000 on May 23, hitting a low of $74,200—its lowest since February. Ethereum lost the $2,000 mark, and the market Fear & Greed Index remains in the Fear zone at 28.
- Bitcoin spot ETFs saw net outflows of approximately $420 million this week, though the outflow pace is gradually narrowing. BlackRock's IBIT experienced a rare day of zero net inflow on May 22, reflecting strong institutional caution.
- The CLARITY Act has been placed on the Senate's full voting calendar, with market expectations for a passage in early June. The bill aims to clarify token classification and regulatory boundaries, seen as a major institutional positive, though its short-term effect in offsetting macro headwinds is limited.
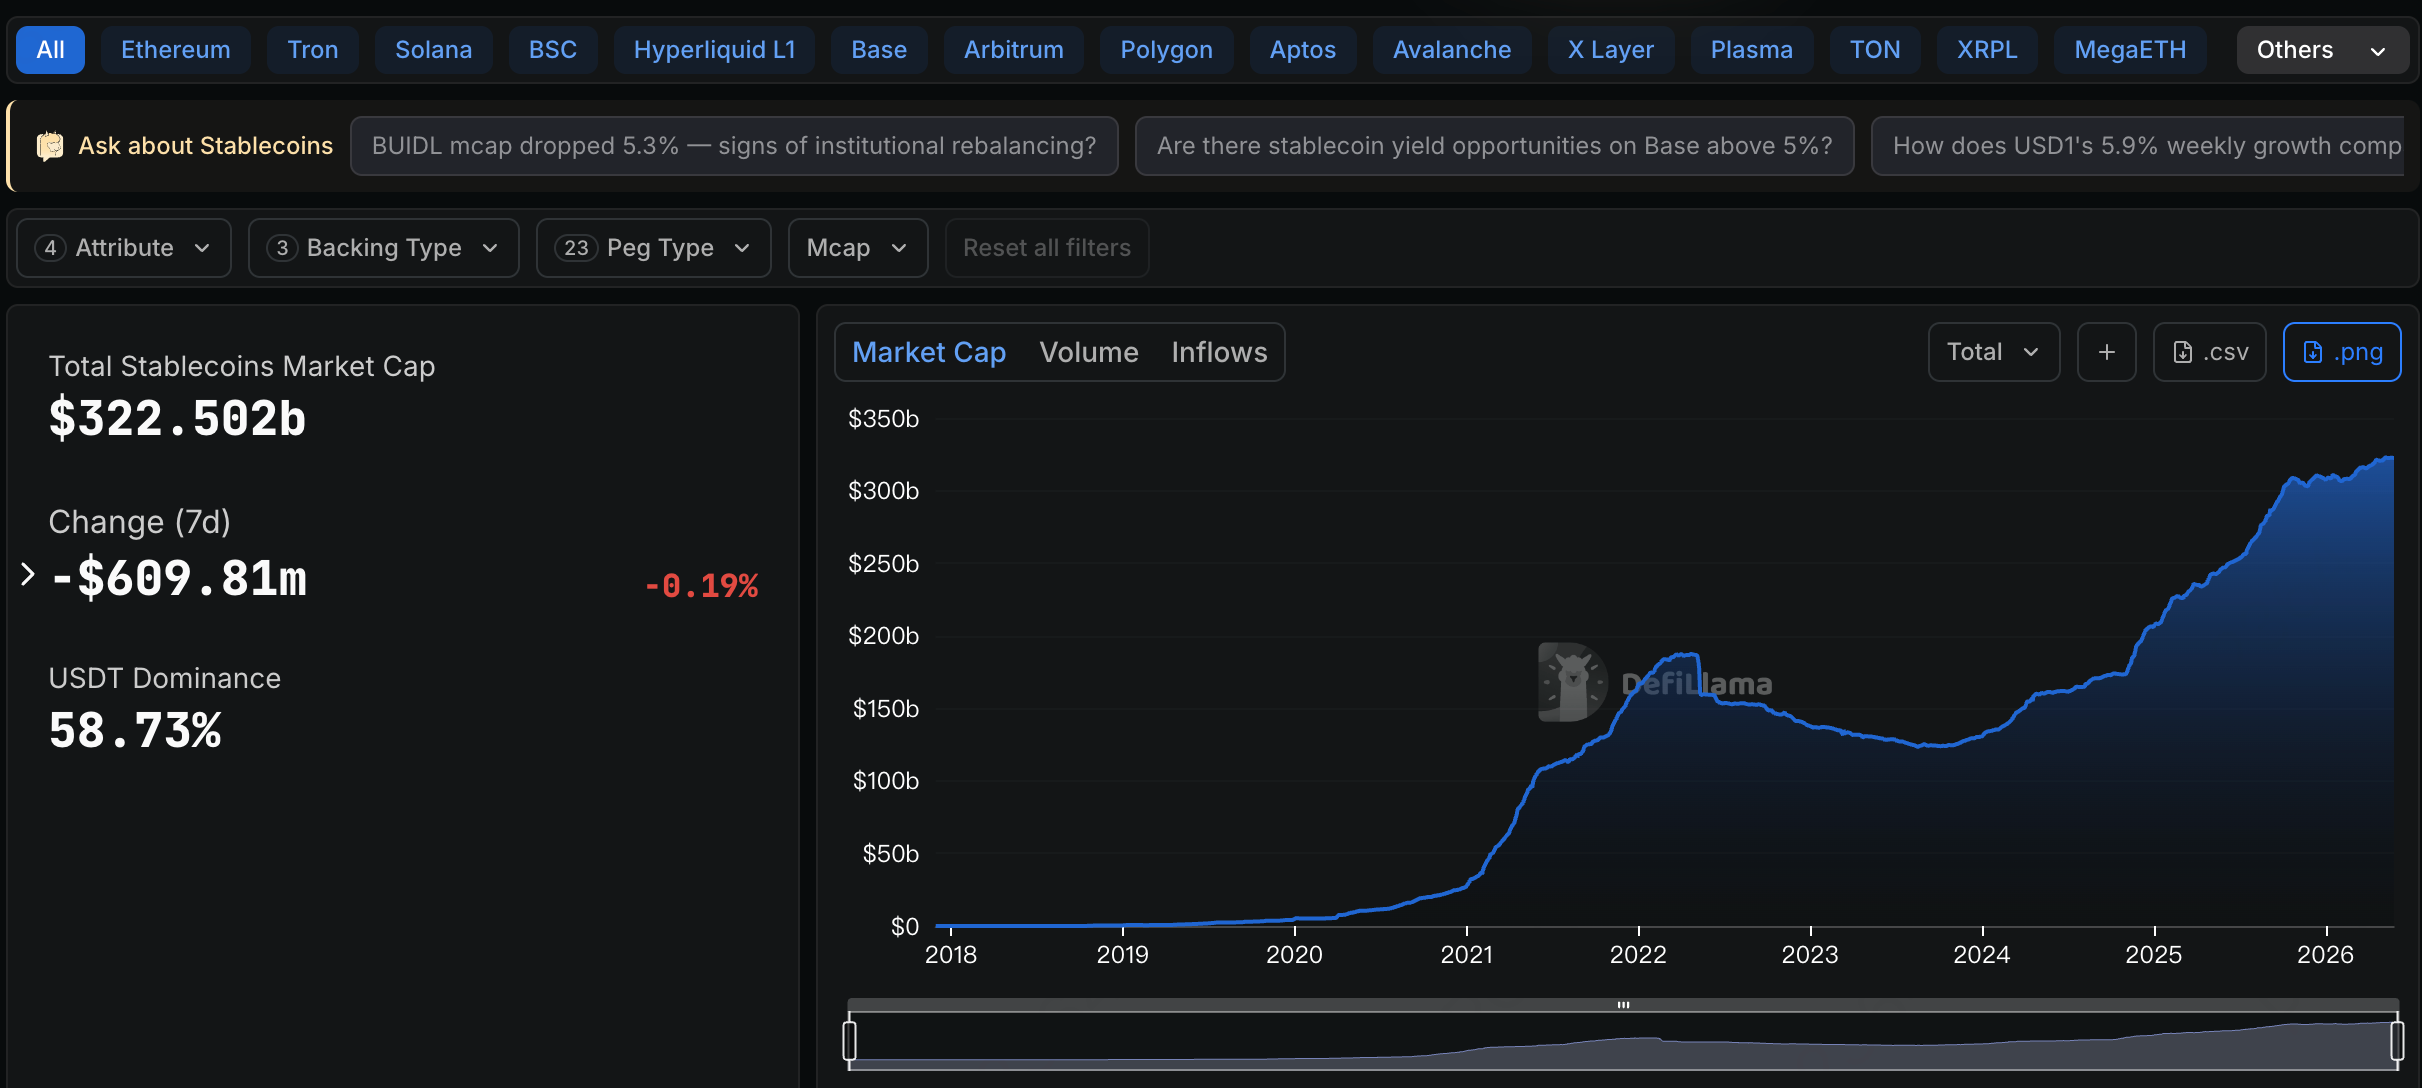
- The total stablecoin market cap surpassed $322.5 billion, with USDC continuing its expansion to $80.5 billion, raising its market share to 24.8%, reflecting institutional preference for compliant stablecoins.
- The US and Iran have restarted indirect negotiations, leading to a temporary de-escalation of geopolitical risk premiums. WTI crude oil fell from $107/barrel to $101/barrel, although the stalemate in talks keeps prices elevated.
- Bitcoin's price is approaching the breakeven point for some older mining rigs. A sustained price decline could potentially trigger miner sell-offs, creating a negative feedback loop.
Week 4 of May 2026
Statistics Period: May 20, 2026 – May 26, 2026
Data Cutoff: May 26, 2026
Core Narrative
Over the past week, the interplay between macroeconomics and regulation has intensified. The minutes of the Fed's May FOMC meeting, released on May 21, confirmed the market's worst fears – some members had begun discussing that rate hikes should be reconsidered as an option if inflation remains elevated. The 30-year Treasury yield briefly surpassed 5.10%, and the CME-implied probability of a rate hike in December climbed to 35% mid-week, the highest level since 2026.
Meanwhile, crypto legislation saw key progress. On May 22, Senate Majority Leader Schumer announced that the CLARITY Act would be scheduled for a full floor vote, with the final vote expected in early June. Market expectations for the bill's passage have shifted from "possible" to "certain," but this institutional tailwind remains overshadowed by the macro headwind of tightening liquidity.
Bitcoin continued its downtrend this week. After a brief rebound to $78,500 on May 20, the price declined again following the hawkish tone of the FOMC minutes. On May 23, it broke below the $75,000 mark, hitting a low of $74,200, a new low since February. Ethereum correspondingly lost the psychological $2,000 level, closing at $1,980. As of May 26, Bitcoin is trading at $74,800, with the Crypto Fear & Greed Index remaining at 28 (Fear zone).
A signal of easing geopolitical tensions emerged. On May 20, the US and Iran restarted indirect talks in Oman. Oil prices retreated from highs, with Brent crude falling back below $105 per barrel and WTI crude at $101 per barrel. However, market skepticism persists regarding the sustainability of the negotiation outcomes, and oil prices remain significantly above levels seen at the start of the year.
In US equities, Nvidia's quarterly report on May 22 offered a mixed picture – revenue slightly exceeded expectations, but guidance for the next quarter fell short of the most optimistic forecasts, causing volatile after-hours trading. The tokenized NVDAON also came under pressure. Overall, the market continues to digest the "higher for longer" interest rate new normal.
1. Core Crypto Market Dynamics
1. Institutional Capital: ETF Outflows Slow but Remain Net Negative; BlackRock Sees Rare Day with Zero Inflow
The selling pressure on spot Bitcoin ETFs persisted early in the week but eased in the latter part. According to Farside Investors and Coinglass data, the four trading days from May 20 to May 23 saw total net outflows of approximately $420 million, including $180 million on May 20 and $150 million on May 21. Outflows narrowed to $60 million and $30 million on May 22 and 23, respectively. On May 24, the market recorded a slight net inflow of about $20 million, the first positive daily inflow since May 13.
BlackRock's IBIT recorded a rare day of zero net inflow on May 22 since its launch, indicating that even the most steadfast institutional buyers are adopting a wait-and-see approach amid macro uncertainty. Grayscale GBTC continued to see outflows, but the outflow rate has decreased from a peak of $200 million per day to around $50 million.
As of May 26, the total cumulative net inflow for Bitcoin ETFs remained at approximately $58.5 billion, slightly lower than last week. Ethereum ETFs continued their net outflow trend, with total outflows of about $120 million this week.
In the derivatives market, total liquidations for the week reached approximately $650 million, with long liquidations accounting for about 75%. On May 23, when Bitcoin fell below $75,000, liquidations totaled $280 million, indicating a reduction in market leverage.
2. Price Performance: Bitcoin Hits New Lows Since February; $75,000 Becomes Key Battle Line
Bitcoin's price action this week can be divided into two phases:
- Phase 1 (May 20-22): Weak rebound, second bottom test. After the sharp decline the previous week, Bitcoin attempted to rebound to $78,500 on May 20, but volumes were notably insufficient. Following the hawkish tone in the FOMC minutes on May 21, the price quickly gave back gains. On May 22, it further declined to around $76,000, putting the $75,000 level in jeopardy.
- Phase 2 (May 23-26): Breaking below $75,000, testing support at $74,000. During the Asian session on May 23, Bitcoin officially broke below $75,000, hitting a low of $74,200. It subsequently traded in a range of $74,500-$75,500 over the next two days. The $75,000 level has transitioned from psychological support to short-term resistance.
Ethereum underperformed Bitcoin, with the ETH/BTC ratio falling to around 0.026, its lowest since 2024. Solana fell below $85, and XRP retreated to under $1.30.
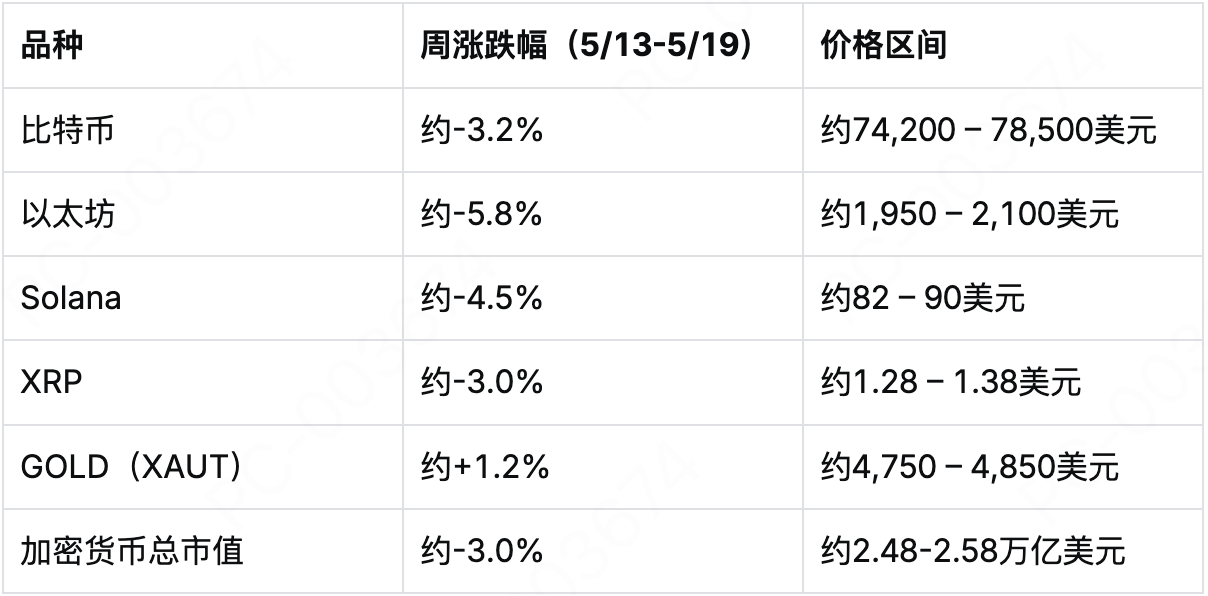
Data Source: CoinGecko, MEXC
Technically, Bitcoin's daily RSI is near 35, not yet in oversold territory (below 30), implying further downside potential. If a break below $75,000 is confirmed, the next support zone lies in the $72,000-$73,000 area (a low tested multiple times since January). On Polymarket, the probability of Bitcoin falling below $70,000 by the end of May has risen to 22%, while the probability of falling below $75,000 is 89%.
3. Stablecoins: Total Market Cap Surpasses $322.5 Billion; USDC Continues to Expand
The total market capitalization of stablecoins surpassed $322.5 billion this week. USDT's market cap is approximately $190.5 billion, with its market share slightly declining to 58.73%; USDC's market cap broke through $80 billion, reaching around $80.5 billion, increasing its market share to 24.8%. The continuous issuance of USDC reflects institutions' growing preference for compliant stablecoins, especially against the backdrop of the upcoming CLARITY Act vote.
On May 23, Circle minted another 200 million USDC on the Ethereum mainnet, bringing the total issuance for the week to 350 million USDC. The yield-bearing stablecoin sUSDS saw its total value locked (TVL) surpass $12 billion, becoming one of the fastest-growing assets in the DeFi space.
2. Global Asset Performance
1. Equity Markets: FOMC Minutes Weigh on Risk Appetite; Nasdaq Turns Negative for the Week
The Fed's May FOMC meeting minutes were released on May 21. The minutes stated: "Some participants noted that if inflation does not fall as expected, the Committee might need to consider further tightening policy." This is the first time in 2026 that official minutes explicitly mention "rate hikes" as a potential option.
Following the release, US stock indices fell across the board. As of the close on May 23, the S&P 500 was down 1.5% for the week, and the Nasdaq Composite was down 2.2%, snapping a two-week winning streak. The semiconductor sector led the decline, with the Philadelphia Semiconductor Index falling 3.5% for the week.
Nvidia reported earnings after the close on May 22: Revenue was $38.2 billion, up 68% year-over-year, slightly above the expected $38 billion; however, Q2 revenue guidance of $39-$40 billion fell short of the most optimistic $42 billion consensus. The stock fell 3% in after-hours trading, and the tokenized NVDAON also weakened. Home Depot (HD) reported same-store sales on May 20 that missed expectations, reflecting weakness in US housing-related consumption in the high-interest-rate environment.
2. Commodities: Oil Retreats from Highs; Gold Falls Then Rises
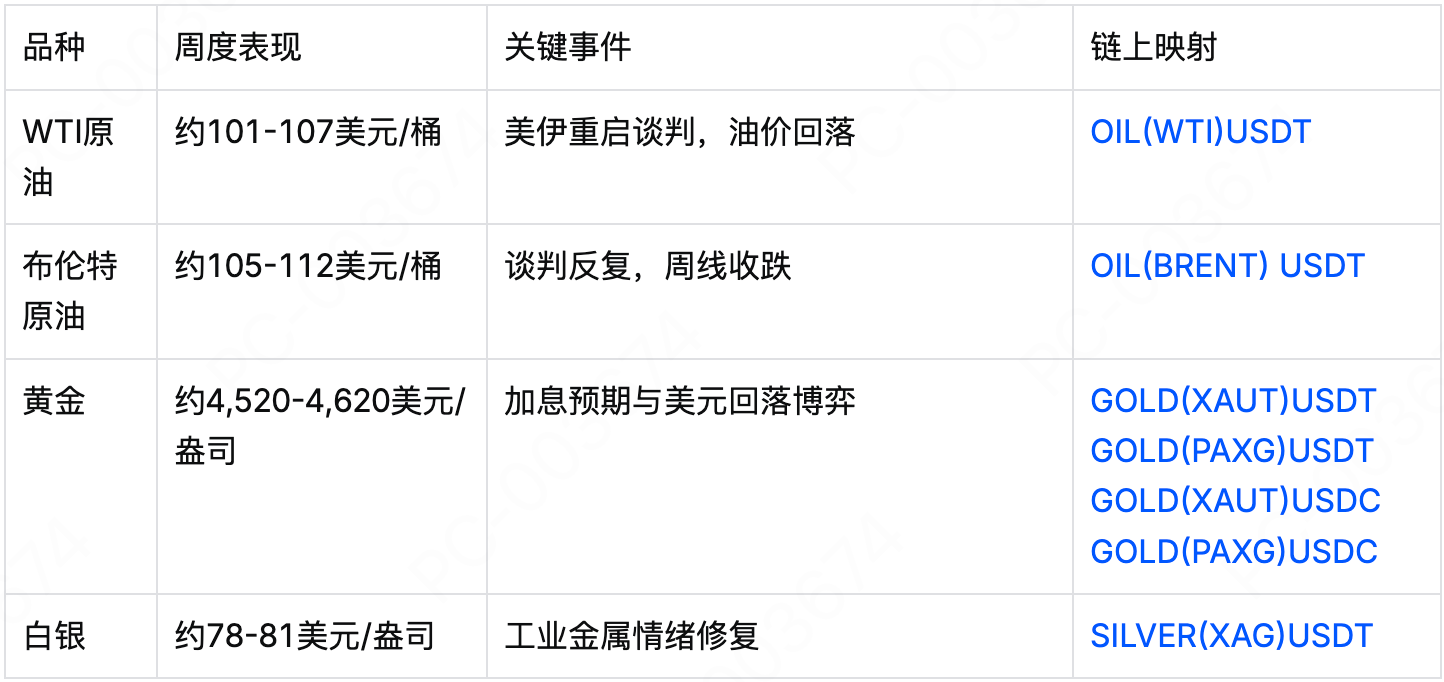
Oil: The news of renewed US-Iran indirect talks on May 20 alleviated concerns about supply disruptions. WTI crude fell from $107 per barrel at the start of the week to $101 per barrel on May 23, while Brent crude dropped from $112 to $105 per barrel. However, on May 25, reports emerged that the talks had not made a breakthrough, causing oil prices to rebound slightly to $103 per barrel for WTI. Overall, prices closed the week down about 4%.
Gold: Rising rate hike expectations initially weighed on gold prices. On May 21, COMEX gold futures fell to $4,520 per ounce. However, as the US Dollar Index retreated from highs (from 105.8 to 105.2), gold rebounded after May 23. As of May 26, COMEX gold was trading around $4,600 per ounce, up a slight 0.5% for the week. Silver performed strongly, with COMEX silver at $79.5 per ounce, up 1.8% for the week.
3. Bond Market: 30-Year Yield Holds Above 5%; Rate Hike Pricing Shifts Higher
The 30-year US Treasury yield briefly touched 5.12% this week before closing at 5.08%, firmly above the 5% threshold. The 2-year yield rose to 4.45%, and the 10-year yield increased to 4.62%. The yield curve inversion deepened, reflecting a combination of concerns about the economic outlook and persistent inflation expectations.
The CME FedWatch Tool shows that as of May 26, the probability of a 25 basis point rate hike in December 2026 stands at 35%, and the probability of a 50 basis point hike is 8%. A month ago, these figures were 2% and 0%, respectively. The market has fully priced in no rate cuts before September


