
60-Day Conflict Review: Has Global Capital Markets' Pricing of 'War' Really Changed?
- Core Viewpoint: During the 60-day 2026 US-Israel-Iran conflict, the old capital market formula of "buy gold during war" failed. The market's core pricing focus shifted to the transmission chain of war's impact on energy supply, inflation, interest rates, and the US dollar. US energy assets performed the best.
- Key Factors:
- The conflict unfolded in three phases: the hot war shock (gold fell 20%), the ceasefire negotiation phase (NASDAQ recovered), and a stalemate period (energy stocks led). Market trading behavior shifted from simple risk aversion to diversified transmission pricing.
- Gold fell from its January highs early in the conflict, primarily because rising oil prices pushed up inflation and interest rate expectations, leading to higher real interest rates and a stronger US dollar, increasing the opportunity cost of holding gold.
- The NASDAQ ETF initially fell before rebounding. The improvement came after ceasefire expectations emerged. However, inflation pressures remained, so the rebound was a risk appetite recovery rather than a relief from macro pressures.
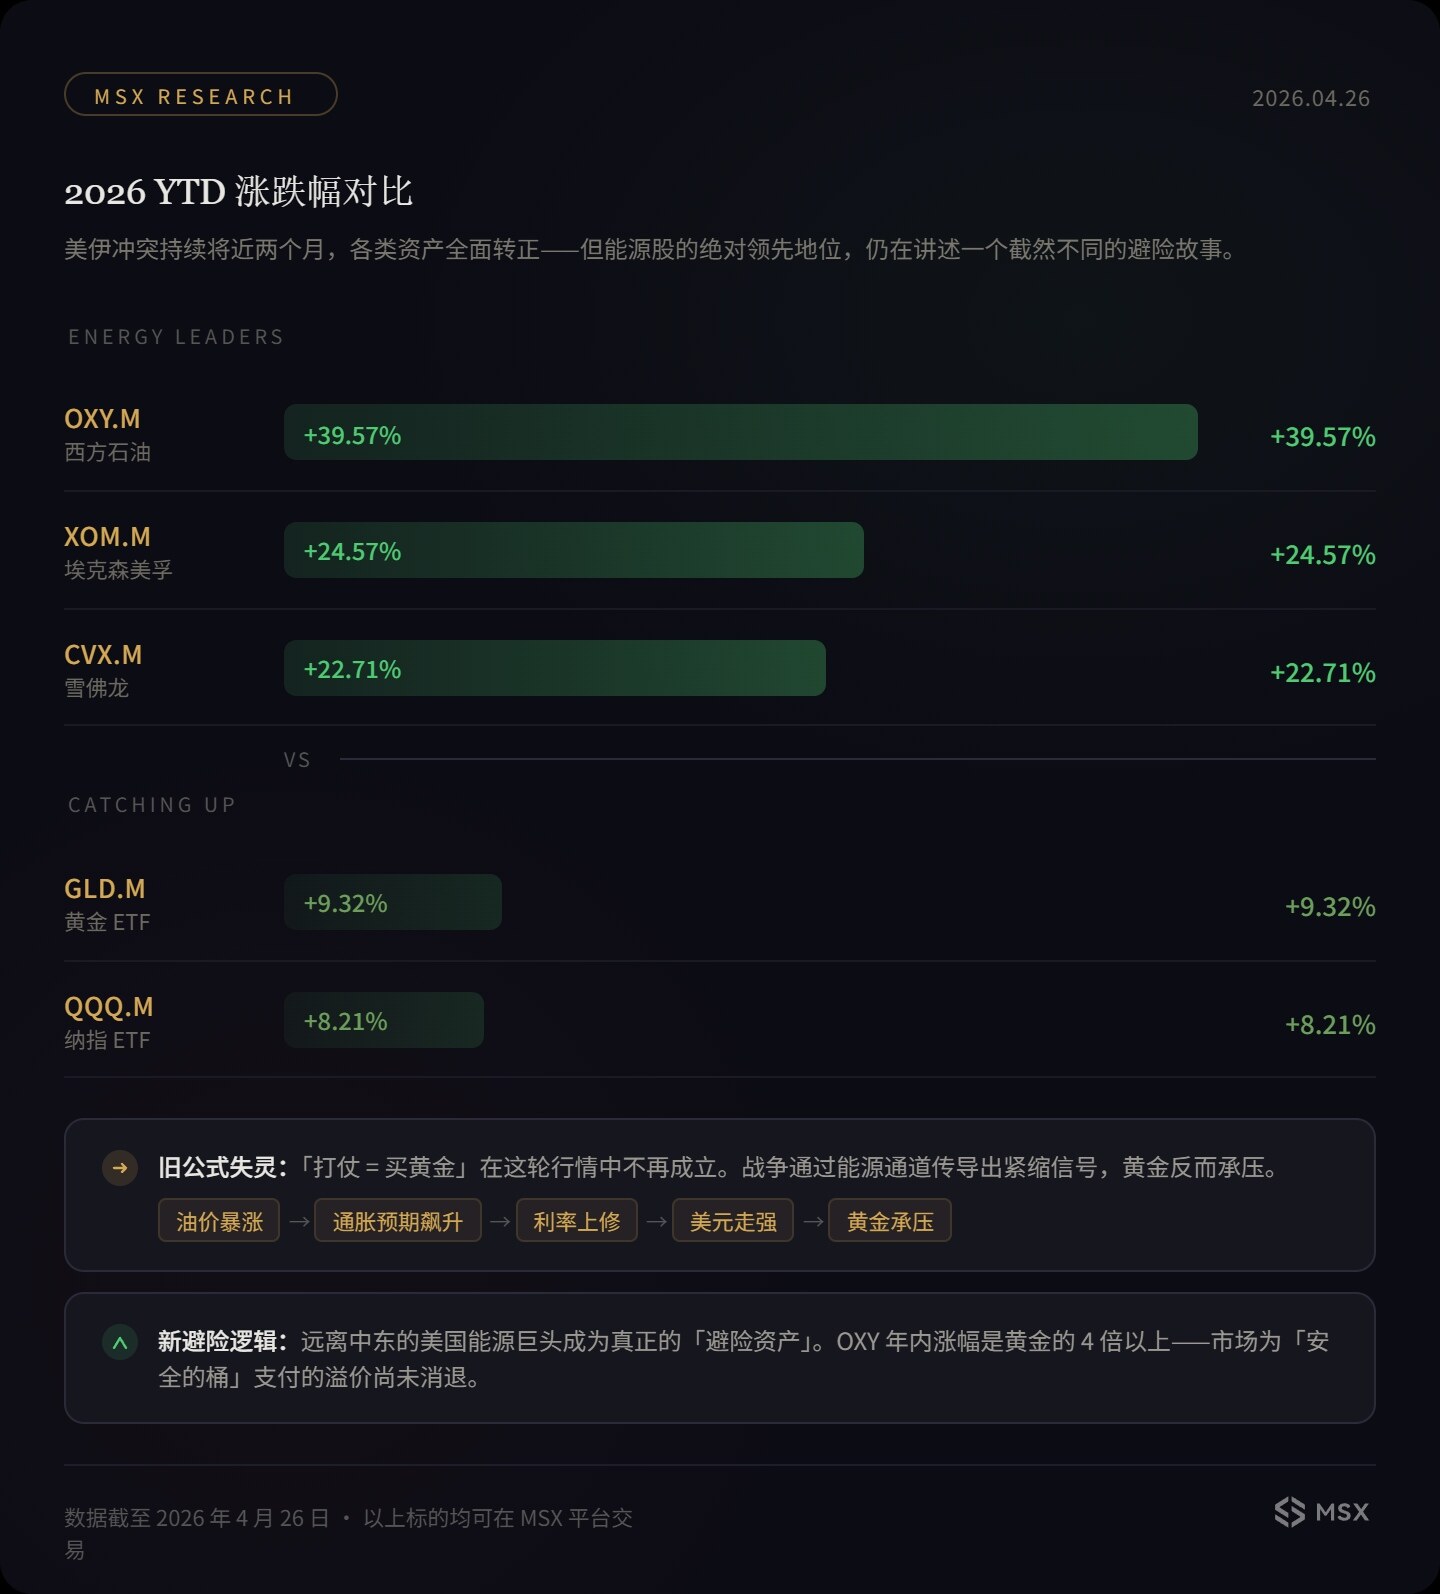
- US energy stocks (e.g., OXY, XOM) performed best. The market logic shifted from "interest-free safe haven" to "buying supply certainty," favoring energy assets with stable cash flows located away from the conflict zone.
- As of April 26, OXY was up about 40% year-to-date, while the NASDAQ ETF and gold ETF returned close to 8-9%, confirming energy stocks as the best performers in this round of conflict.
Original Author: Frank, MSX Maitong
It has been two months since the joint US-Israel strike on Iran.
At the very beginning of February 28th, Iranian Supreme Leader Khamenei was assassinated, and the Strait of Hormuz was suddenly closed. Based on market intuition formed over the past few decades, this was almost a trading formula that required little thought: War breaks out, oil prices rise, risk aversion intensifies, gold surges, tech stocks come under pressure.
But the capital markets of 2026 delivered a much more complex and counter-intuitive report card:
Gold did not continue its upward surge following traditional safe-haven logic; instead, it pulled back significantly from its January highs. The Nasdaq ETF first turned from a positive year-to-date return into negative territory, then quickly recovered on ceasefire expectations. The true outperformer was not gold, nor copper, but US energy assets—located far from the conflict zone, with stable production capacity and cash flow.
More bizarrely, during this period—hot war, ceasefire, blockade of the strait, negotiation deadlocks—the script on the battlefield was rewritten repeatedly, and the script in the capital markets flipped through many pages as well.
Looking back at this 60-day conflict now, it has forced the market to realize that war is a pricing chain that transmits layer by layer through energy supply, inflation expectations, interest rate paths, dollar strength, and asset valuations. Not only has the old formula "war = buy gold" failed, but the global capital market's pricing logic for "war" itself is being completely rewritten.
1. 60 Days, Three Phases
Let's first outline the timeline.
Looking back, this conflict can be roughly divided into three phases:
- Hot War Shock (Feb 28 – Early Apr): After the US-Israel strike on Iran, Iran retaliated with missiles and drones against Israel and US-related targets. Passage through the Strait of Hormuz was obstructed, the global energy market quickly entered a state of tension, leading to a rapid rise in oil prices and a revaluation of energy stocks. Gold, however, plummeted about 20% from its near-$5,600 high in January.
- Ceasefire Bargaining (Early Apr – Apr 21): As regional mediation progressed, expectations emerged for a ceasefire between the US and Iran and the reopening of the Strait. Risk assets began to recover. The Nasdaq ETF QQQ.M rebounded sharply from its lows. During this phase, the market traded on the theme that "the worst-case scenario might not happen." However, the Strait never truly returned to stable operation; incidents like the US blockade, Iran seizing commercial vessels, and the breakdown of negotiations kept recurring.
- Stalemate and Volatility (Apr 22 – Present): Trump announced an extension of the ceasefire, but the US blockade and Iran's seizure of merchant ships occurred simultaneously. The situation remained suspended in a state of "no war, no peace." The market gradually recovered from its panic. The Nasdaq rebounded from -8.4% year-to-date to +8.21%, and oil prices fell from over $110, but the Strait of Hormuz still hasn't truly reopened for normal traffic.
It was precisely during the tug-of-war across these three phases that the market gradually understood it could no longer simply trade on a single variable like "war starts" or "war ends." Instead, the core of pricing lies in *how* war changes energy, inflation, interest rates, and the dollar.
As of April 26th, the performance of several core assets tells the story:
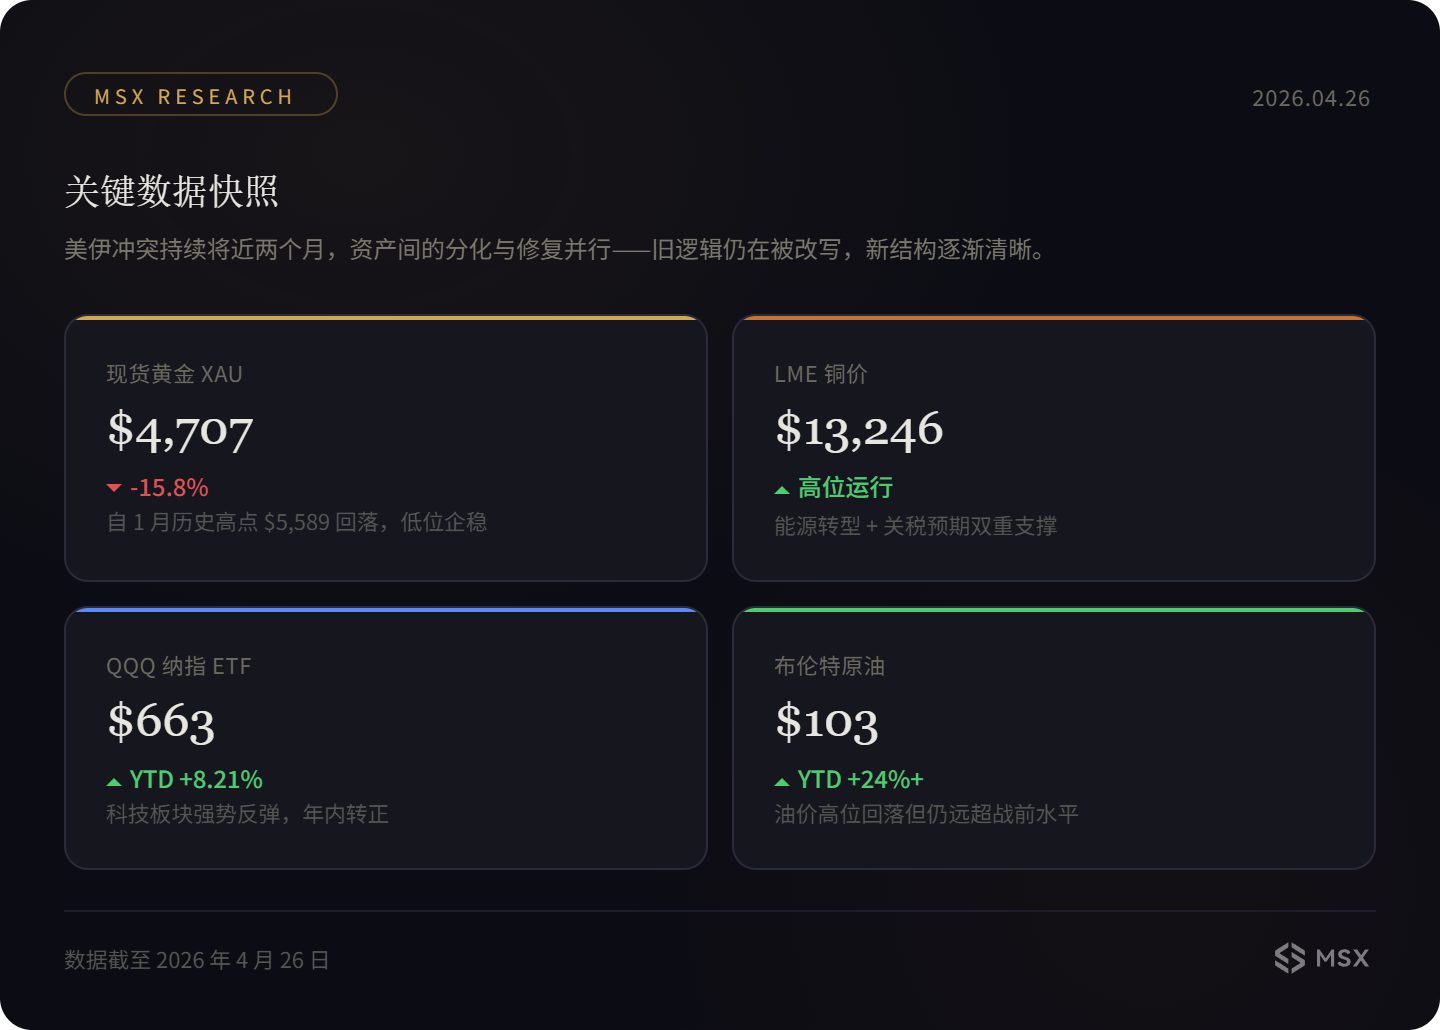
What's more noteworthy is the ranking among assets. 60 days ago, the market showed extreme divergence: Energy stocks surged, gold fell sharply, and the Nasdaq turned negative. Now, most assets have turned positive again (especially QQQ.M), but the ranking hasn't changed—energy stocks remain the strongest asset class in this conflict.
This further illustrates that the market's pricing of this war is not a binary choice between "risk-off vs. risk-on." Instead, it starts with the energy supply shock and transmits along the chain: "Oil prices -> Inflation -> Interest Rates -> Dollar -> Valuations."
2. Why the Old Formula "War = Buy Gold" Failed
Therefore, the key to understanding the "counter-intuitive" nature of this 60-day market movement lies in breaking down the transmission chain.
After all, the most counter-intuitive aspect of this period was gold.
War breaks out, the Strait is blockaded, oil prices surge—gold should be the most direct safe-haven choice. But the reality is that gold did not accelerate its rise in the early stages of the conflict; instead, it significantly retreated from its January highs. Superficially, this looks like "safe-haven failure." However, if we dissect the macroeconomic transmission chain, it becomes clear that gold's performance was actually trading another aspect of war: stronger tightening expectations.
- The first transmission layer comes from oil prices: With the Strait of Hormuz blocked, uncertainty around crude oil and LNG transportation surged dramatically. Rising energy prices quickly shifted from a geopolitical premium to inflationary pressure. For the market, this means the Federal Reserve cannot easily pivot to easing; it may even need to maintain high interest rates for longer.
- The second transmission layer comes from interest rates and the dollar: Higher real interest rates increase the opportunity cost of holding gold. A stronger dollar makes dollar-denominated gold more expensive for non-US buyers. A Reuters report in late April on gold's trend also mentioned that rising oil prices pushed up inflation and interest rate expectations, thereby putting pressure on gold through the dollar and yield channels.
- The third transmission layer is the backlash from the crowded trade itself: Before the war broke out, gold had already experienced an extreme rally, surging from below $3,000 in early 2025 to near its January 2026 highs. When a trade becomes too crowded and a sudden shock arrives, funds may not necessarily add to positions; instead, they might choose to lock in profits first. For some short-to-medium-term capital, war is not a new reason to buy but a window to cash out.
This is precisely why the old formula "war = buy gold" appears too crude in this market. Gold remains a safe-haven asset, but it doesn't price in a vacuum. As long as the war pushes up energy prices, inflation expectations, and real interest rates, gold will face a tug-of-war between safe-haven demand and tightening pressure.
In other words, gold didn't ignore the war; it was merely reacting to the economic consequences of the war.
In contrast, the performance of the Nasdaq ETF was more like a high-volatility stress test. After the war broke out, QQQ.M tumbled from positive year-to-date returns into negative territory. The tech sector experienced significant capital outflows, with high-valuation growth assets yielding to sectors with more certain energy, value, and cash flow.
However, when ceasefire expectations emerged, the Nasdaq quickly recovered, turning its year-to-date return positive again. The logic behind this rebound isn't mysterious: it was largely due to improved ceasefire expectations, oil prices retreating from highs, marginal easing of inflationary pressure, the market re-pricing the possibility of rate cuts, and consequently, growth stock valuations gaining room for recovery.
But the problem is that every link in this chain hasn't been fully confirmed yet. The Strait of Hormuz hasn't resumed stable transit, negotiations remain volatile, oil prices are still in a high range, and the foundation for a Fed pivot is not solid.
Therefore, the Nasdaq ETF's rebound looks more like a "risk appetite repair" than a complete resolution of macroeconomic pressures.
3. Gold Fell, Who Was the Biggest Winner?
The answer: Energy stocks.
In this market, what investors were truly willing to pay a premium for was not an abstract sense of security, but verifiable, deliverable energy supply capacity located far from the conflict zone. Think major US energy companies with stable production, more controllable transportation routes, and more certain cash flows, located away from the Middle East conflict epicenter.
This explains why OXY.M, XOM.M, and CVX.M significantly outperformed gold ETF tokens and Nasdaq ETF tokens. The market's safe-haven logic shifted from the past "buy gold" to a new "buy supply certainty," moving from "sheltering in non-yielding assets" to "holding cash-flow assets that benefit from supply shortages."
This is also one of the most noteworthy changes brought about by the 2026 war. Geopolitical risks certainly haven't disappeared, but the capital market's reaction to them has clearly changed. The old linear reflex of "war breaks out → risk rises → buy gold" is being replaced by a more complex transmission framework: The market no longer just trades the war itself; it dissects how the war will impact energy supply, inflation paths, interest rate expectations, dollar strength, and profit distribution across the industrial chain, ultimately re-pricing the risk-reward ratio of different assets.
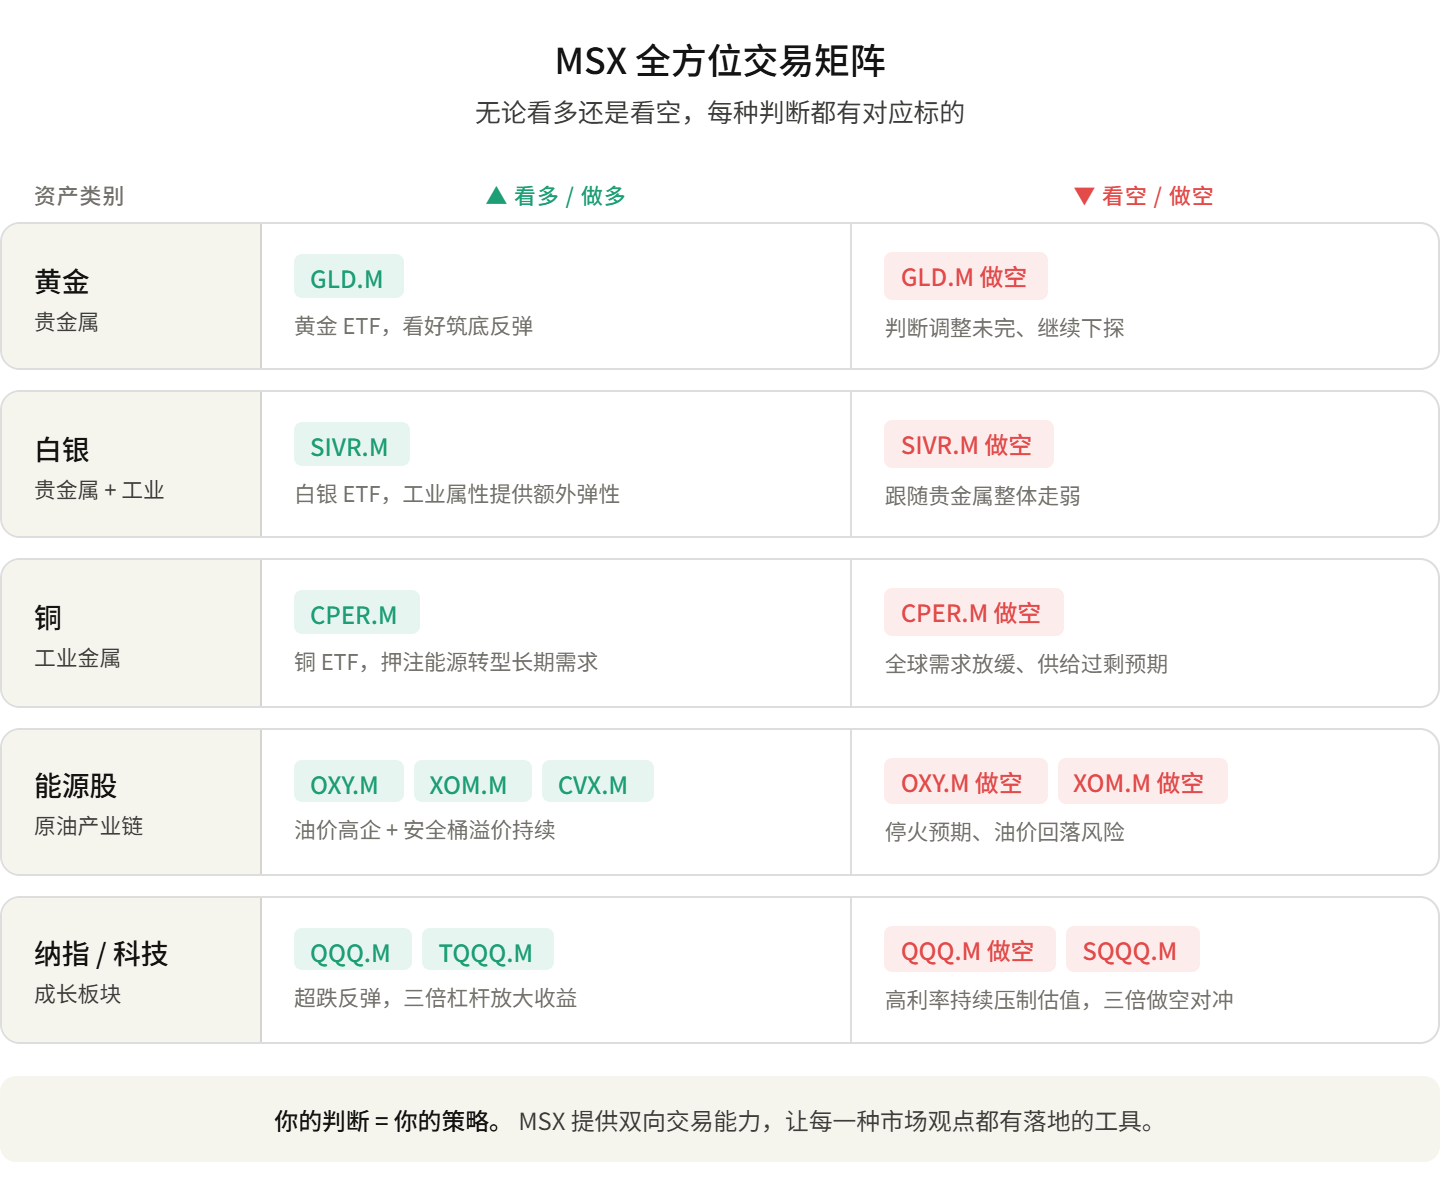
For investors, the key is no longer just judging "will the war escalate." It's about further judging which specific chain this conflict will impact the market through, and which tools to use to express one's views. Choices must be more precise than ever:
- If you judge that the conflict remains stalemated, Strait of Hormuz transit stays uncertain, and oil prices remain high, then energy US stock tokens like OXY.M, XOM.M, and CVX.M might be the more direct expression tools, as they trade on the revaluation of "secure supply" and "energy cash flows."
- If you judge that a ceasefire truly materializes, the Strait gradually resumes traffic, oil price pressure eases, and the market re-prices rate cut expectations, then the previously pressured tech growth assets may continue their recovery. Tokens like the Nasdaq ETF token QQQ.M would be better suited to capture the rebound in risk appetite.
- If you judge that pressure on the dollar and real interest rates begins to ease, the precious metal attributes of gold and silver may regain pricing room. The gold ETF token GLD.M and the silver ETF token SIVR.M could regain flexibility. Silver, in particular, also has strong industrial properties linked to demand from solar energy, electronics, and AI hardware, potentially offering higher upside elasticity than gold.
- If you believe that global manufacturing, the energy transition, grid upgrades, and AI data center expansion remain the dominant longer-term themes, then the copper ETF token CPER.M acts more like a medium-to-long-term structural tool. Although copper prices are volatile in the short term due to the dollar, demand, and inventories, it remains one of the most important metals in the global infrastructure re-pricing process from a longer perspective.
It's worth noting that from a trading structure perspective, for investors looking to participate in commodity markets, ETF tokens offer the advantage of being suitable for phased entry and position management. Compared to directly trading futures or spot contracts, they don't require handling complex issues like delivery, rollovers, or margin management, making them more suitable for expressing short-to-medium-term swing trades or medium-to-long-term allocation ideas.
For the Nasdaq ETF token, market divergence is equally clear.
If an investor judges that oil prices will stay stubbornly high, inflation sticky, and the interest rate environment will continue to suppress growth stock valuations, then shorting QQQ.M, or hedging via the triple-short Nasdaq ETF token SQQQ.M, might be a more direct risk management approach.
If an investor judges that subsequent data like non-farm payrolls or inflation will weaken, leading the Fed to re-release dovish signals and allowing the tech sector to continue its oversold bounce, then going long QQQ.M, or using the triple-long Nasdaq ETF token TQQQ.M to express expectations of a higher-volatility recovery, is also a viable path.
So, the key point here is not to provide a single "correct" direction.
The market never automatically trends towards one particular asset just because of the word "war." What truly matters is whether an investor can break down their macro judgment into tradable asset paths. For example, is it trading energy supply, or betting on falling rates? Is it betting on precious metals recovery, or tech stock rallies? Is it going long on the certain cash flows within volatility, or hedging the downside risk of high-valuation assets?
After all, in this new market environment, determining the direction is only the first step. More importantly, once you form a judgment, can you use sufficiently efficient, flexible, and low-barrier tools to convert that judgment into an executable trading strategy?
Final Thoughts
60 days ago, if someone had told you:
- The US and Israel would strike Iran, the Supreme Leader would be assassinated, the Strait of Hormuz would close, but gold would fall 16%;
- Tech stocks would first fall 8%, then recover 8%, tracing a V-shape over two months;
- Few dared to heavily weight energy at the start of the year, but OXY would rally nearly 40%;
- The YTD returns for the Nasdaq and gold would be nearly identical (+8.21% vs +9.32%), and OXY's return would be 4 times that;
You probably wouldn't have believed it.
But this is the market of 2026. Old logic hasn't completely failed, but it's no longer sufficient. Through this 60-day conflict, the market has learned not to react with a simple conditioned reflex to the keyword 'war.' Instead, it dissects the war's economic transmission pathways, assesses the credibility of ceasefires, and dynamically prices stalemates.
What we can do is not predict the next answer, but ensure that when the answer appears, we have the right tools in hand.
In the global investment market under Trump, any possibility is real. And what we can do is not predict the next answer, but ensure that as the answers gradually emerge, we have sufficiently appropriate tools in hand.
The ability to efficiently translate *judgment* into *trading*—that is the real dividing line.


