






Behind Bitcoin's Rebound: Weak Spot Demand and Derivatives Receding, Bearish Structure Remains Unbroken


- Core View: The Bitcoin market shows signs of stabilization after its recent rebound. However, weak spot demand, shrinking derivatives activity, and cautious sentiment in the options market indicate a lack of strong overall confidence, and the market has not yet entered a sustainable recovery phase.
- Key Factors:
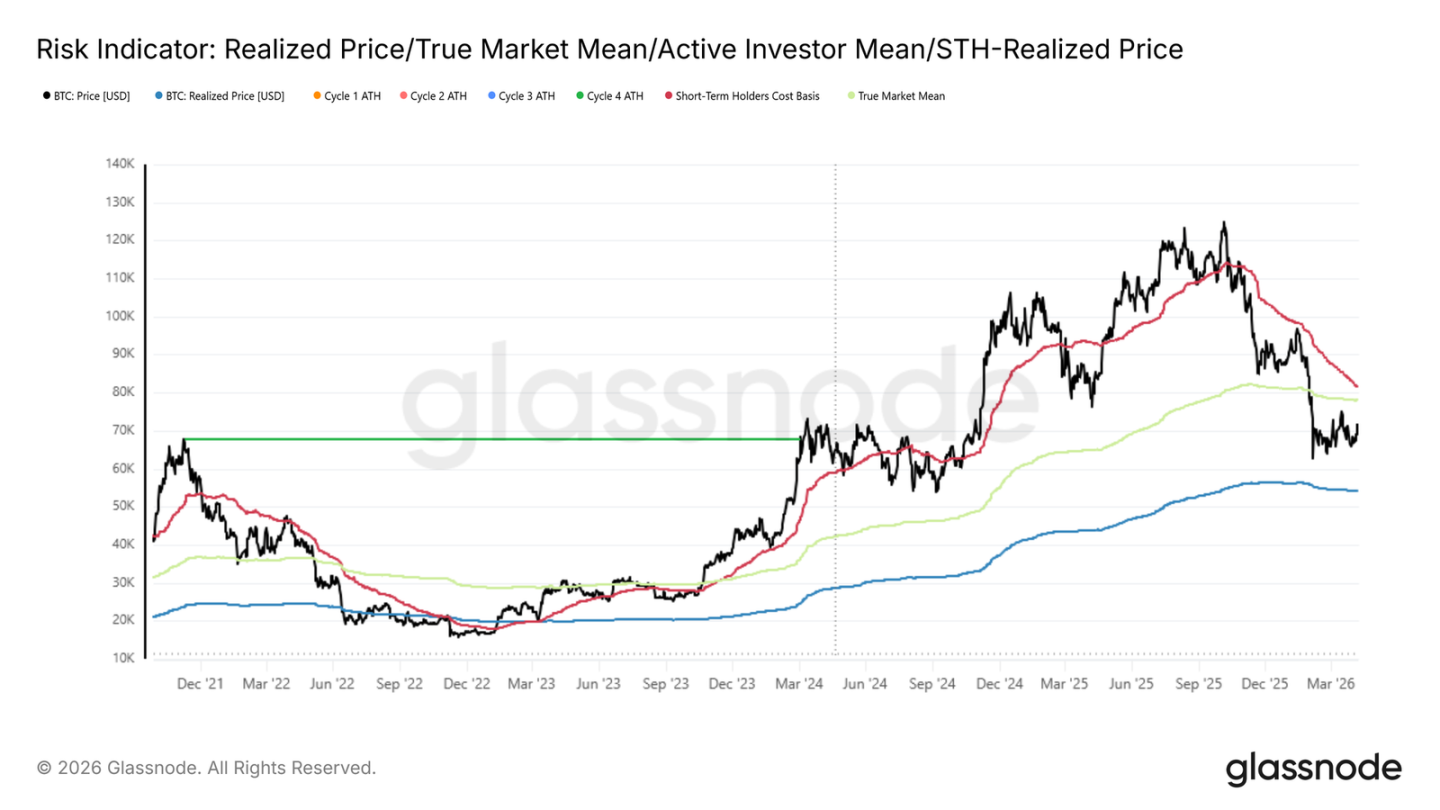
- On-chain analysis reveals that Bitcoin's spot price remains below the short-term holder cost baseline ($81,600) and the realized price ($78,000), placing it within a bearish value range. The rebound may face selling pressure from recent buyers.
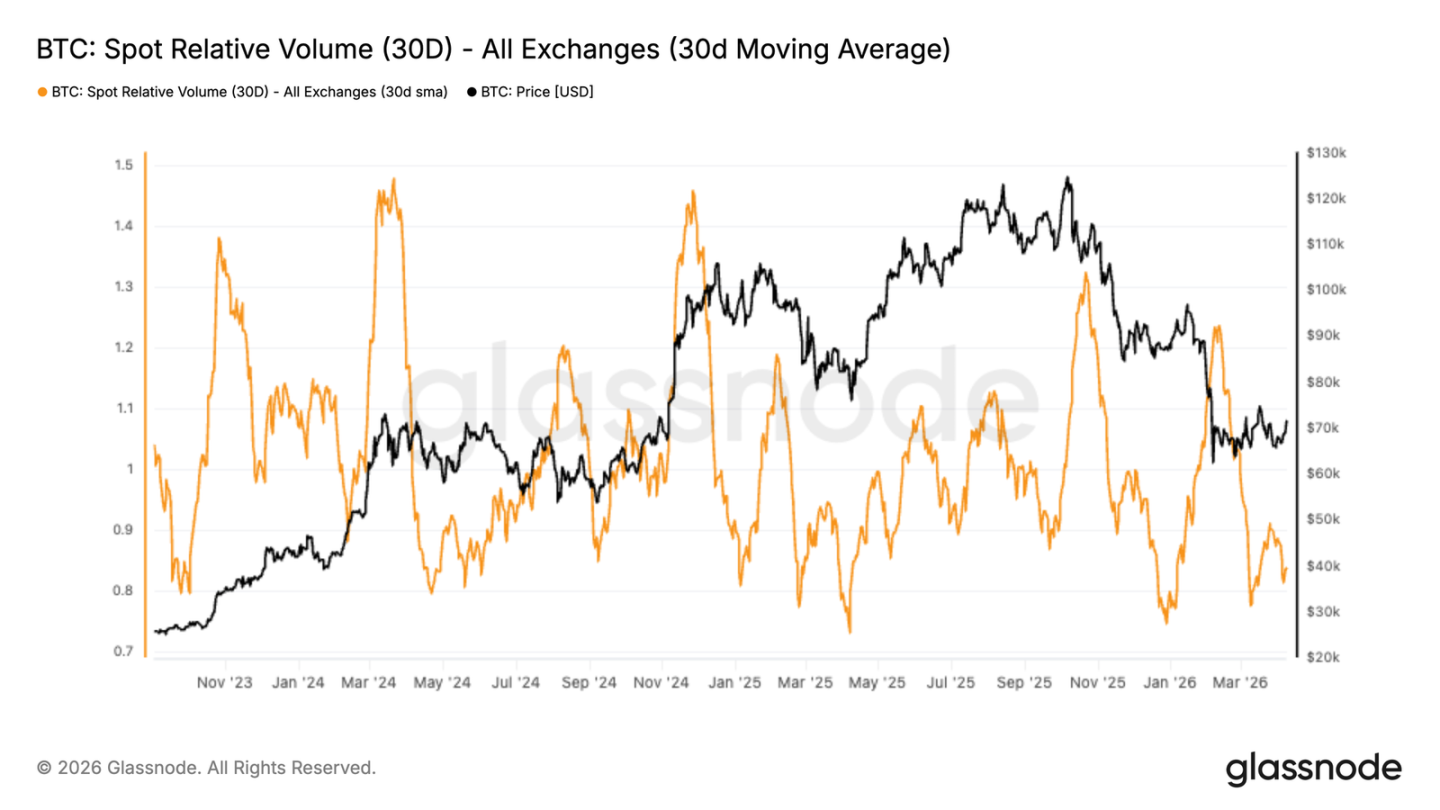
- The spot market remains persistently weak, with Binance's 30-day relative trading volume below the baseline, indicating a lack of strong organic demand supporting price stabilization.
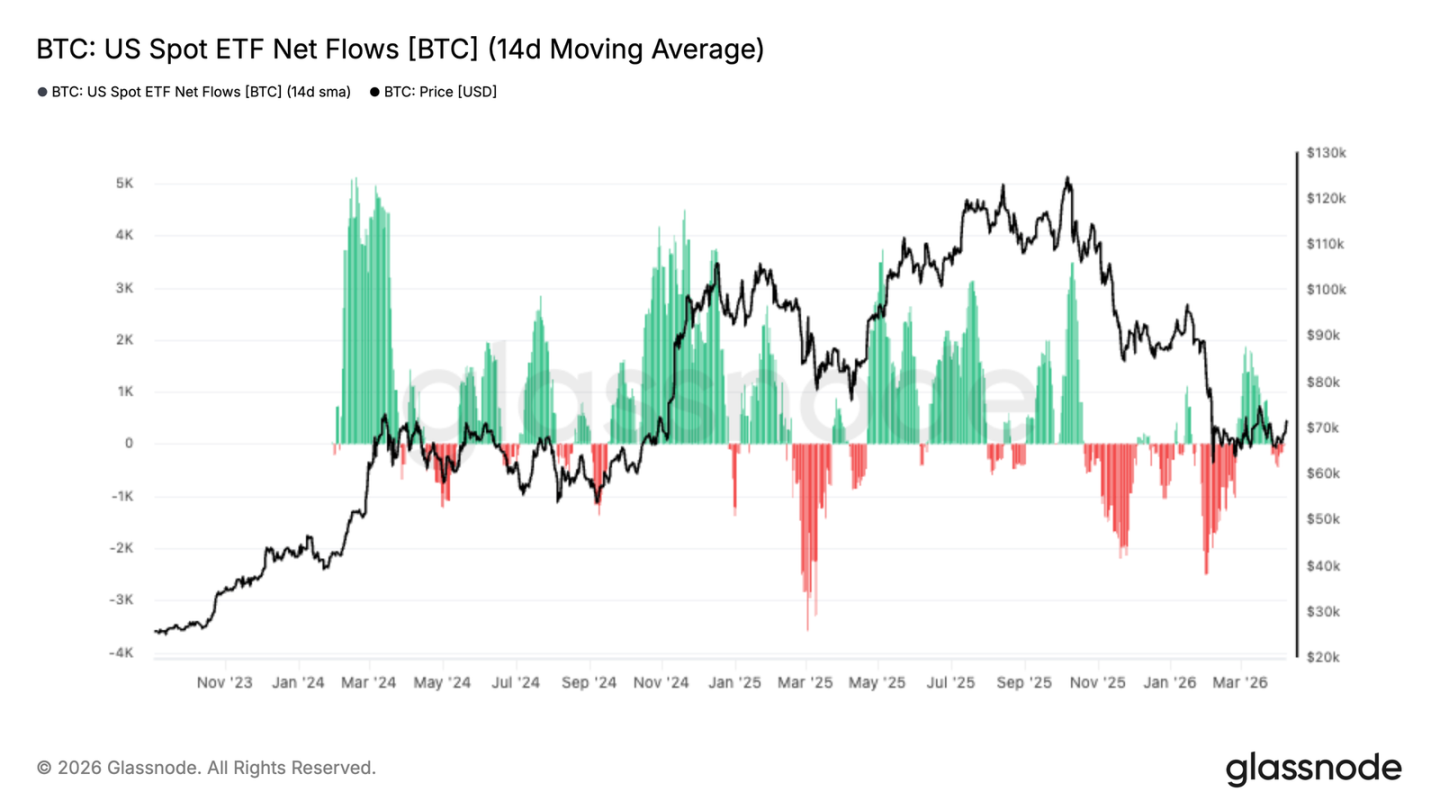
- U.S. spot ETF flows have shifted from prolonged net outflows to slight net inflows, showing initial signs of returning institutional demand, though the magnitude remains small.
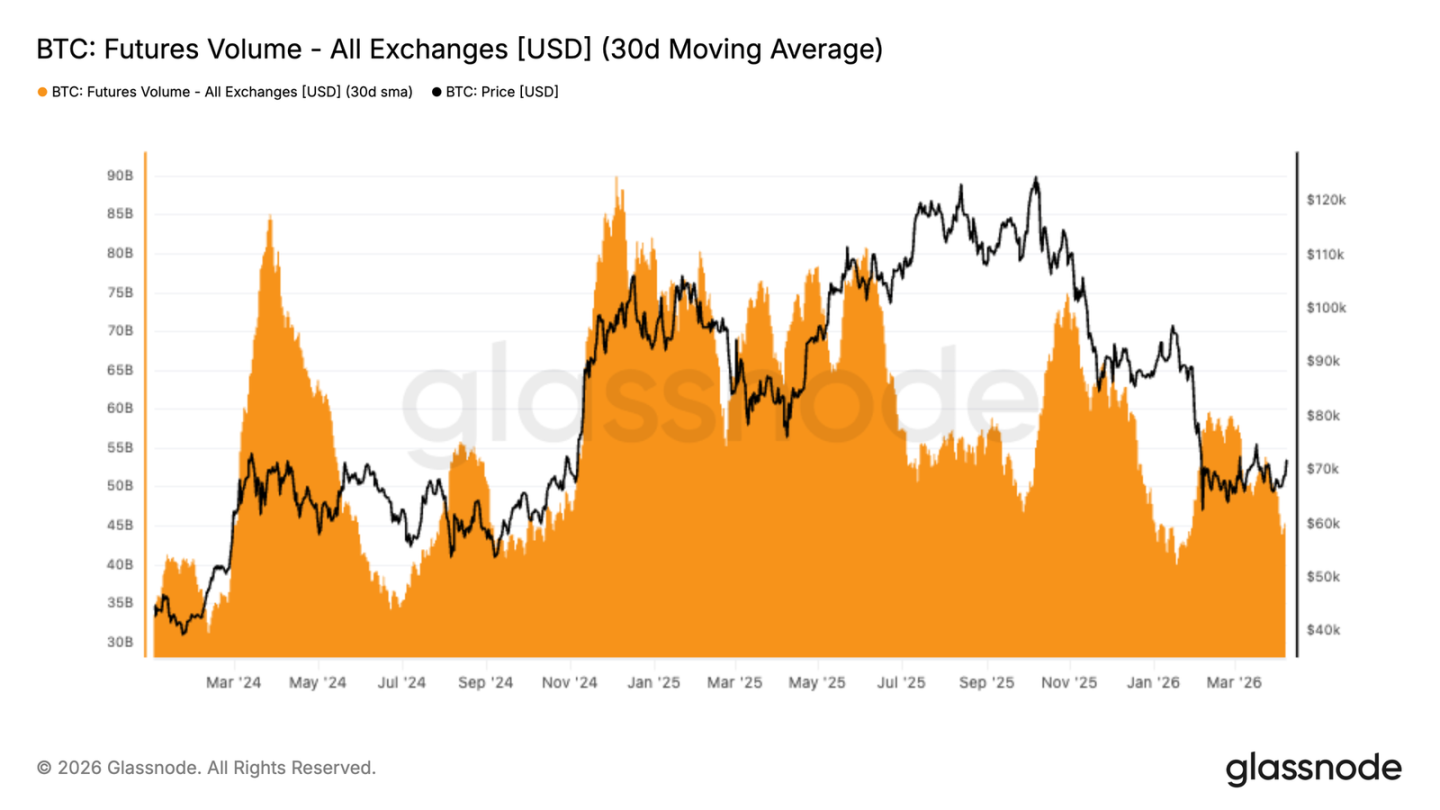
- Significant declines in futures trading volume and open interest indicate that traders are still on the sidelines after deleveraging, rather than actively re-entering the market.
- Implied volatility across the options market has declined comprehensively, but the skew still favors put options. This reflects that while the market is reducing volatility exposure, it still prioritizes downside protection, indicating overall cautious sentiment.
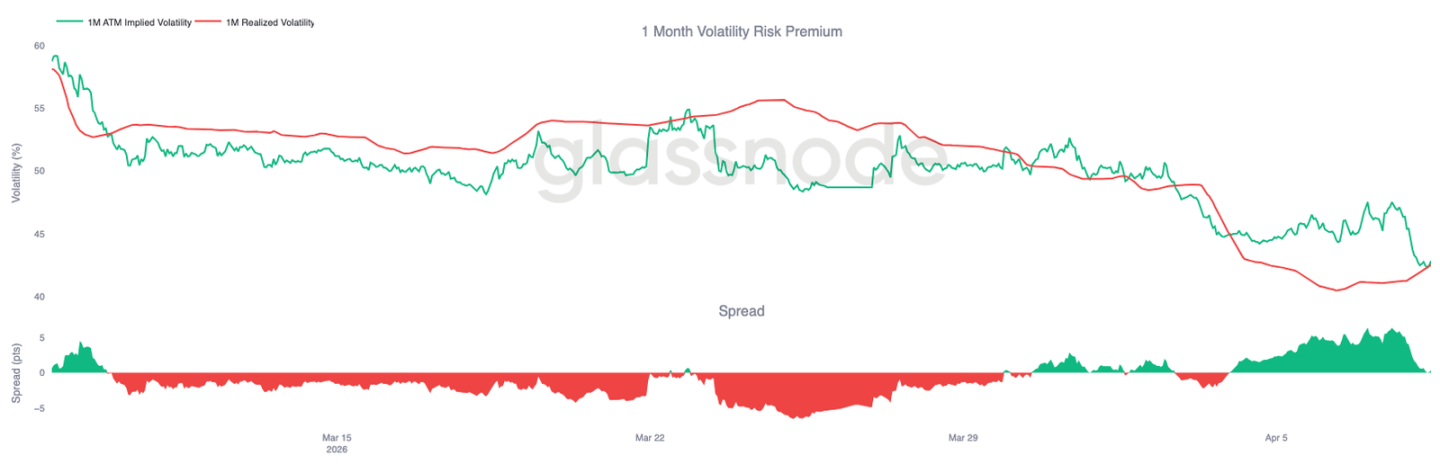
- Market volatility (realized volatility) continues to decline alongside shrinking trading volume, showing the market is calming down but with thin liquidity, making prices sensitive to incremental fund flows.
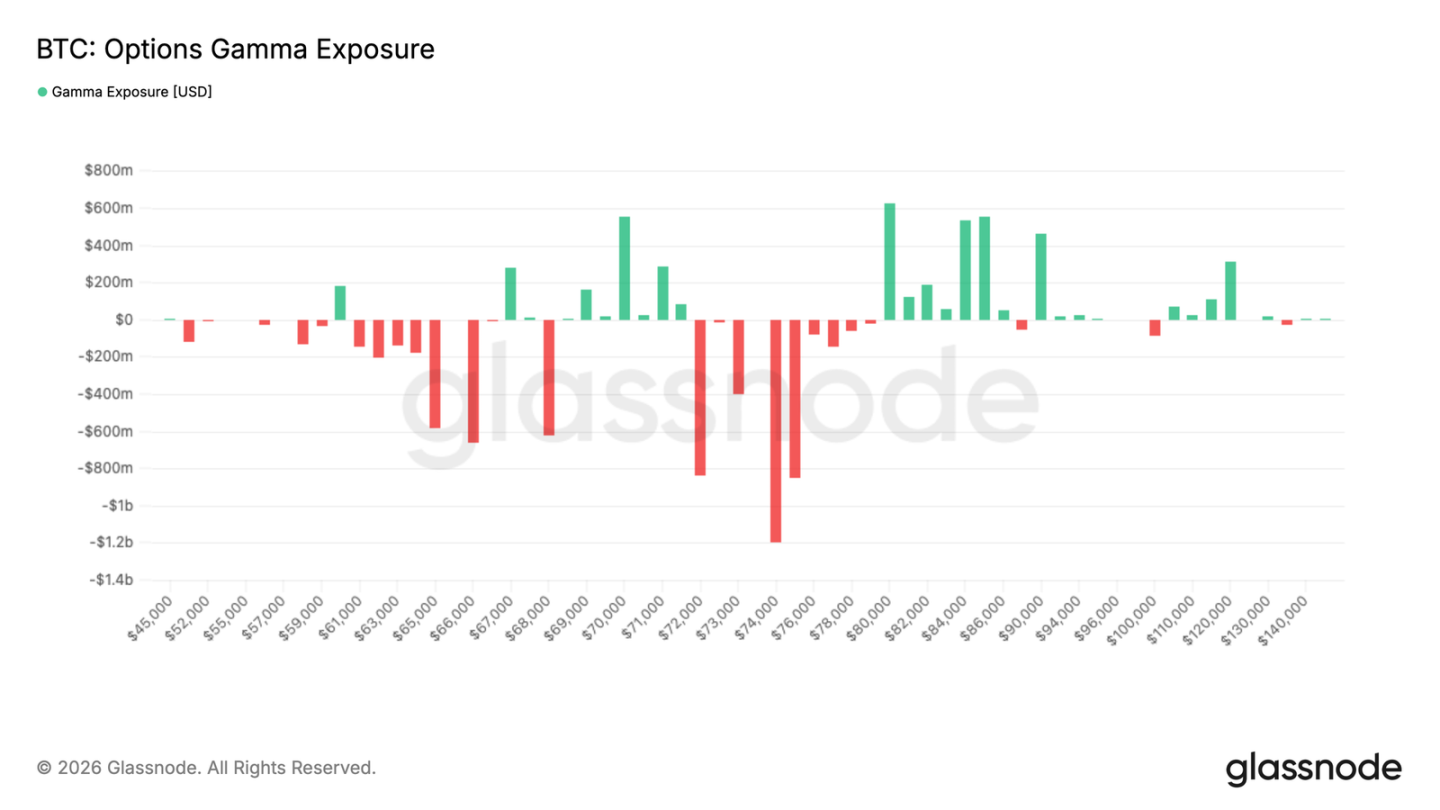
- Changes in the gamma positioning of options market makers have created a positive gamma zone between $69,000 and $71,500, which may provide near-term support below the current price.
Original Author: Glassnode
Original Compilation: AididiaoJP, Foresight News
Bitcoin has rebounded from $67,000 to $72,000, but weak spot demand and slowing futures activity indicate that this recovery still lacks strong conviction, with ETF flows beginning to show slight positive inflows.
Summary
- Bitcoin remains in a sluggish and low-confidence market environment. Weak spot activity and declining derivatives participation continue to limit the sustainability of price upside.
- Binance's 30-day relative trading volume remains below the baseline. This indicates a lack of strong organic demand behind the recent price stabilization.
- US spot ETF flows have begun to improve. After a prolonged period of net outflows, they have turned to slight net inflows. This suggests initial signs of institutional demand returning around current price levels.
- Futures trading volume has declined significantly, with the 30-day average turning downward and trending lower. This reinforces the view that traders are stepping back to observe rather than actively re-engaging after the recent deleveraging event.
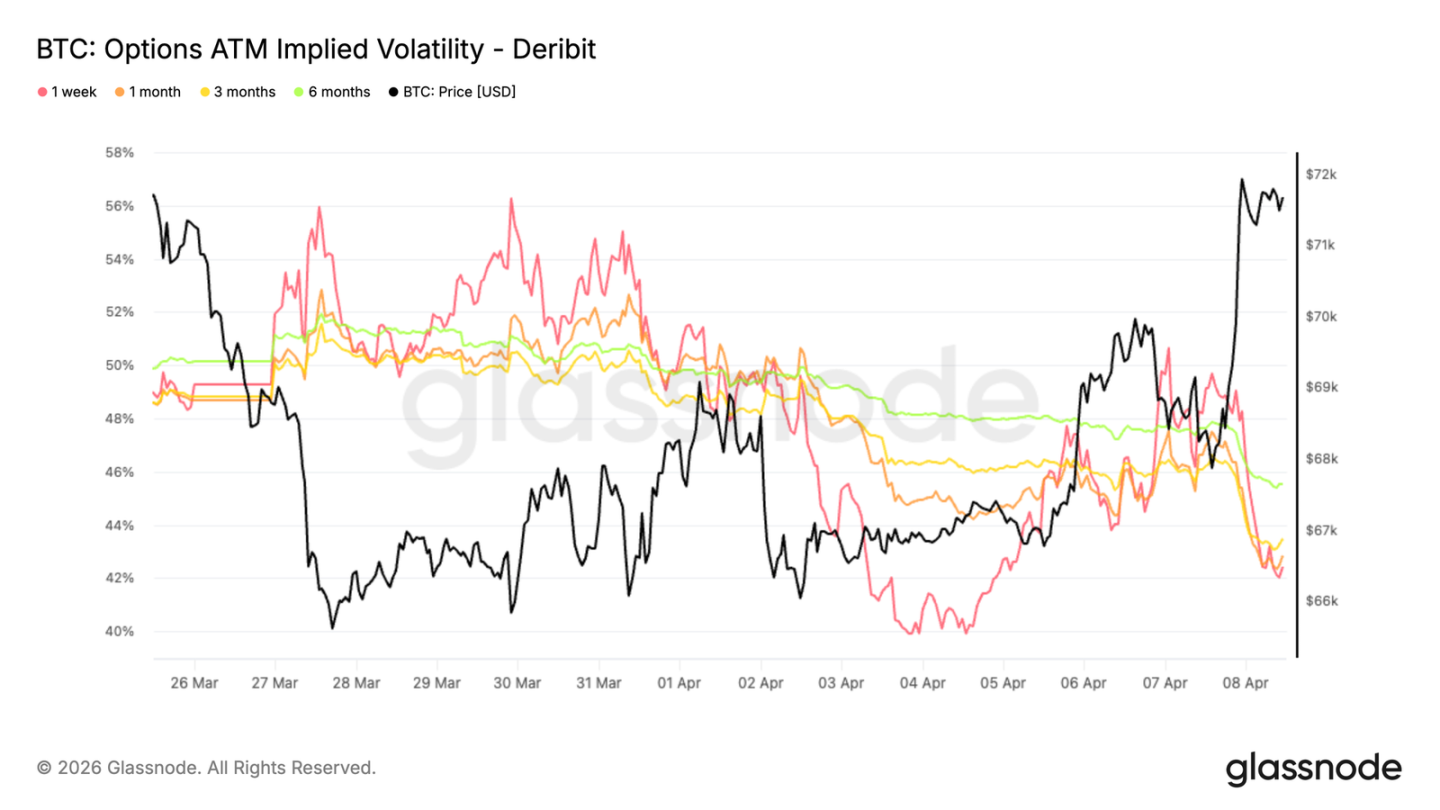
- Looking at implied volatility, option pricing has declined across the curve, with short-term volatility falling back to around 40% and 6-month volatility around 45%, reflecting a broad repricing of expected volatility.
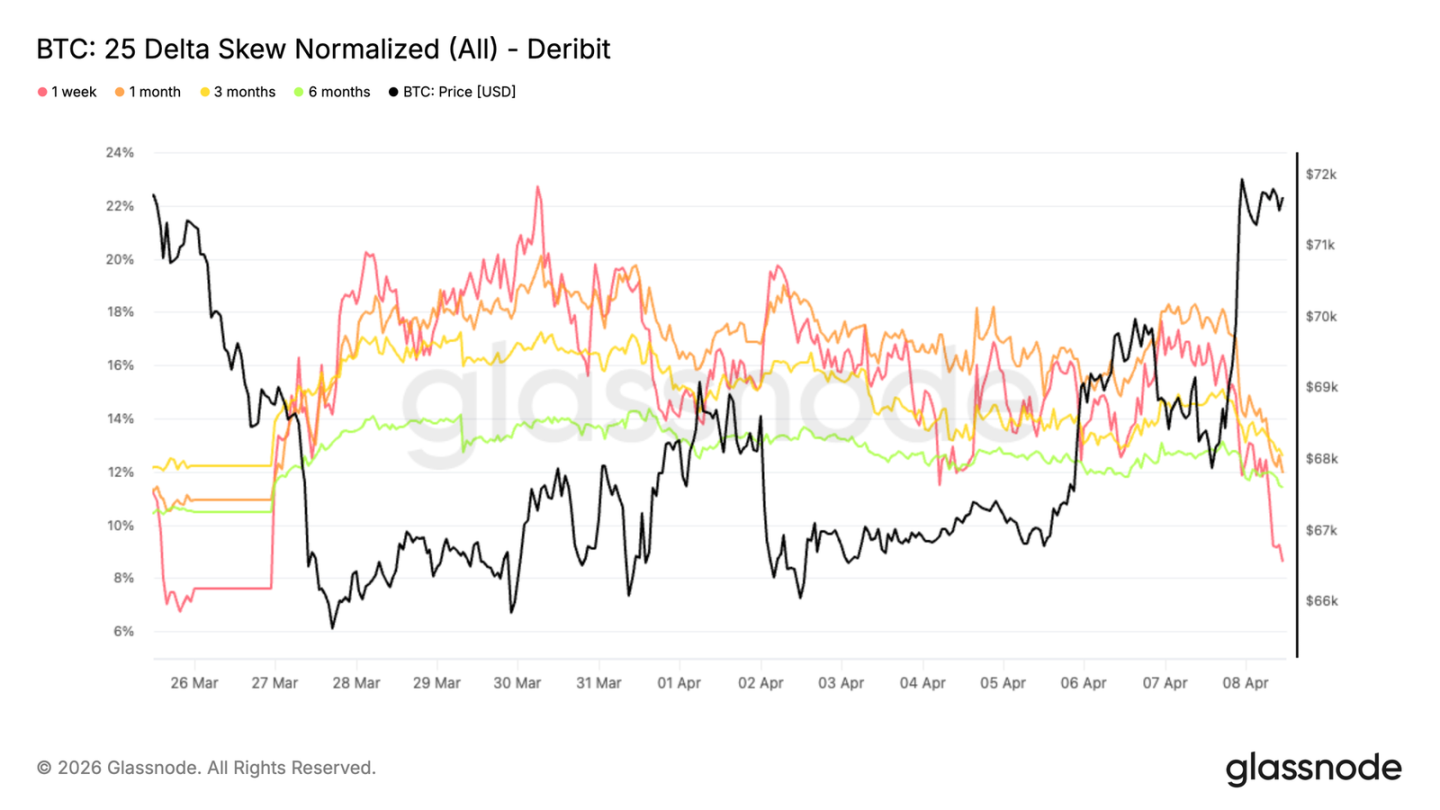
- Despite the overall easing of volatility, the relative pricing of options still reflects a defensive bias. Skew remains tilted towards puts, meaning the price of downside protection is still higher than upside exposure. This indicates participants are willing to reduce overall volatility exposure but are not willing to give up protection against adverse moves.
- Shifting from pricing to actual market behavior, price volatility continues to moderate. The market has calmed down after earlier turbulence, with reduced leverage and aggressive moves. However, this calm is accompanied by a decline in participation and shrinking trading volume. Looking at market maker positioning, the gamma distribution has changed significantly compared to last week. Negative gamma is primarily located above the current price, while a positive gamma zone has formed between $69,000 and $71,500. This provides short-term downside support, as dealers are incentivized to buy on dips within that range.
Overall, the market is transitioning towards a more balanced structure. Downside volatility may be more suppressed in the short term, while resistance is building overhead.
On-Chain Insights
After weeks of geopolitical tensions that heightened uncertainty across energy, equity, and Bitcoin markets, initial signs of de-escalation are beginning to create room for a potential rebound above $70,000.
Against this backdrop, this report steps back from short-term price noise to examine the most immediate on-chain resistance and support levels affecting the medium to long-term outlook, and provides a broader assessment of investor behavior and sentiment.
Still Within the Bear Market Value Zone
Against the macro backdrop described above, comparing the spot price to key on-chain pricing models reveals that the market remains structurally within bear market territory.
The Realized Price of $54,000 represents the average acquisition cost of all circulating supply. The True Market Mean of $78,000 narrows the calculation to only tokens involved in active trading. These two prices together define the boundaries of the current bear market value zone.
Historically, trading within this zone typically indicates the market has not yet transitioned to a sustainable recovery phase. Compounding this, the spot price remains below the Short-Term Holder Cost Basis of $81,600. This level is the aggregate breakeven point for recent buyers, a particularly meaningful threshold. Until the price reclaims this level, the medium to long-term bias remains downward. Any rally into this zone is likely to encounter significant selling pressure from recent buyers looking to exit at or near their breakeven point.
Calibrating Bear Market Depth with the AVIV Ratio
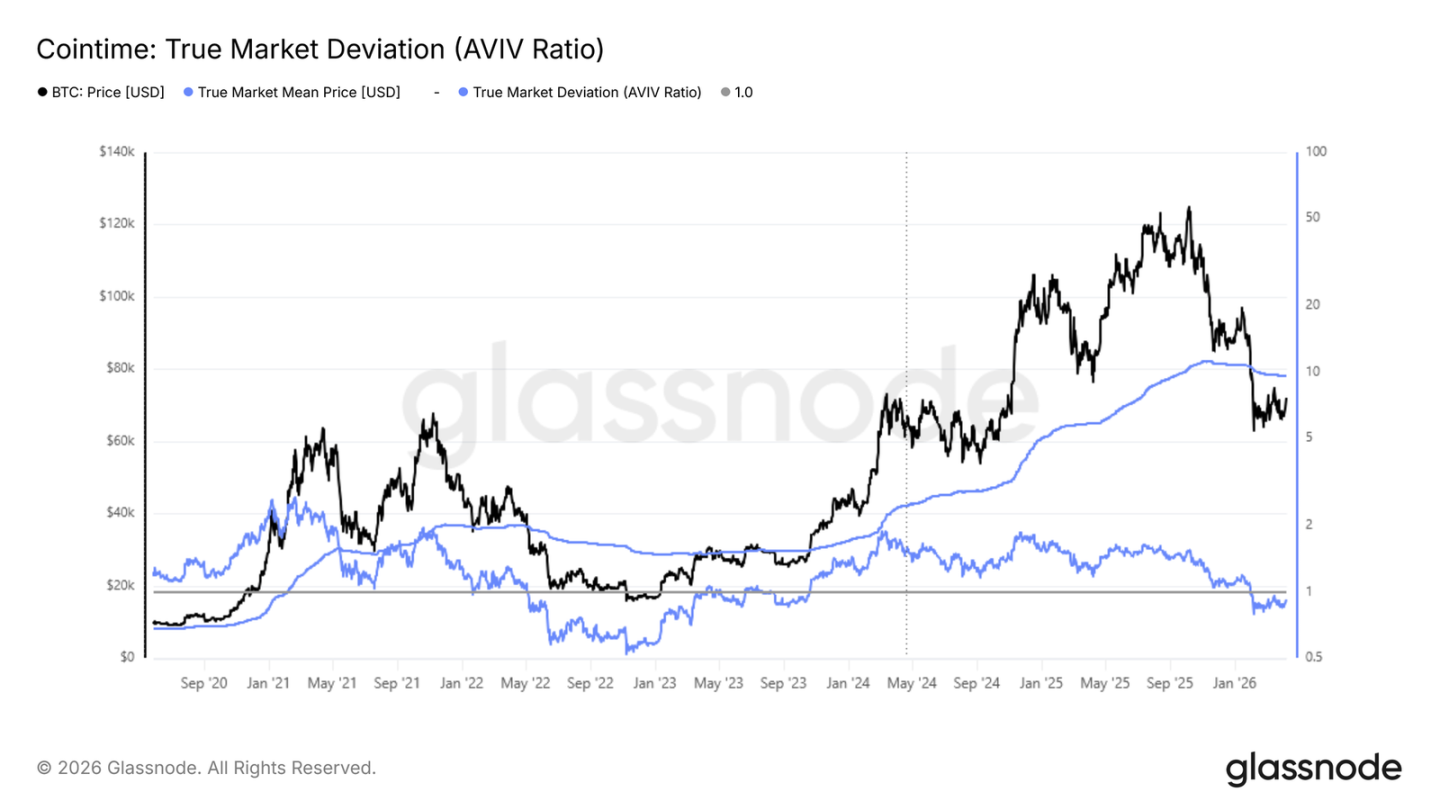
Given that the $78,000 True Market Mean serves as a potential medium-term ceiling for any rally, the AVIV Ratio provides a precise quantitative lens to compare the current market state with previous bear market cycles.
This metric is defined as the ratio of the spot price to the True Market Mean. It measures how far the market price deviates from the cost basis of active investors, acting as a valuation barometer across different cycle phases.
The ratio currently stands at 0.92 and has been below 1 since early February. The AVIV Ratio places the current environment close to market conditions observed in May-June 2022. This confirms we are in a bear market environment, albeit still significantly above the extreme depressed readings seen in Q3-Q4 2022.
This comparison is not a prediction of further deterioration but provides a framework to calibrate the potential depth and duration of the current bear market phase against similar historical precedents. Recovery timelines have varied significantly across previous cycles.
The Progress of Capitulation is Key
Synthesizing the structural picture above, Bitcoin remains range-bound within a traditional bear market. A short-term bounce towards the $78,000 True Market Mean is possible but is not yet supported by a substantive shift in underlying momentum.
Two conditions must be met before a sustainable recovery can be anticipated.
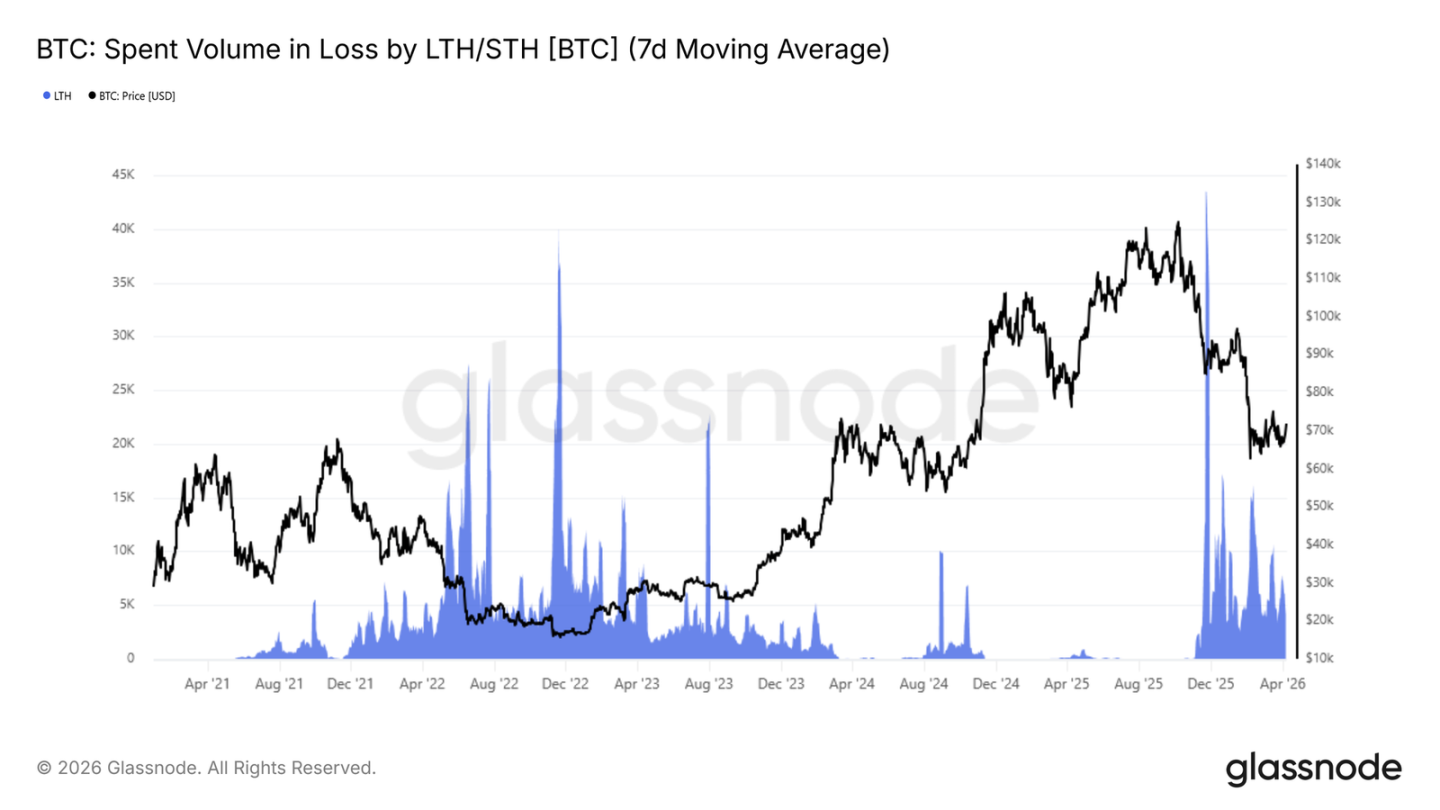
- The first is stabilization in the Short-Term Holder Cost Basis. This metric is still trending lower.
- The second is a significant reduction in realized loss pressure from investors who bought near the cycle highs.
The latter can be monitored via the 7-day moving average of Long-Term Holder Realized Loss Volume. This metric has remained above 4,000 BTC per day since November 2025. This reflects ongoing capitulation from top buyers who have not yet digested their loss-making positions. A sustained cooling of this metric below 1,000 BTC per day, combined with the price reclaiming the Short-Term Holder Cost Basis of $81,600, would together constitute the most reliable on-chain confirmation signal. It would indicate the current bear market phase is transitioning towards a pre-bull recovery structure.
Off-Chain Insights
Persistent Weakness in Spot Capital Flows
Spot activity remains weak. Binance's 30-day relative trading volume is still below the baseline and hovering near the lower end of its range. Recent data shows only a slight uptick, with no signs of a significant return in participation.
Price has managed to stabilize, but this has been achieved without strong spot support. This suggests the market remains driven by derivatives and short-term positioning rather than sustained buying interest.
Until spot demand recovers, rallies are likely to remain fragile with limited staying power. A clear expansion in trading volume would signal stronger conviction and a healthier foundation for sustained upside.
ETF Flows Turn Positive Initially
US spot ETF flows have begun to improve. The 14-day average has turned to slight net inflows after a prolonged period of net outflows. The magnitude of this shift remains small but is directionally important.
The previous sustained selling clearly indicated a distinct distribution phase, and now that pressure appears to be easing. There are initial signs of demand re-engaging around current price levels.
Sustained and increasing inflows would provide stronger downside support for the market. For now, this looks more like initial stabilization than a full-fledged return of institutional demand.
Sharp Contraction in Futures Trading Volume
Futures trading activity has declined significantly, with the 30-day average turning downward and trending lower after the recent price drop. Volume has compressed back to the lower end of its range, reflecting a clear drop in derivatives market participation.
This slowdown is accompanied by a reduction in open interest. This reinforces the view that not only is leverage being unwound passively, but traders are stepping back to observe rather than immediately re-engaging. The lack of strong volume in the recent bounce suggests limited market conviction in this move higher.
For now, derivatives activity remains subdued, pointing to a calmer, less aggressive market environment. A recovery in futures volume would be an early signal of trader return and potential momentum rebuilding.
Implied Volatility Declines Across All Tenors
Starting with implied volatility, option pricing has declined across the term structure. Short-term volatility has softened noticeably, now back to just over 41%. Longer-dated volatility has also eased slightly, with 6-month volatility around 45%.
The announcement of a ceasefire in the Iran conflict pushed volatility even lower, accelerating the compression already in play. This shift suggests the market is pricing in a calmer near-term environment. With signs of de-escalation but limited conviction, fewer participants are willing to pay a premium for protection or convexity exposure.
This points to a low-conviction backdrop where traders are not actively positioning for imminent catalysts. At the same time, this repricing makes options cheaper to enter, which could facilitate positioning ahead of known events. The key dynamic to watch is whether this compression leads to renewed activity or merely prolongs the current state of low participation.
Skew Signals Continued Caution
Despite the overall easing of volatility, the relative pricing of options still reflects a defensive bias. While skew moderated slightly after the ceasefire announcement, with the put side dropping from near +20% to just over +10%, this adjustment appears more like a news-driven squeeze than a structural shift between call and put demand.
Skew remains tilted towards puts, meaning the price of downside protection is still higher than upside exposure. This indicates participants are willing to reduce overall volatility exposure but are not willing to give up protection against adverse moves.
The combination of declining volatility and persistent put demand points to a market not positioned for strong upside but remaining cautious of downside risks. Traders are still prioritizing protection.
Realized Volatility Continues to Slide
Shifting from pricing to actual market behavior, price volatility continues to moderate. Bitcoin's 30-day realized volatility currently stands at 42.5%, well below recent average levels. This reflects a market that has calmed down after earlier turbulence, with reduced leverage and aggressive moves.
However, this calm is accompanied by a decline in participation and shrinking trading volume. Under these conditions, price becomes more sensitive to incremental flows. This means relatively small trades can move the market, without establishing clear trends. Liquidity is limited, and price action is increasingly driven by short-term flows rather than sustained direction.
This environment is not indicative of strength but points to a lack of engagement. The market is more reactive than proactive. With implied volatility also lower, the 1-month volatility risk premium is now near zero. This structure has historically provided attractive entry points for volatility buyers.
Gamma Positioning Shifts to Provide Support Below Spot
Turning to dealer positioning, the gamma distribution has changed significantly compared to last week. Previously, the market was in a broad negative gamma regime stretching from the $40,000s all the way to $80,000. This created conditions where dealer hedging could amplify price moves in either direction.
That structure has now evolved. Negative gamma is primarily located above the current price. A positive gamma zone has formed between $69,000 and $71,500. This provides short-term downside support, as dealers are incentivized to buy on dips within that range.
Recent geopolitical developments have also renewed interest in upside exposure. But this is expressed through spread structures. This explains why negative gamma now reappears further above spot, particularly beyond the $80,000 region.
Overall, the market is transitioning towards a more balanced structure. Downside volatility may be more suppressed in the short term, while resistance is building overhead.
Conclusion
Across spot, futures, and options markets, the dominant theme is stabilization in the absence of strong conviction. Spot participation remains weak, and futures activity has contracted significantly. Although ETF flows have turned slightly positive, the broader market still lacks the depth of demand typically associated with more enduring recovery phases.
The options market echoes this message. Implied volatility has compressed across the curve, yet skew remains tilted towards puts. This indicates traders are willing to reduce volatility exposure but are not abandoning downside protection. Meanwhile, realized volatility continues to moderate, reflecting a calmer but thinner market backdrop where incremental flows can still have an outsized impact on price.
Synthesizing these views, the market appears to be shifting towards a cleaner, more balanced structure after the recent flush, but it has not yet entered a fully positive, constructive trend. Achieving such a transition will likely require stronger spot demand, broader participation, and more decisive re-engagement from the derivatives market.


