
CoinW Research Weekly Report (Issue: March 23, 2026 - March 29, 2026)
- Core View: The cryptocurrency market experienced a slight correction overall this week, with total market capitalization declining by 1.66%. Market sentiment is in a state of extreme fear. However, on-chain activity shows structural divergence, with some public chains seeing counter-trend growth in transaction volume and user activity.
- Key Elements:
- Overall Market Pressure: The total global cryptocurrency market capitalization fell to $2.37 trillion, a weekly decline of 1.66%; the market fear & greed index stands at 9, indicating an "Extreme Fear" state.
- ETF Outflows: U.S. spot Bitcoin and Ethereum ETFs recorded net outflows this week of $296 million and $206 million, respectively.
- Divergence in On-Chain Activity: DEX trading volume on Solana and BNB Chain increased by 1.70% and 20.06% respectively, while Ethereum's saw a significant drop of 39.67%; daily active addresses on Solana, BNB Chain, and Aptos showed notable growth.
- Slight DeFi TVL Decline: The total value locked (TVL) in DeFi is $92.769 billion, down 0.22% weekly; Ethereum still dominates the market with a 57.03% share.
- Stablecoin Market Cap Stability: The total stablecoin market cap decreased slightly by 0.13% to $308.7 billion, with USDT accounting for 59.63% and USDC for 25.17%.
- Active Industry Developments: Multiple projects (e.g., Backpack, Perle Labs) completed Token Generation Events (TGE) this week, and several significant investments occurred, such as ICE's $6 billion investment in Polymarket.
Key Takeaways
The global cryptocurrency market capitalization is $2.37 trillion, down approximately 1.66% from last week's $2.41 trillion. As of press time, the cumulative net inflow into U.S. spot Bitcoin ETFs is approximately $55.93 billion, with a net outflow of $296 million this week; the cumulative net inflow into U.S. spot Ethereum ETFs is approximately $11.52 billion, with a net outflow of $206 million this week.
The total stablecoin market capitalization is $308.7 billion, down about 0.13% from last week's $309.1 billion. Among them, USDT's market cap is $184.07 billion, accounting for 59.63% of the total stablecoin market cap, showing a slight decrease from last week; followed by USDC with a market cap of $77.7 billion, accounting for 25.17% of the total, down about 1.52% from last week's $78.9 billion; DAI's market cap is $5.36 billion, accounting for 1.75% of the total, unchanged from last week.
According to data from DeFiLlama, the total DeFi TVL this week is $92.769 billion, down about 0.22% from last week's $92.973 billion. Categorized by public chains, the top three chains by TVL are Ethereum, accounting for 57.03%; Solana, accounting for 6.85%; and BNB Chain, accounting for 5.69%.
This week's on-chain data shows characteristics of divergent trading activity, recovering users, but a slight withdrawal of funds. In terms of DEX trading volume, Solana ($1.075B, +1.70%) and BNB Chain ($0.784B, +20.06%) performed strongly, while Ton, though smaller in scale, showed an increase. Ethereum declined to $0.73B (-39.67%), with Sui and Aptos also declining in sync. Regarding transaction fees, Ethereum remained around $0.01, Solana rose to $0.003, while fees on other chains generally decreased. In terms of users, active addresses on Solana (3.725 million, +3.93%), BNB Chain (2.42 million, +2.11%), and Aptos (1.302 million, +60.41%) grew significantly, while Ethereum, Sui, and Ton saw declines. Regarding funds, TVL on all chains decreased slightly, with Ethereum still leading at $52.80B (-3.17%).
New Projects to Watch: Tori Finance is a decentralized yield protocol aiming to bring market-neutral, institutional-grade yield strategies, previously accessible only to institutional investors, on-chain, allowing ordinary users to participate in these strategies via Web3 wallets without high barriers or geographical restrictions. Kairos Swap is a cross-chain decentralized exchange protocol dedicated to providing users with efficient, secure multi-chain asset swapping and liquidity mining services, emphasizing the aggregation of on-chain liquidity depth through a permissionless AMM mechanism and reducing the cost and friction of cross-chain transactions. Eureka Builder is a decentralized development and collaboration platform for Web3 developers, aiming to provide teams and individuals with tools and infrastructure for building, deploying, and managing blockchain applications.
Table of Contents
Key Takeaways
I. Market Overview
1. Total Cryptocurrency Market Cap / Bitcoin Dominance
2. Fear & Greed Index
3. ETF Inflow/Outflow Data
4. ETH/BTC and ETH/USD Exchange Ratios
5. Decentralized Finance (DeFi)
6. On-Chain Data
7. Stablecoin Market Cap and Issuance
II. This Week's Hot Money Trends
1. Top 5 Weekly Gainers: VC Coins and Meme Coins
2. New Project Insights
III. Industry News
1. Major Industry Events This Week
2. Upcoming Major Events Next Week
3. Important Fundraising Last Week
IV. Reference Links
I. Market Overview
1. Total Cryptocurrency Market Cap / Bitcoin Dominance
The global total cryptocurrency market cap is $2.37 trillion, down approximately 1.66% this week from last week's $2.41 trillion.
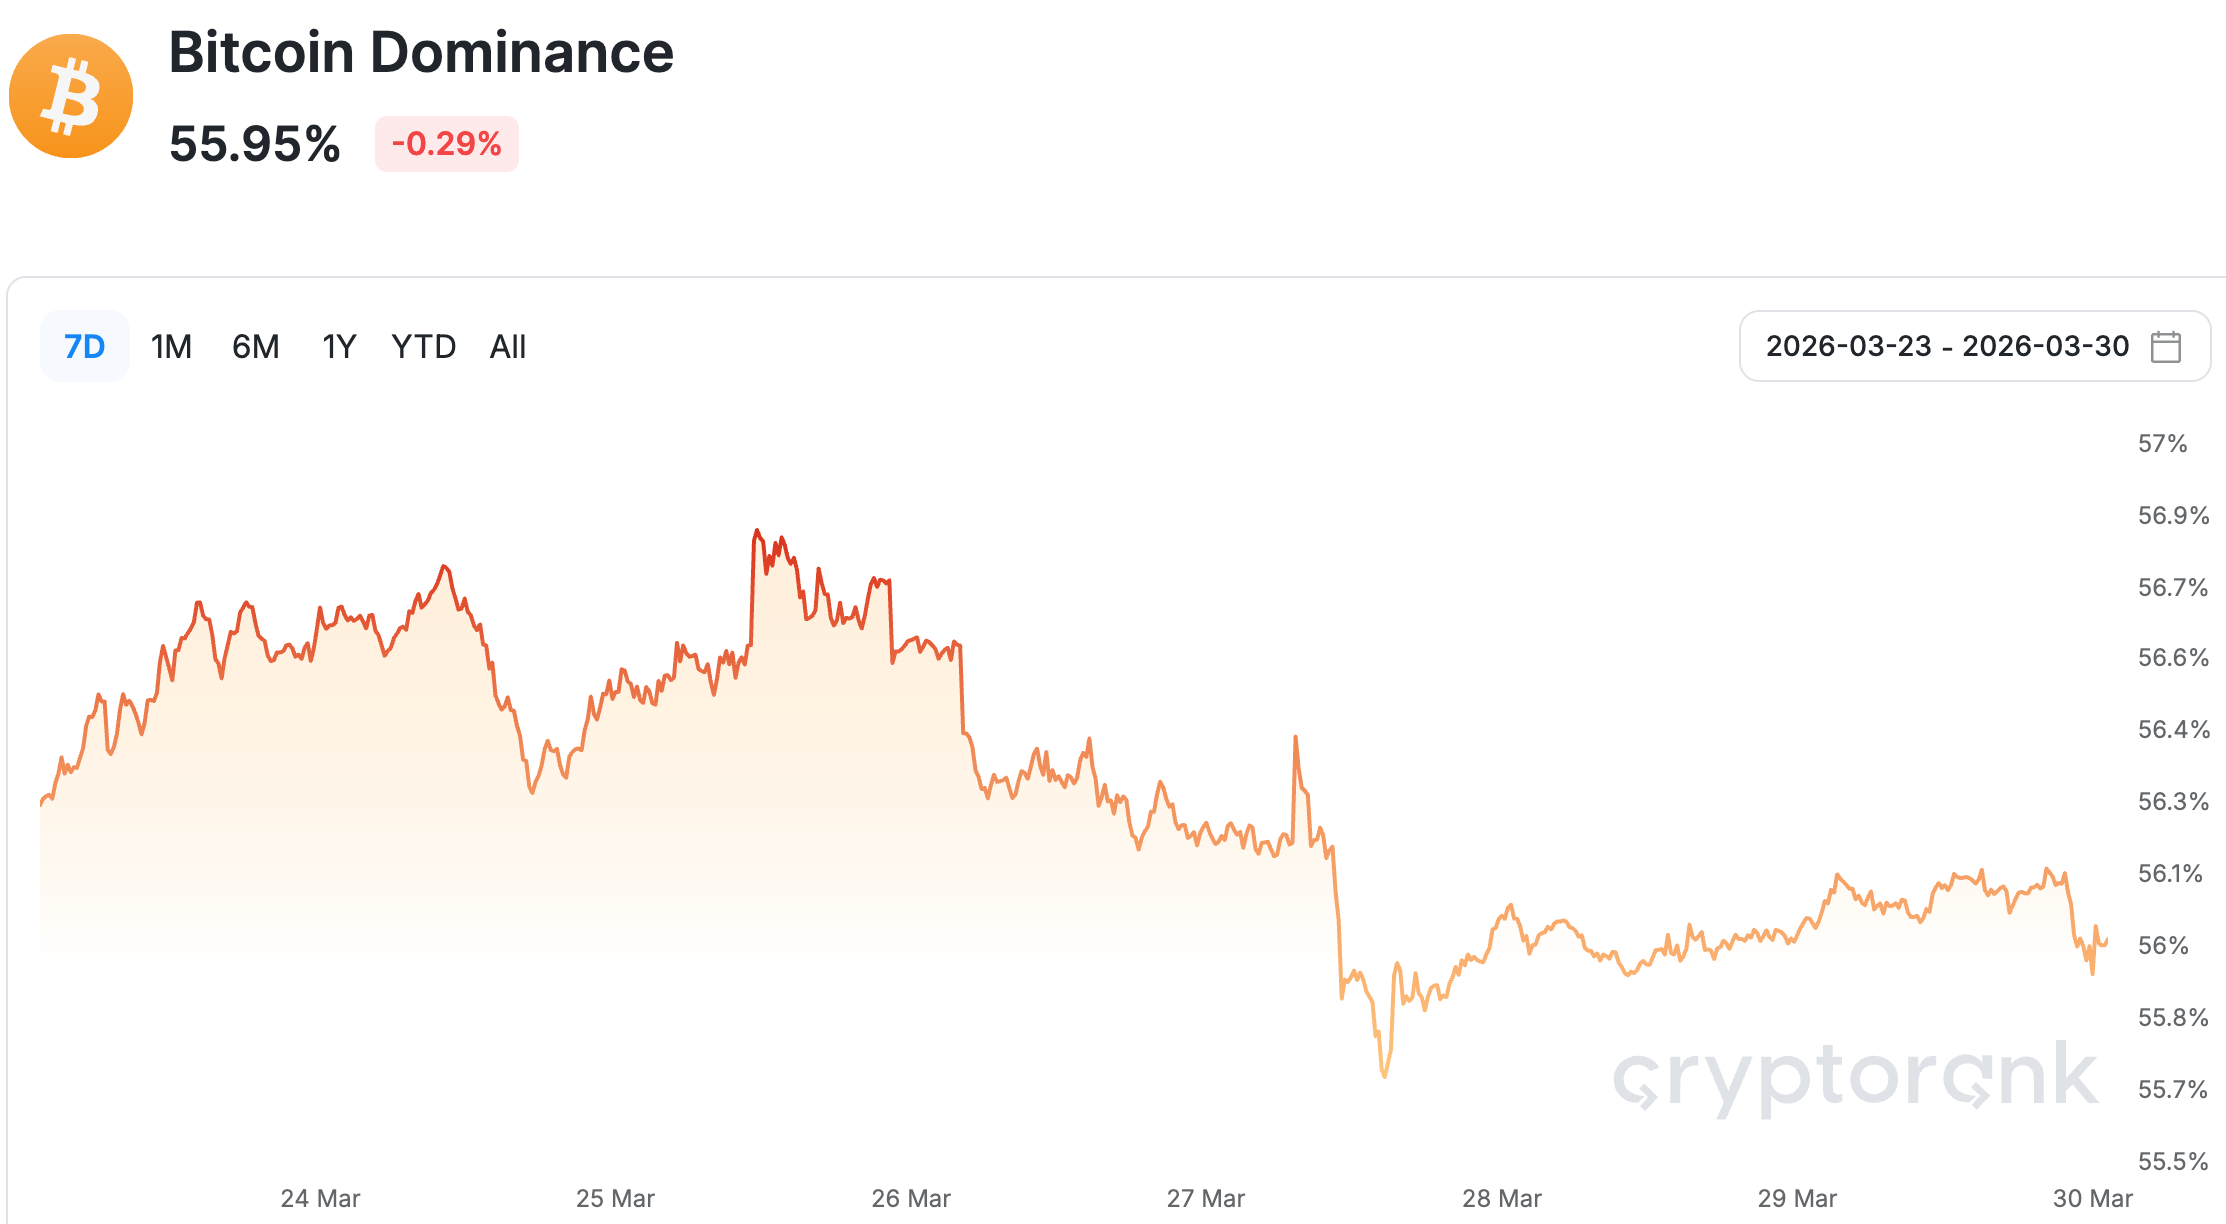
Data Source: Bitcoin dominance from cryptorank, https://cryptorank.io/charts/btc-dominance
Data as of March 29, 2026
As of press time, Bitcoin's market cap is $1.33 trillion, accounting for 56.12% of the total cryptocurrency market cap. Meanwhile, the stablecoin market cap is $308.7 billion, accounting for 13.03% of the total cryptocurrency market cap.
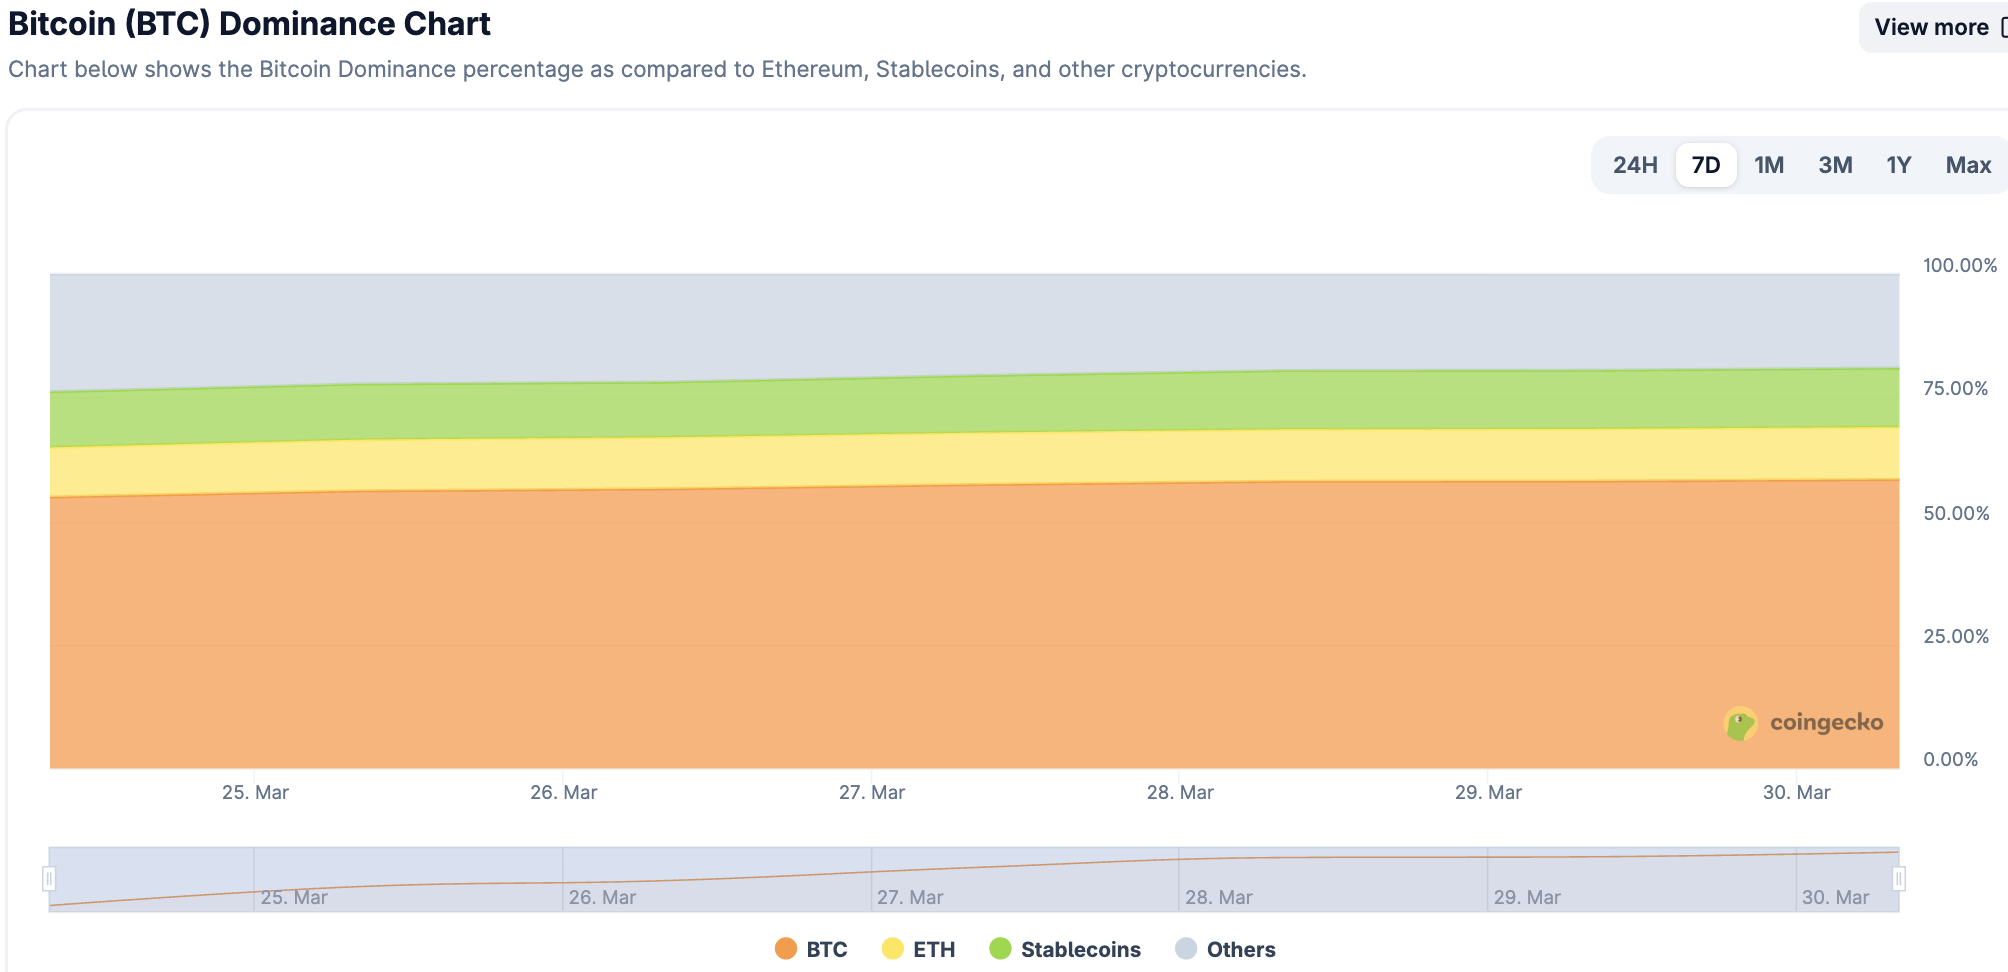
Data Source: coingecko, https://www.coingecko.com/en/charts
Data as of March 29, 2026
2. Fear & Greed Index
The Cryptocurrency Fear & Greed Index is 9, indicating Extreme Fear.
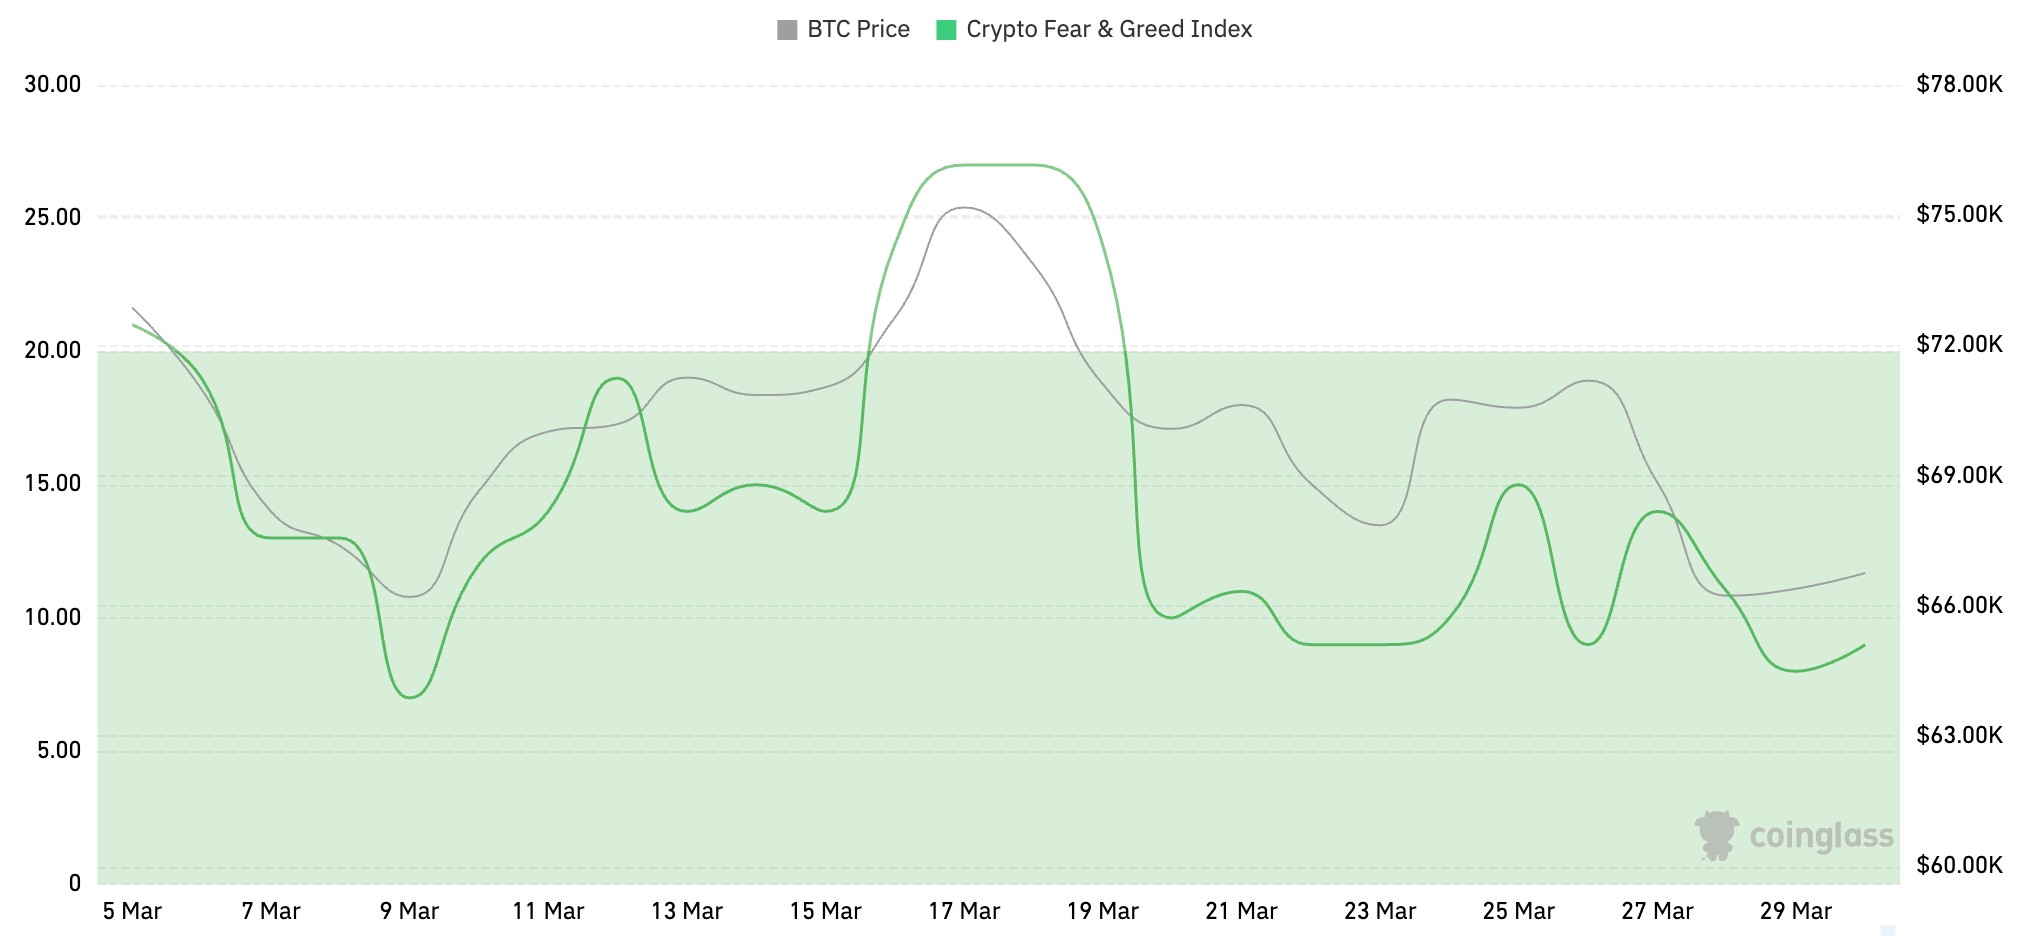
Data Source: coinglass, https://www.coinglass.com/pro/i/FearGreedIndex
Data as of March 29, 2026
3. ETF Inflow/Outflow Data
As of press time, the cumulative net inflow into U.S. spot Bitcoin ETFs is approximately $55.93 billion, with a net outflow of $296 million this week; the cumulative net inflow into U.S. spot Ethereum ETFs is approximately $11.52 billion, with a net outflow of $206 million this week.
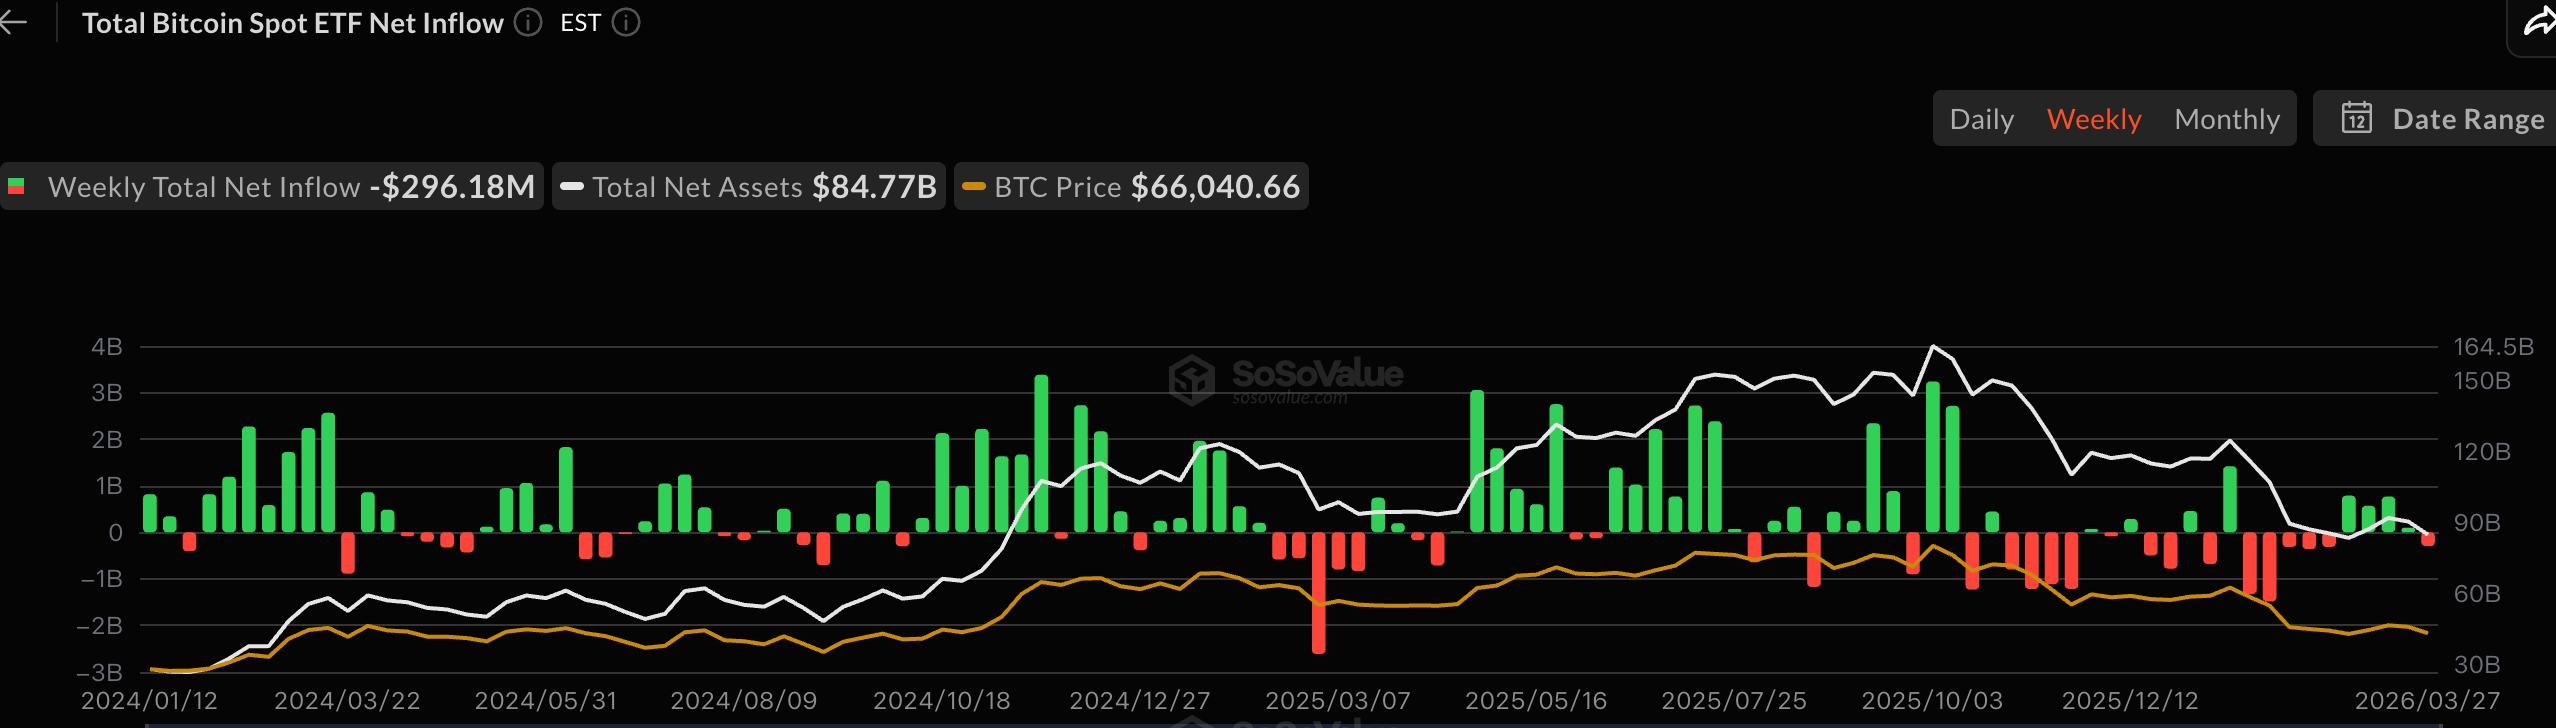
Data Source: sosovalue, https://sosovalue.com/zh/assets/etf
Data as of March 29, 2026
4. ETH/BTC and ETH/USD Exchange Ratios
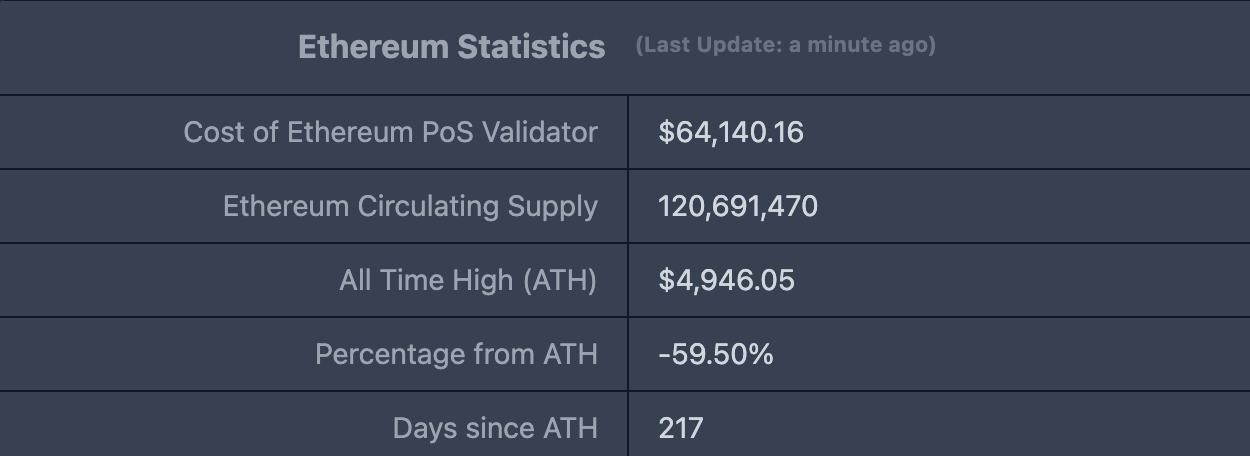
ETHUSD: Current price $2,003.94, all-time high $4,946.05, down approximately 59.50% from ATH.
ETHBTC: Currently 0.030144, all-time high 0.1238.
Data Source: ratiogang, https://ratiogang.com/
Data as of March 29, 2026
5. Decentralized Finance (DeFi)
According to data from DeFiLlama, the total DeFi TVL this week is $92.769 billion, down about 0.22% from last week's $92.973 billion.
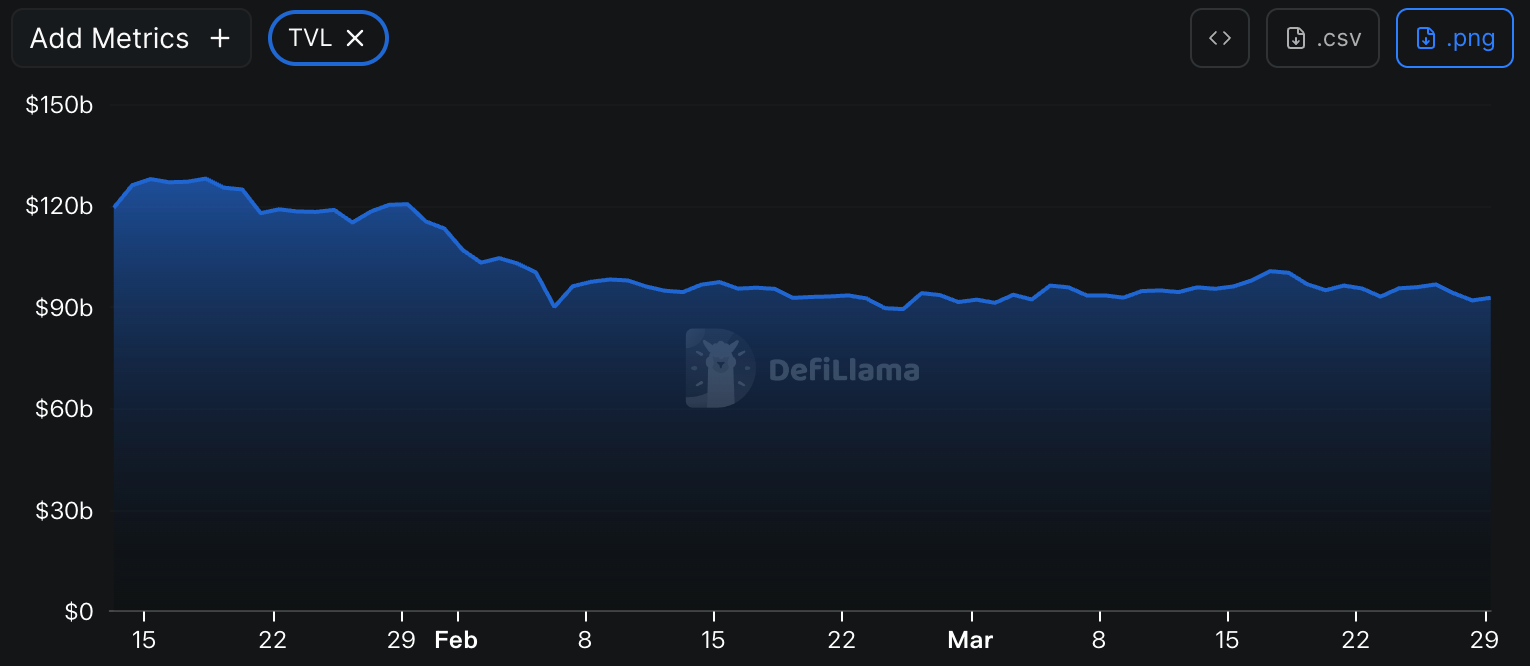
Data Source: defillama, https://defillama.com
Data as of March 29, 2026
Categorized by public chains, the top three chains by TVL are Ethereum, accounting for 57.03%; Solana, accounting for 6.85%; and BNB Chain, accounting for 5.69%.
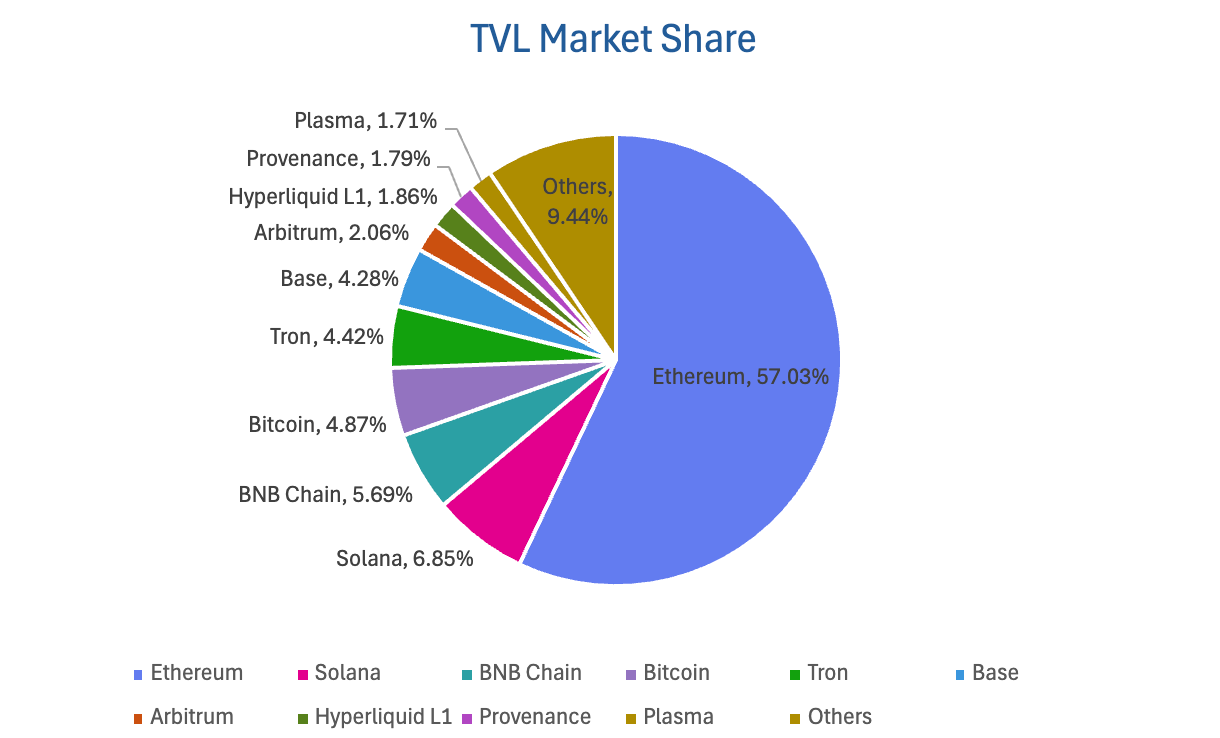
Data Source: CoinW Research Institute, defillama, https://defillama.com
Data as of March 29, 2026
6. On-Chain Data
Layer 1 Related Data
This section analyzes data for major Layer 1 chains including ETH, SOL, BNB, TON, SUI, and APTOS, focusing on daily trading volume, daily active addresses, and transaction fees.
Data Source: CoinW Research Institute, defillama, https://defillama.com
Data as of March 29, 2026
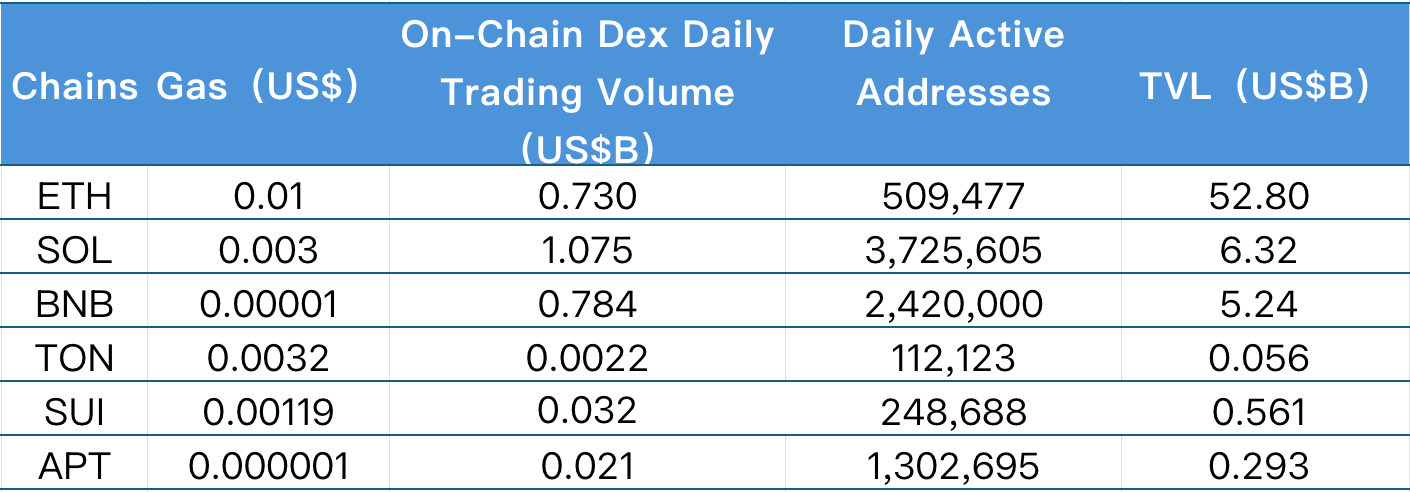
On-Chain DEX Daily Volume and Transaction Fees: On-chain DEX daily volume and transaction fees are core metrics for measuring public chain activity and user experience. In terms of daily DEX volume this week, Solana ($1.075B, +1.70%), BNB Chain ($0.784B, +20.06%), and Ton ($0.0022B, +22.60%) increased; other chains declined: Ethereum ($0.73B, -39.67%), Aptos ($0.021B, -10.29%), and Sui ($0.032B, -21.42%). Regarding transaction fees, Ethereum remained around $0.01 this week; Solana ($0.003) rose 288.70% from last week; other chains saw varying degrees of decline: BNB ($0.00001, -99.90%), Ton ($0.0032, -68.00%), Sui ($0.00119, -29.82%), and Aptos ($0.000001, -2.02%).
Daily Active Addresses and TVL: Daily active addresses reflect a public chain's ecosystem participation and user stickiness, while TVL reflects user trust in the platform. In terms of daily active addresses, Ethereum (509k), Ton (112k), and Sui (248k) decreased by 10.06%, 1.48%, and 10.93% week-over-week, respectively; other chains recovered: BNB Chain (2.42 million, +2.11%), Solana (3.725 million, +3.93%), and Aptos (1.302 million, +60.41%). This week's TVL saw a slight overall pullback: Sui ($0.561B, -3.77%), Solana ($6.32B, -5.13%), Ethereum ($52.80B, -3.17%), BNB Chain ($5.24B, -3.07%), Aptos ($0.293B, -3.63%), and Ton ($0.056B, -3.89%).
Layer 2 Related Data
According to L2Beat data, the total TVL of Ethereum Layer 2 this week is $30.97 billion, down 1.81% from last week's $31.54 billion.
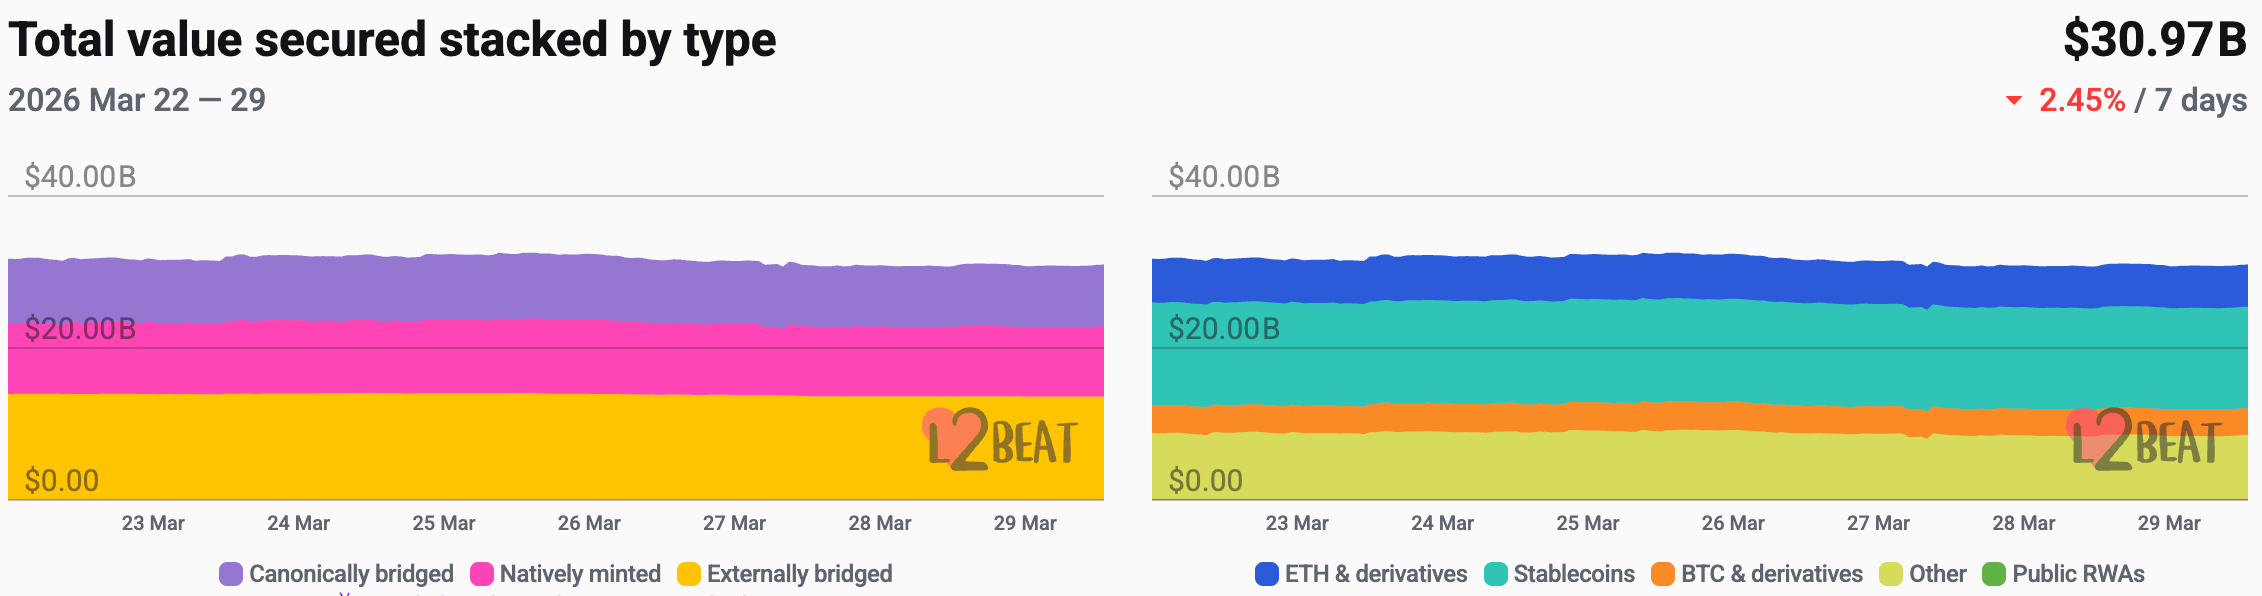
Data Source: L2Beat, https://l2beat.com/scaling/tvs
Data as of March 29, 2026
This week, Base and Arbitrum have market shares of 35.35% and 17.01%, respectively, ranking first and second.
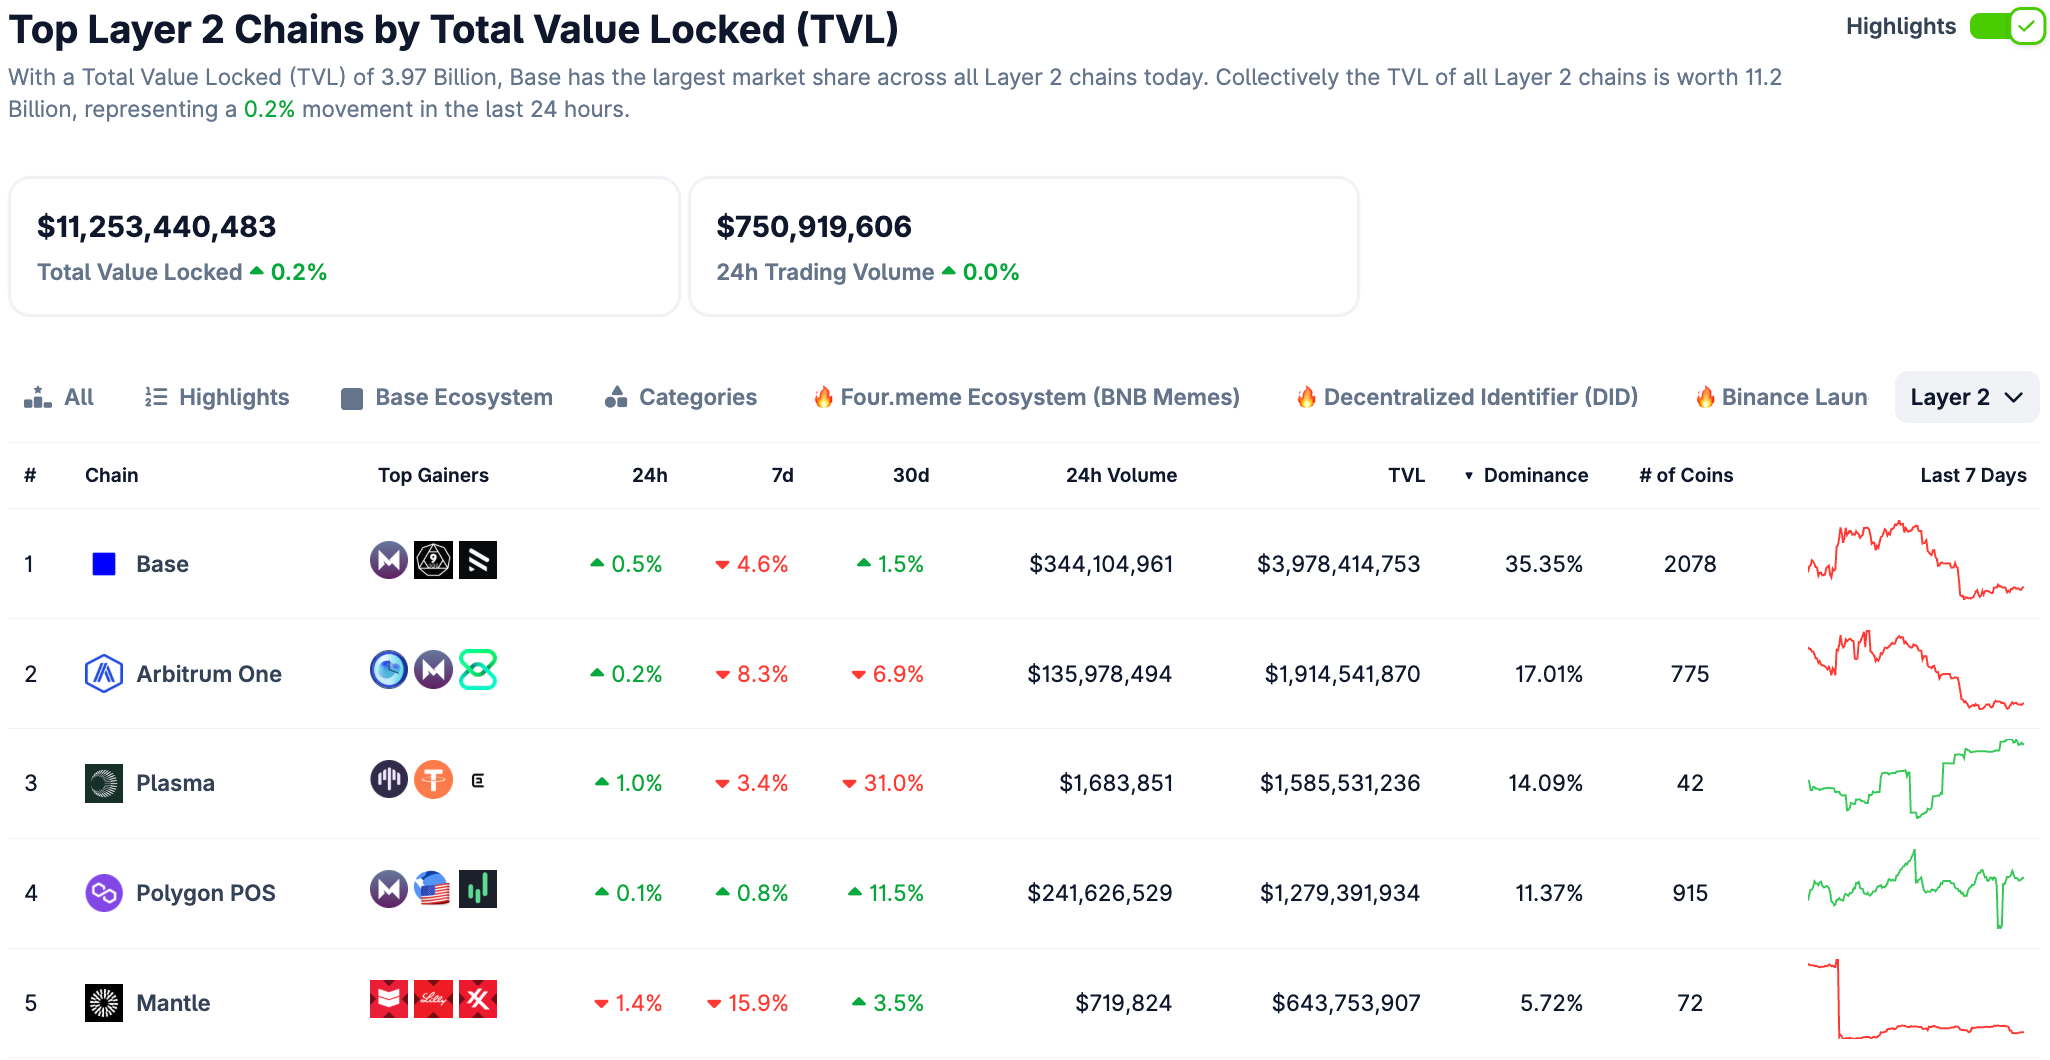
Data Source: CoinGecko, https://www.coingecko.com/en/chains/layer-2
Data as of March 29, 2026
7. Stablecoin Market Cap and Issuance
According to Coinglass data, the total stablecoin market cap is $308.7 billion, down about 0.13% from last week's $309.1 billion. Among them, USDT's market cap is $184.07 billion, accounting for 59.63% of the total stablecoin market cap, down about 0.04% from last week's $184.15 billion; followed by USDC with a market cap of $77.7 billion, accounting for 25.17% of the total, down about 1.52% from last week


