
Crypto Market Sentiment Research Report (2024.03.01-03.08): Bitcoin hit a new high, then fell sharply, and a large number of long positions were liquidated
Bitcoin once hit a new high, but has since fallen sharply, with bulls liquidating their positions in huge amounts
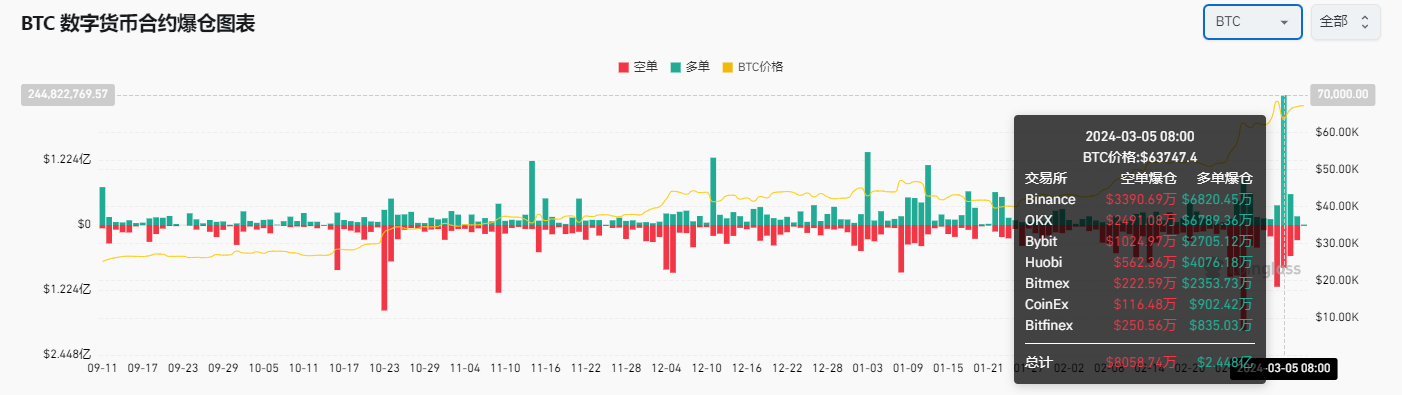
Data source of contract liquidation volume:https://www.coinglass.com/zh/LiquidationData
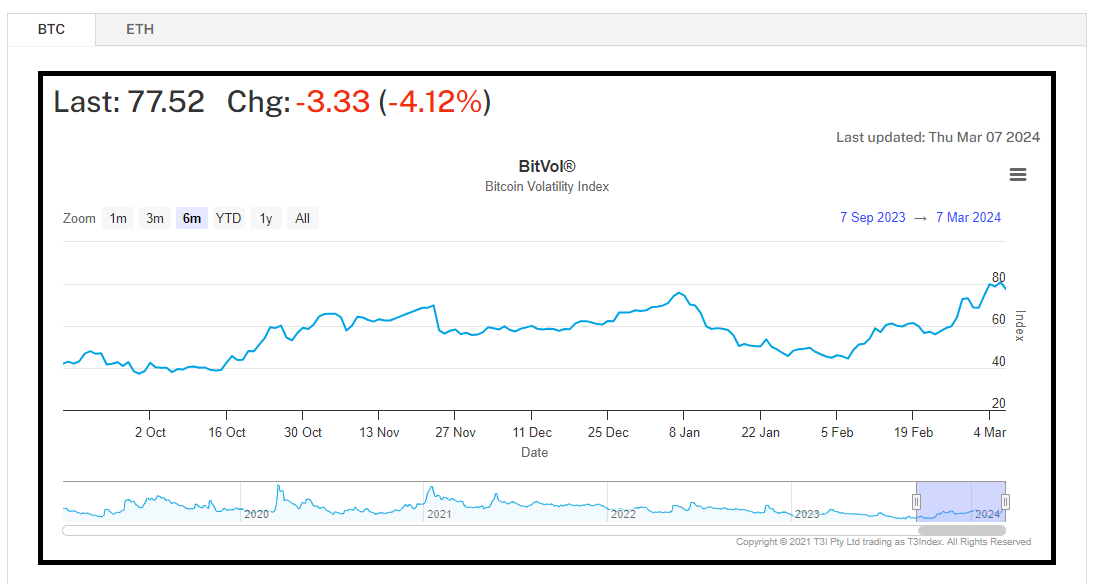
Bitcoin Implied Volatility Data Source:https://t3index.com/indexes/bit-vol/
Bitcoin once rose above US$69,000 to hit a record high on 03.05, and then fell sharply by nearly US$10,000. The volume of long contract liquidation that day reached US$244.8 million, setting a new high in the past six months. Bitcoin then rebounded. Near $67,000, at the same time, Bitcoin’s implied volatility also hit a new high in the past half-year in the past week, the market is in a high-volatility upward trend, and trading sentiment remains high.
What does this phenomenon mean, and how to safely invest in the crypto market next?
1. The volatility is very high, please use leverage with caution
In the current market, volatility is very high, so you need to use leverage with extreme caution when trading. Implied volatility hit a six-month high, indicating increased volatility in the market. Many traders who had previously profited from high leverage may have held fully leveraged long contracts when the currency price was high. However, when currency prices fall sharply in the short term, these traders may encounter the risk of insufficient margin and being liquidated. The liquidation of a large number of positions at the same time will also lead to insufficient short-term liquidity, aggravating the speed and magnitude of the decline, and thus triggering more liquidation phenomena. Therefore, in a volatile market environment, investors should carefully control the leverage ratio to avoid the risk of liquidation.
2. High trading sentiment, multiple allocation of quantitative strategies
In the last three months, quantitative strategies such as funding rate arbitrage and CTA trend strategies have performed well due to high sentiment for contract leverage trading and increased market volatility. These strategies have achieved excellent performance in the current market environment, and it is expected that the next market will continue to be beneficial to such quantitative strategies. In addition, professional trading strategies are usually able to close positions and stop trading in a timely manner after changes in the market environment, so they are very suitable for allocating funds at any time as needed. In the current environment of continued high trading sentiment and volatility, investors may consider increasing their allocation to quantitative strategies. These strategies use data and algorithms to make trading decisions and are better able to adapt to market changes and volatility, providing more stable return potential.
3. Balance the risk-reward ratio and make good use of the barbell strategy
During the bull market stage, many investors choose to hold a combination of cash currencies or conduct subjective trading contracts. This strategy can achieve substantial returns when the market rises. However, it also comes with greater volatility. As markets rise sharply, investors may face a declining return-to-risk ratio. To balance returns and risks, investors can consider leveraging a barbell strategy. When obtaining substantial principal returns, timely configure some stable income strategies, such as funding rate arbitrage, etc. These strategies can stabilize returns and provide some risk protection. By utilizing the barbell strategy, investors can strike a balance between high-risk, high-return strategies and stable-return strategies. This ensures the portfolios return stability in bull markets and reduces overall risk.
In the current market environment, the volatility is very high. Investors should use leverage carefully when conducting transactions to avoid the risk of liquidation. Market sentiment is high and quantitative strategies such as funding rate arbitrage and CTA trend strategies are performing well, and investors may consider increasing allocations to such strategies. At the same time, in order to balance income and risk, investors can use the barbell strategy to promptly allocate stable income strategies, such as funding rate arbitrage, when obtaining large principal returns, to ensure the income stability of the investment portfolio and reduce the overall risk. Investors should conduct sufficient research and due diligence when making any investment decisions, and make appropriate allocation decisions based on their own risk tolerance and investment objectives.
The Bitcoin halving is about 39 days away from today (2024.03.08)
Countdown to halving:https://www.nicehash.com/countdown/btc-halving-2024-05-10-12-00?_360safeparam=1289146171
Market technical and emotional environment analysis
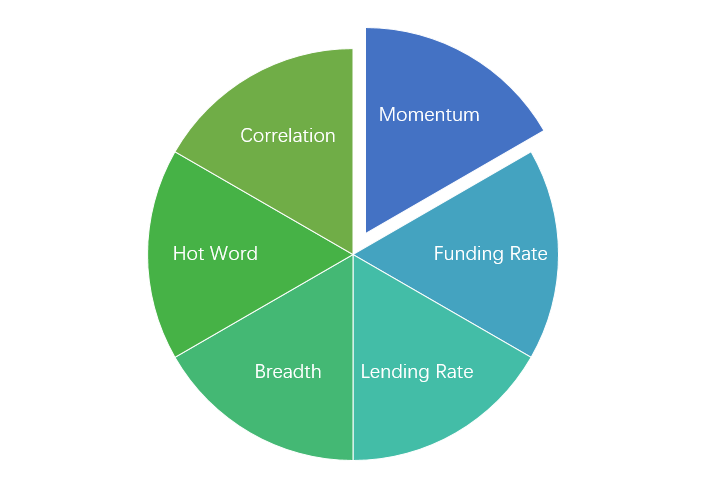
Sentiment analysis components
Technical indicators
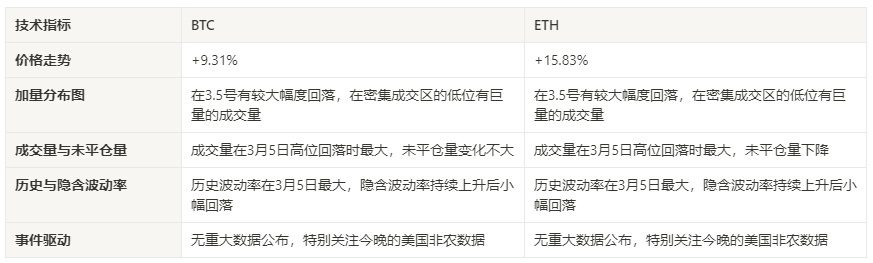
Price trend
BTC price increased by 9.31% and ETH price increased by 15.83% in the past week.
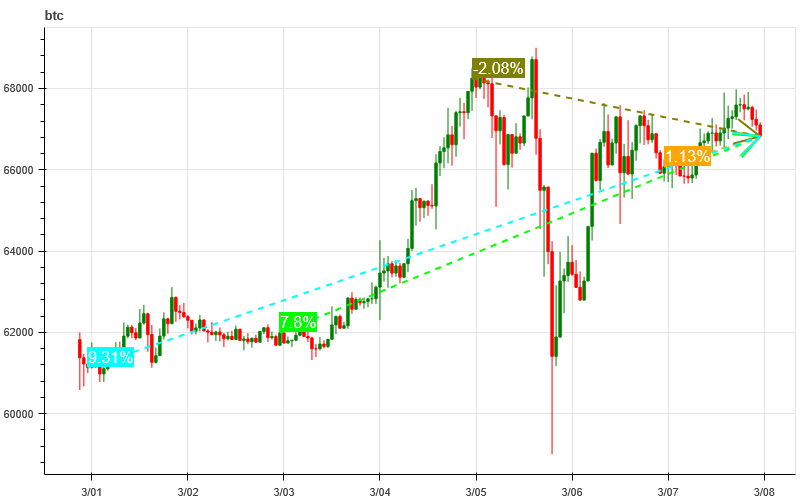
The picture above is the price chart of BTC over the past week
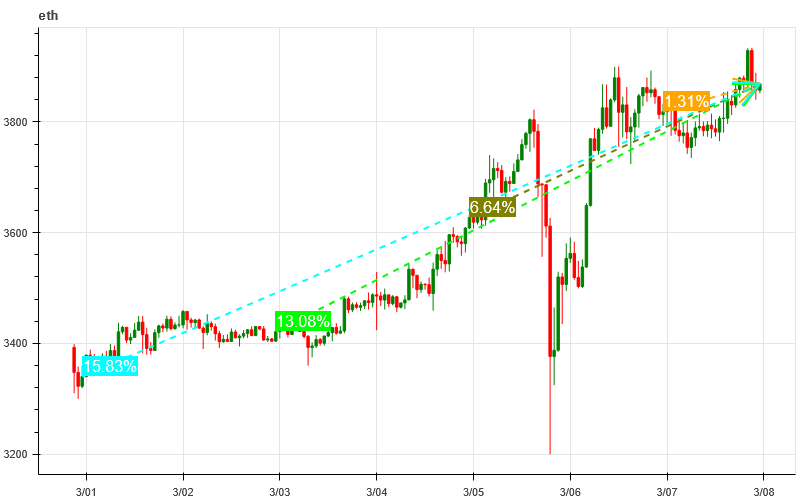
The picture above is the price chart of ETH over the past week
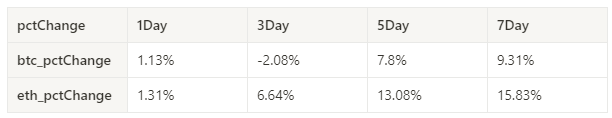
Table showing the rate of price change over the past week
Price and volume distribution chart (support and resistance)
In the past week, the prices of BTC and ETH have increased as a whole, falling significantly on the 3.5th, and there was a huge amount of trading volume at the low level of the intensive trading area.
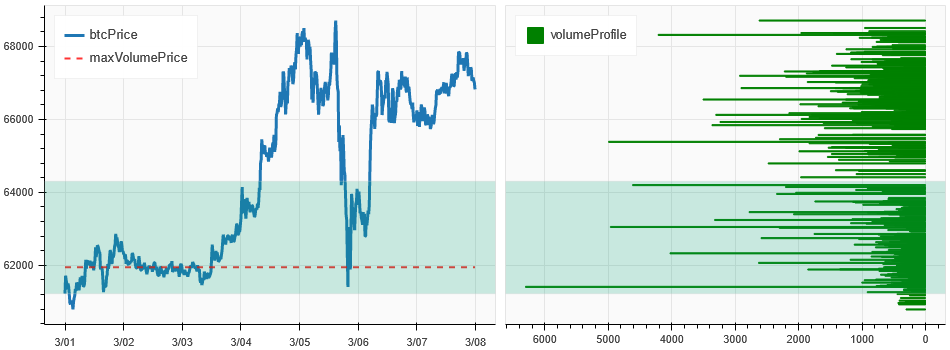
The picture above is the distribution map of BTC’s intensive trading areas in the past week.
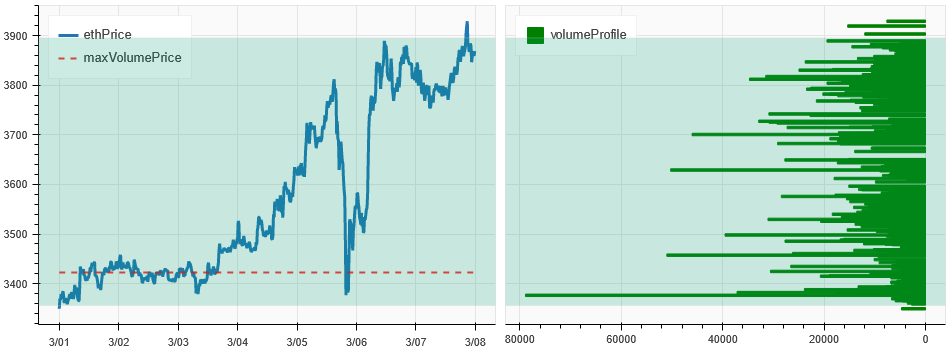
The picture above is the distribution map of ETH’s intensive trading areas in the past week.
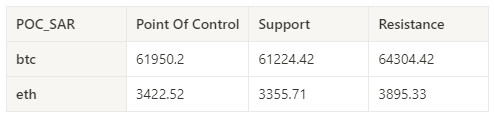
Table showing the intensive weekly trading ranges for BTC and ETH over the past week
Volume and Open Interest
The trading volume of BTC and ETH in the past week was the largest when it fell back from the high of 3.5; the open interest of BTC did not change much, and ETH continued to decline.
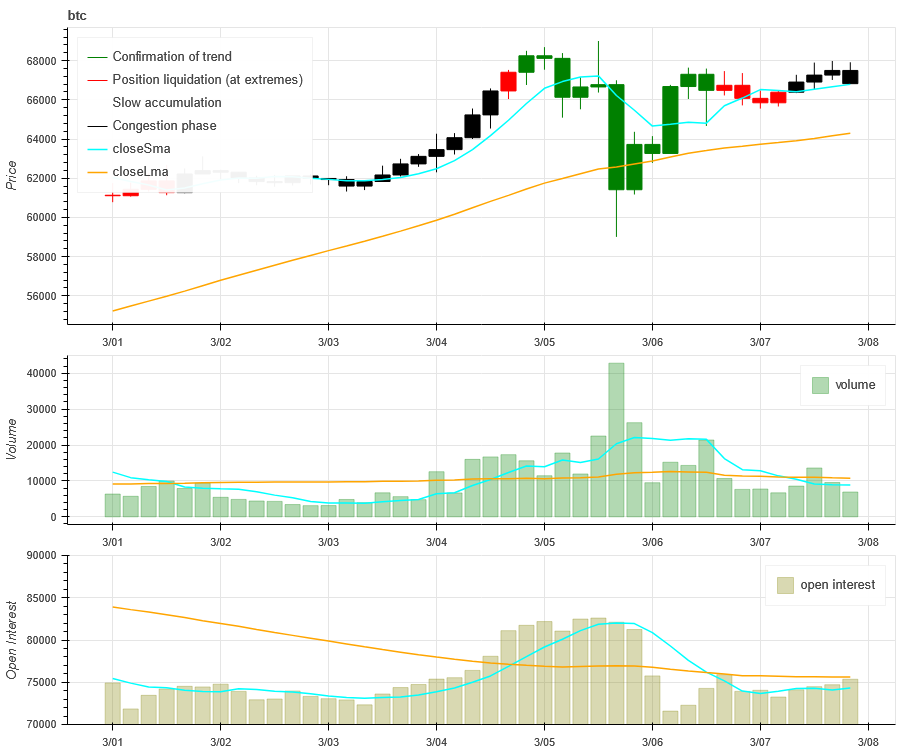
The price trend of BTC at the top of the picture above, the middle is the trading volume, the bottom is the open interest, the light blue is the 1-day average, and the orange is the 7-day average. The color of the K line represents the current status. Green means that the price rise is supported by trading volume, red means positions are being closed, yellow means positions are slowly accumulating, and black means congestion.
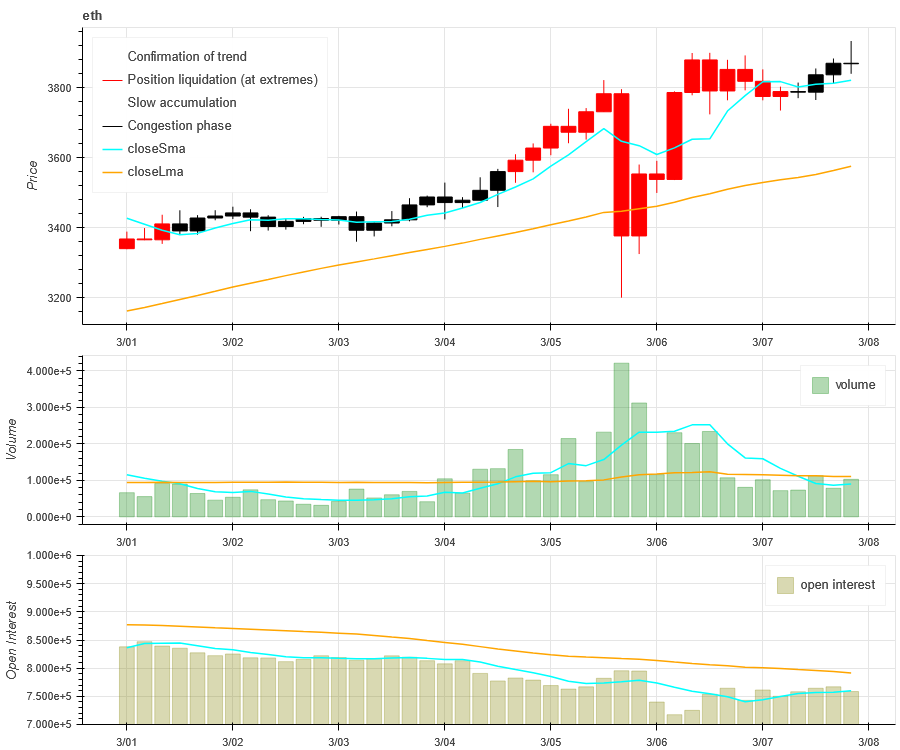
The price trend of ETH at the top of the picture above, the middle is the trading volume, the bottom is the open interest, the light blue is the 1-day average, and the orange is the 7-day average. The color of the K line represents the current status. Green means that the price rise is supported by trading volume, red means positions are being closed, yellow means positions are slowly accumulating, and black means congestion.
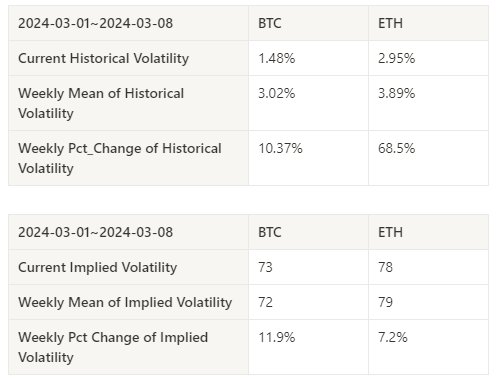
Historical Volatility vs. Implied Volatility
The historical volatility of BTC and ETH in the past week was the highest on 2024.03.05; the implied volatility of BTC and ETH both continued to rise and then fell slightly.
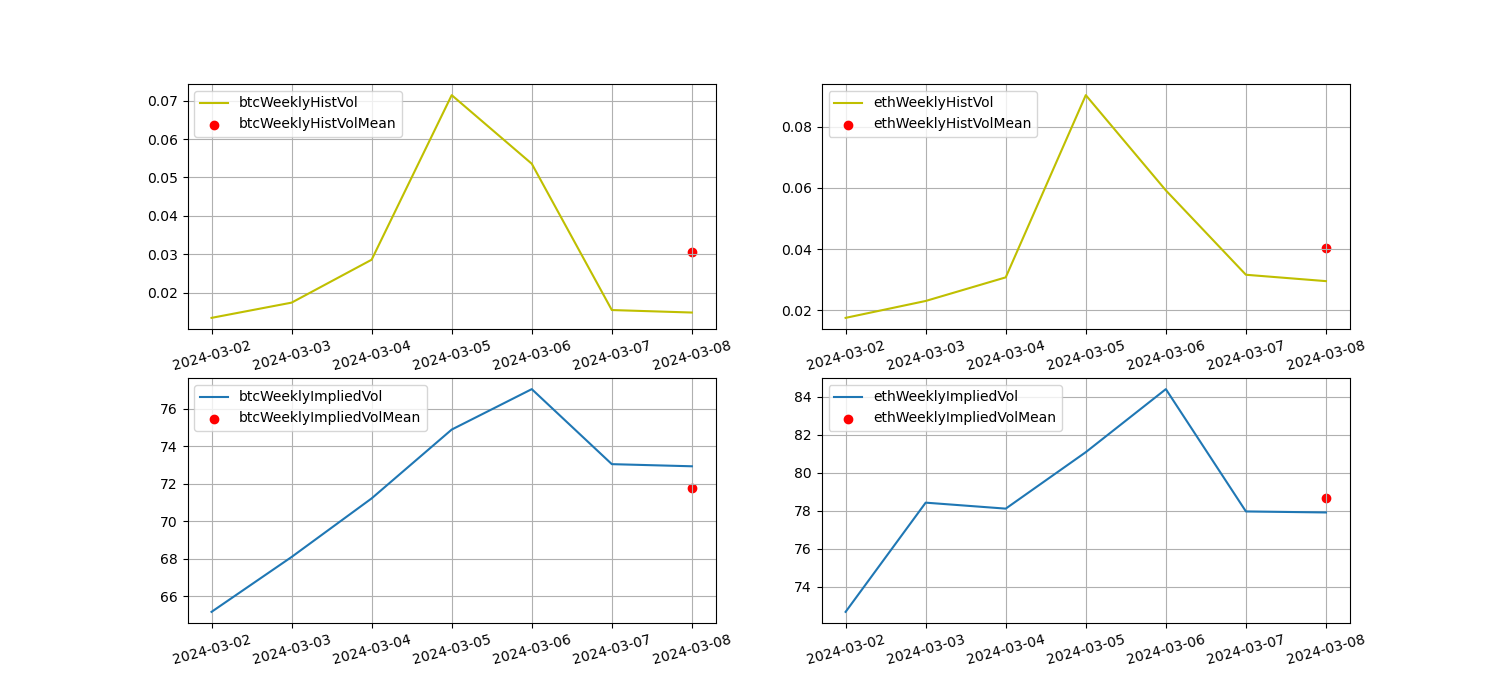
The yellow line is historical volatility, the blue line is implied volatility, and the red dot is its 7-day average
event driven
There is no event data this week. Pay attention to the non-agricultural data tonight.
sentiment indicator
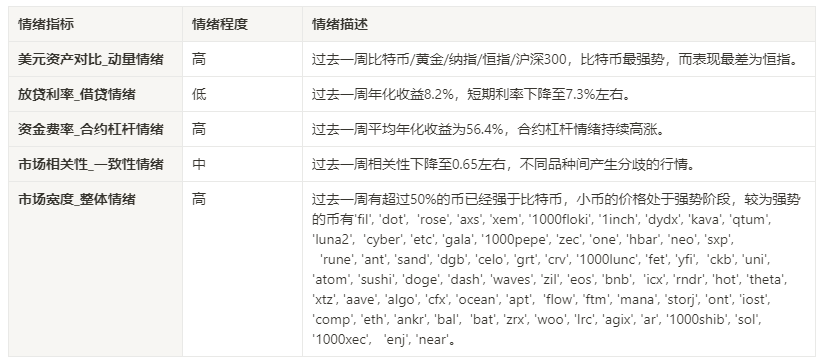
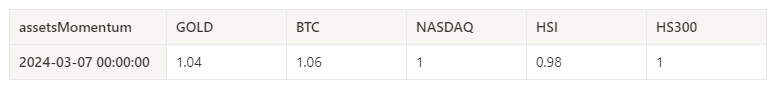
momentum sentiment
Among Bitcoin/Gold/Nasdaq/HSI/CSI 300 over the past week, Bitcoin was the strongest, while HSI was the worst performer.
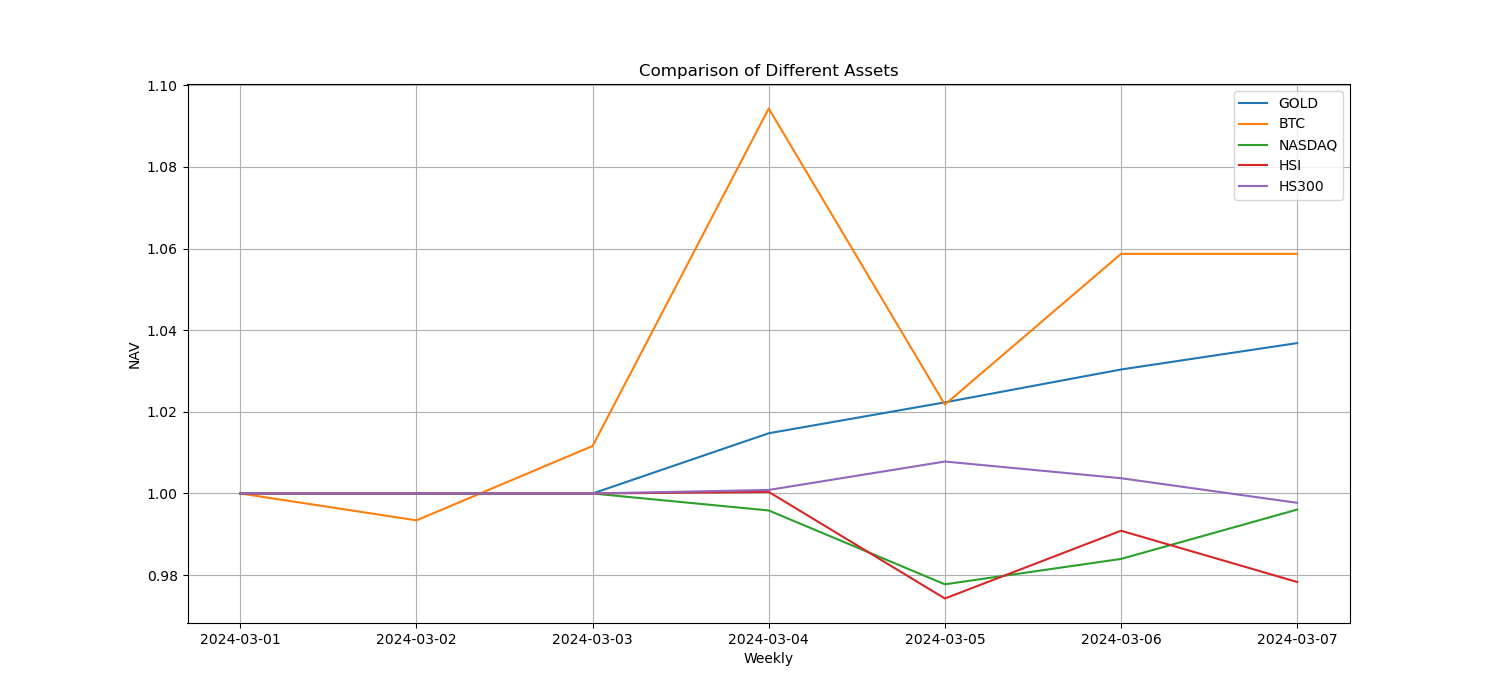
The picture above shows the trends of different assets over the past week.
Lending interest rate_Lending sentiment
The annualized return on USD lending averaged 8.2% over the past week, and short-term interest rates fell to around 7.3%.
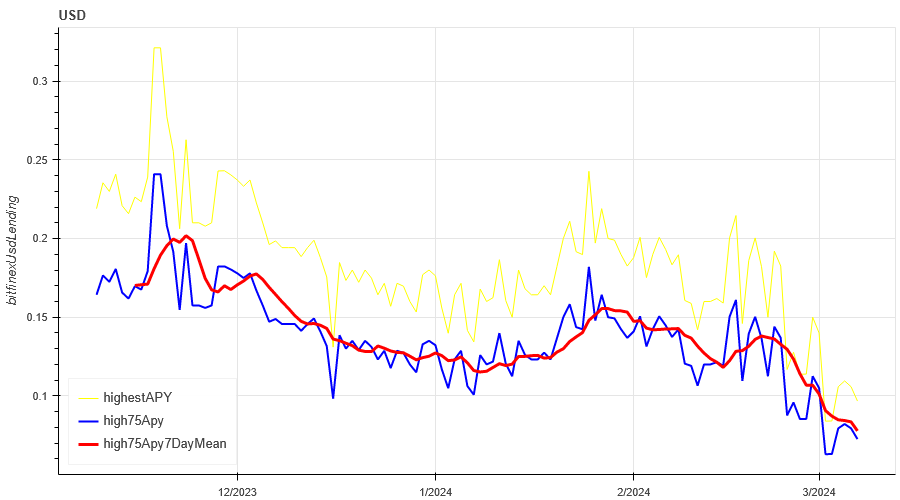
The yellow line is the highest price of the USD interest rate, the blue line is 75% of the highest price, and the red line is the 7-day average of 75% of the highest price
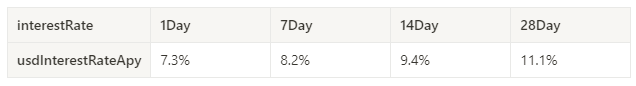
The table shows the average return of USD interest rate for different holding days in the past
Funding Rate_Contract Leverage Sentiment
The average annualized return on BTC tariffs in the past week was 56.4%, and contract leverage sentiment continues to rise.
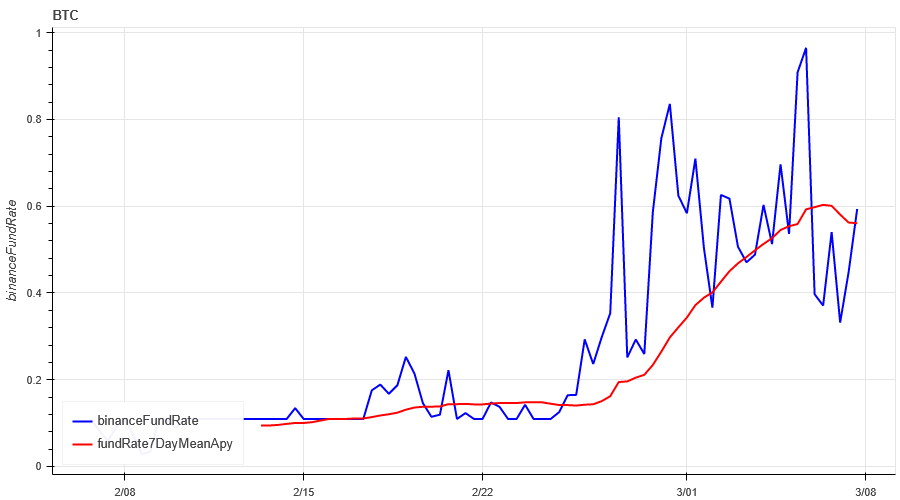
The blue line is the funding rate of BTC on Binance, and the red line is its 7-day average
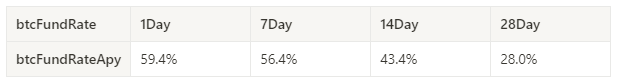
The table shows the average return of BTC fees for different holding days in the past
Market Correlation_Consistent Sentiment
Among the 129 coins selected in the past week, the correlation dropped to around 0.65, resulting in divergent prices among different varieties.
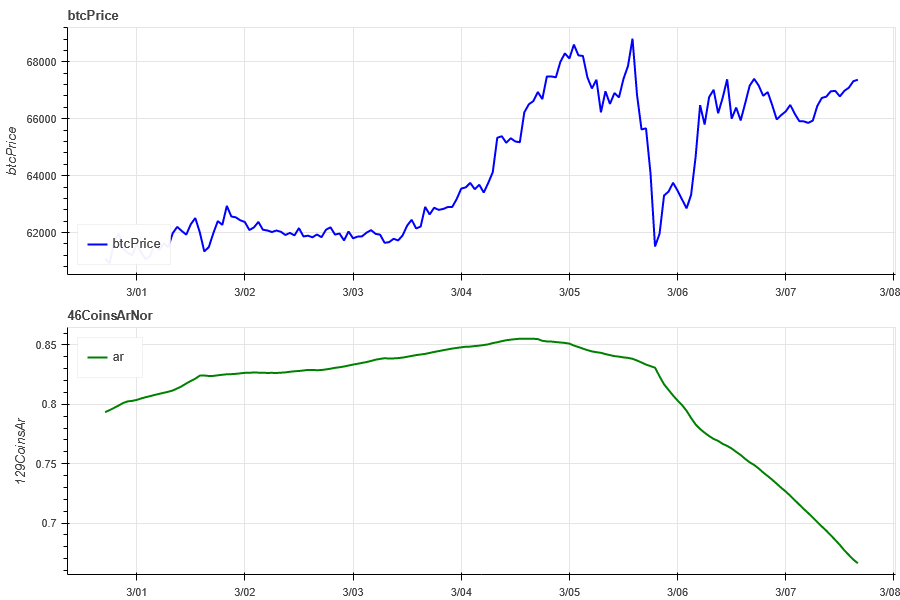
The blue line in the above picture first shows the Bitcoin price, and the green line is [1000 floki, 1000 lunc, 1000 pepe, 1000 shib, 100 0x ec, 1inch, aave, ada , agix, algo, ankr, ant, ape, apt, arb, ar, astr, atom, audio, avax, axs, bal, band, bat, bch, bigtime, blur, bnb, btc, celo, cfx, chz, ckb , comp, crv, cvx, cyber, dash, dgb, doge, dot, dydx, egld, enj, ens, eos,etc, eth, fet, fil, flow, ftm, fxs, gala, gmt, gmx, grt, hbar , hot, icp, icx, imx, inj, iost, iotx, jasmy, kava, klay, ksm, ldo, link, loom, lpt, lqty, lrc, ltc, luna 2, magic, mana, matic, meme, mina, mkr, near, neo, ocean, one, ont, op, pendle, qnt, qtum, rndr, rose, rune , rvn, sand, sei, sfp, skl, snx, sol, ssv, stg, storj, stx, sui, sushi, sxp, theta, tia, trx, t, uma, uni, vet, waves, wld, woo, xem , xlm, xmr, xrp, xtz, yfi, zec, zen, zil, zrx] overall correlation
Market Breadth_Overall Sentiment
Of the 129 coins selected in the past week, 95% had prices above the 30-day moving average, compared with 58% of BTC prices above the 30-day moving average, and 85% had prices greater than 20% from the lowest price in the past 30 days. , 90% are less than 10% from the highest price in the past 30 days. The market width indicator in the past week shows that the overall market continues to be in a strong upward stage, and more than 50% of coins have been stronger than Bitcoin in the past week. The prices of small coins In a strong stage.
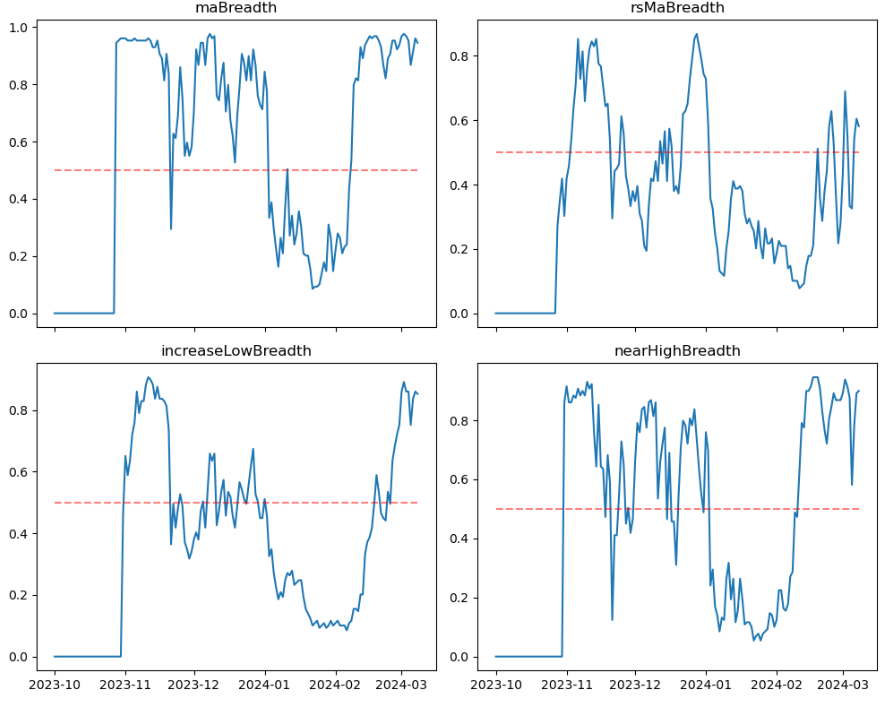
The picture above is [1000 floki, 1000 lunc, 1000 pepe, 1000 shib, 100 0x ec, 1inch, aave, ada, agix, algo, ankr, ant, ape, apt, arb, ar, astr, atom, audio, avax, axs, bal, band , bat, bch, bigtime, blur, bnb, btc, celo, cfx, chz, ckb, comp, crv, cvx, cyber, dash, dgb, doge, dot, dydx, egld, enj, ens, eos,etc, eth , fet, fil, flow, ftm, fxs, gala, gmt, gmx, grt, hbar, hot, icp, icx, imx, inj, iost, iotx, jasmy, kava, klay, ksm, ldo, link, loom, lpt , lqty, lrc, ltc, luna 2, magic, mana, matic, meme, mina, mkr, near, neo , ocean, one, ont, op, pendle, qnt, qtum, rndr, rose, rune, rvn, sand, sei, sfp, skl, snx, sol, ssv, stg, storj, stx, sui, sushi, sxp, theta , tia, trx, t, uma, uni, vet, waves, wld, woo, xem, xlm, xmr, xrp, xtz, yfi, zec, zen, zil, zrx] The proportion of each width indicator on the 30th day
Summarize
In this weeks market, the prices of Bitcoin (BTC) and Ethereum (ETH) both rose to highs and then fell sharply, triggering a large number of liquidation transactions, and then rose back to highs. This resulted in the markets greatest volatility and volume during the pullback after approaching new highs on March 5. In terms of open interest, Bitcoin was little changed, while Ethereum’s open interest continued to decline. The implied volatility of mainstream currencies has declined slightly after continuing to rise, but it has still hit a new high in the past six months, indicating that the market is still in an upward trend with high volatility. In addition, funding rates continue to rise, indicating that contract trading sentiment remains high. Binance’s market breadth indicator shows that the overall market continues to be in a strong upward phase. More than 50% of currencies have performed better than Bitcoin in the past week, indicating that the prices of small currencies have entered a strong phase. In terms of events, there has been no major data release in the past week, but it is worth paying attention to the non-agricultural data that will be released tonight, which may have an impact on the market. Investors should pay close attention to market dynamics and carefully adjust their investment allocations.
Twitter: @DerivativesCN
Website: https://dcbot.ai/


