
Glassnode: 2023 Annual On-Chain Data Review
Original title: 2023 Yearly On-chain Review 》
Original author:Checkmate, Glassnode
Original compilation: Elvin, ChainCatcher
Summary
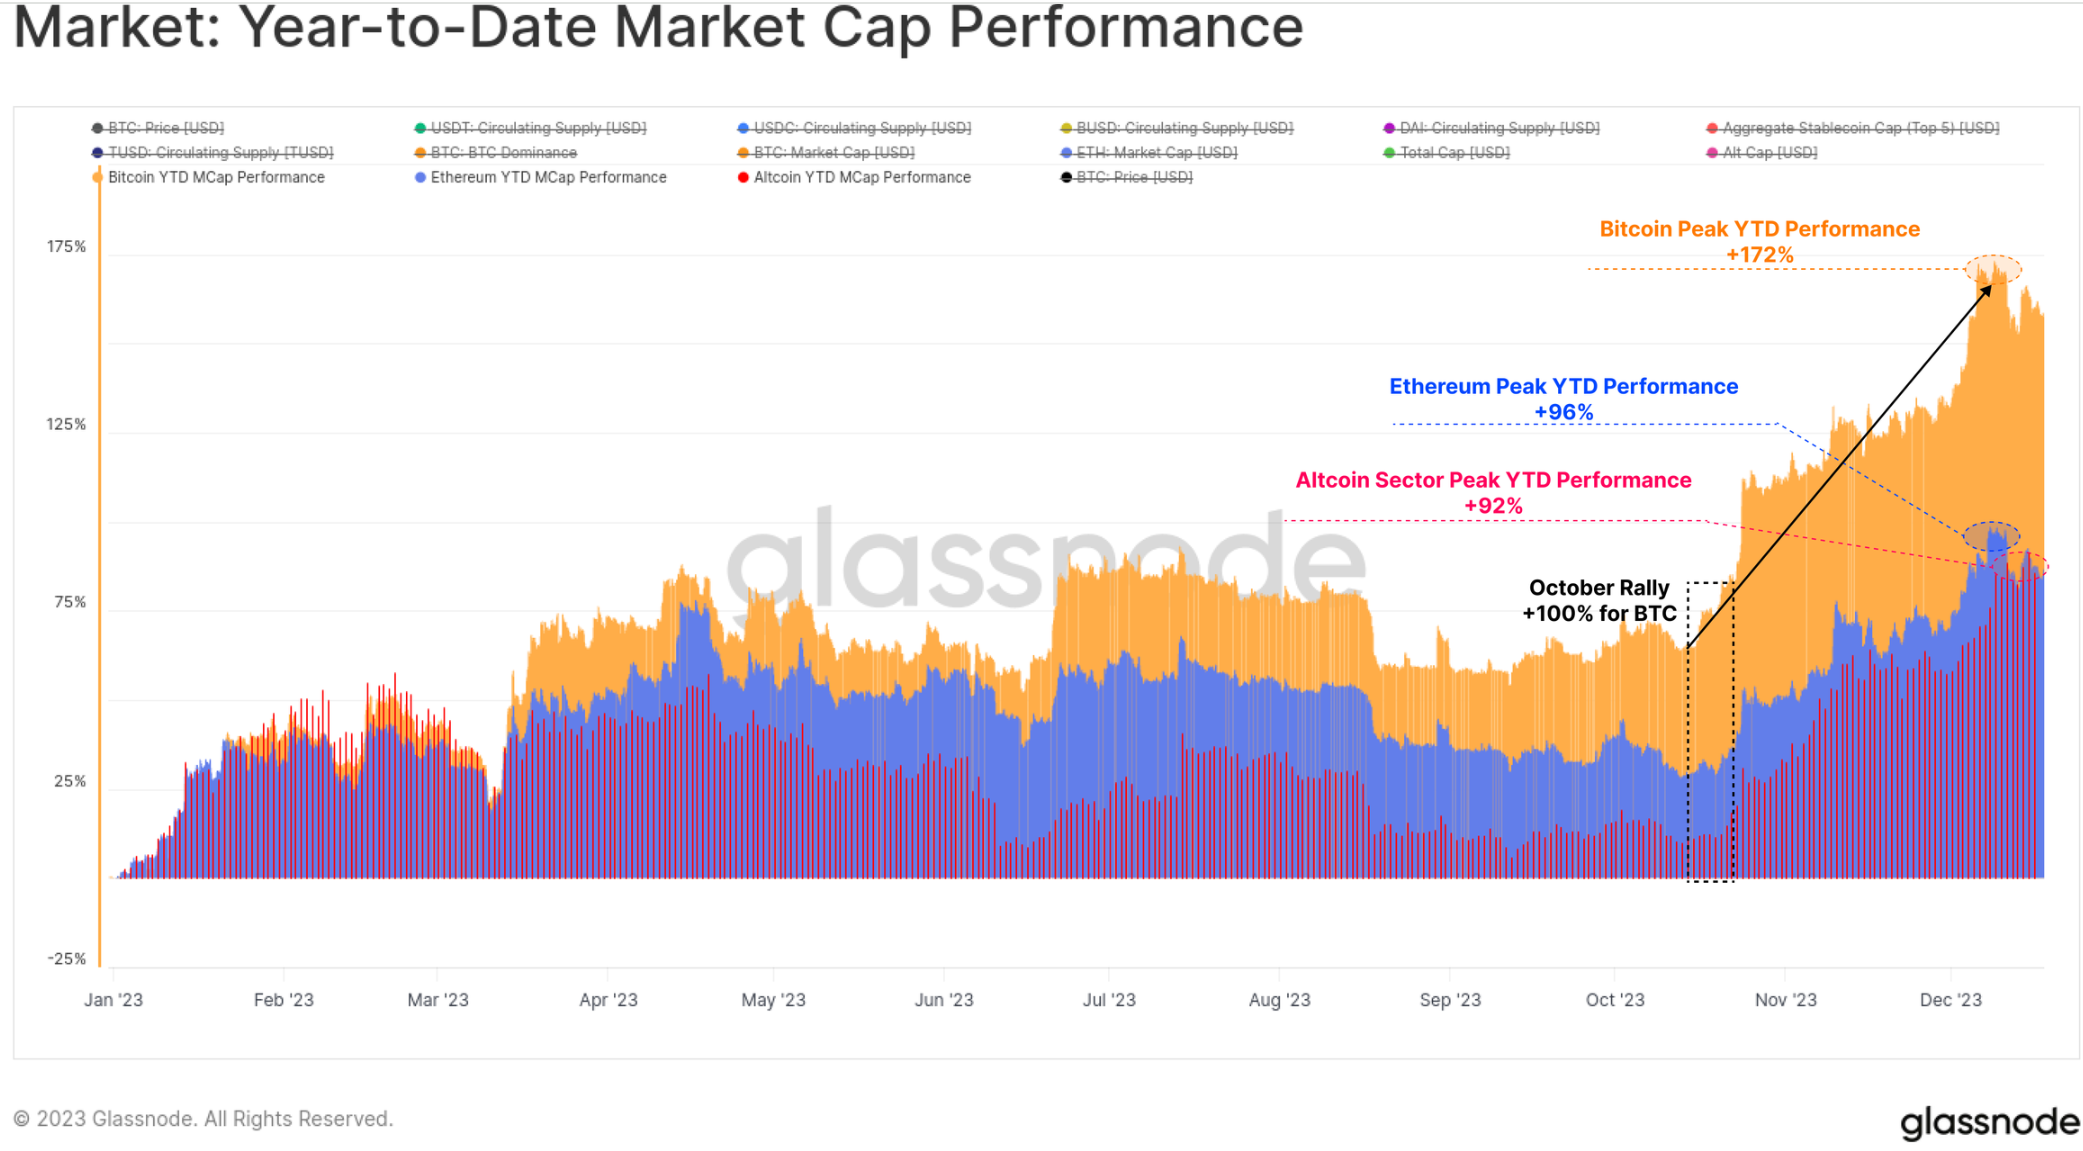
1. 2023 is an incredible year for digital assets. Bitcoin has risen by more than 172%, with a maximum correction of less than 20%. Net capital has flowed into BTC, ETH and stablecoins.
2. The market has broken through several important technical nodes and on-chain pricing models this year, and October is the main pivot point for institutional capital flows.
3. Currently, the supply of Bitcoin held by long-term holders is almost at an all-time high, and the vast majority of Bitcoins are now profitable.
4. The market structure is undergoing major changes, such as Tether re-establishing the dominance of stablecoins, CME futures subverting Binance, and the significant growth of the options market.
In our final installment of the year, we’ll be taking a whirlwind tour of the changes happening on-chain this year. We’ll explore how the Bitcoin, Ethereum, derivatives, and stablecoin landscape evolves in 2023, and how this sets the stage for an exciting future.
2023 has been an extraordinary year for digital assets, with Bitcoins market value increasing by a peak of 172%. The rest of the digital asset ecosystem also had a strong year, with Ethereum and the broader altcoin space growing by more than 90% in market capitalization.
This highlights Bitcoin’s rising dominance, which is often seen as a time when markets are recovering from a prolonged bear market such as 2021-22. Ethereum in particular, despite the successful launch of the Shanghai upgrade and the development of the L2 ecosystem, got off to a relatively slow start, with the ETH/BTC ratio falling to multi-year lows around 0.052.
While digital assets have significantly outperformed traditional assets such as stocks, bonds and precious metals throughout the year, the rebound since late October accounted for most of the gains. First it broke the psychologically important price mark of $30,000, as well as many other important price marks.
The correction is very small
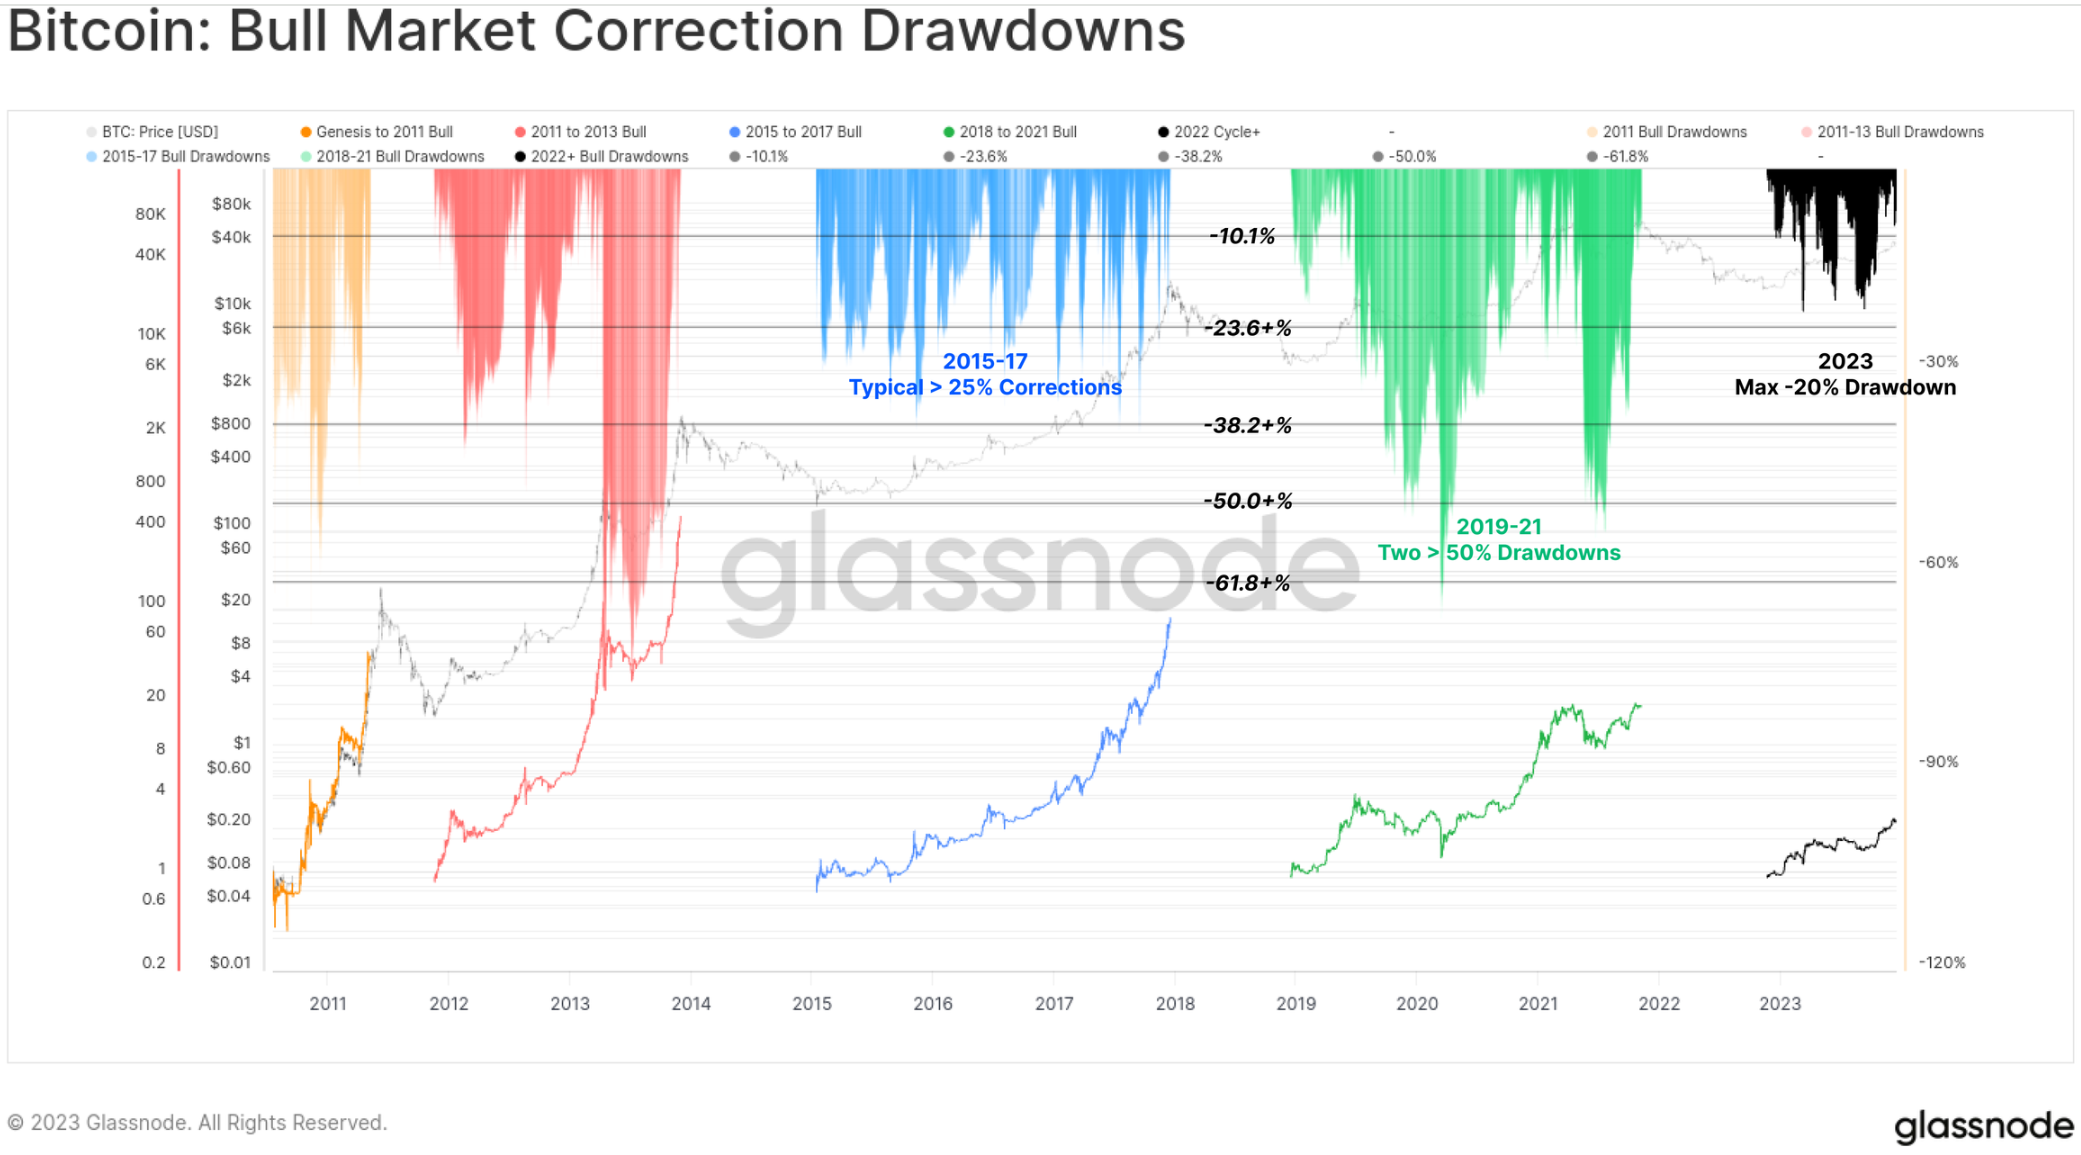
One of the striking features of the 2023 market is the very shallow depth of all price pullbacks and corrections. Historically, BTC’s bear market recoveries and bull market uptrends have typically seen retracements of at least -25% from local highs, with many examples exceeding -50%.
However, the deepest pullback in 2023 closed just -20% below the local high, suggesting buyer support and that the overall supply-demand balance has been favorable throughout the year.
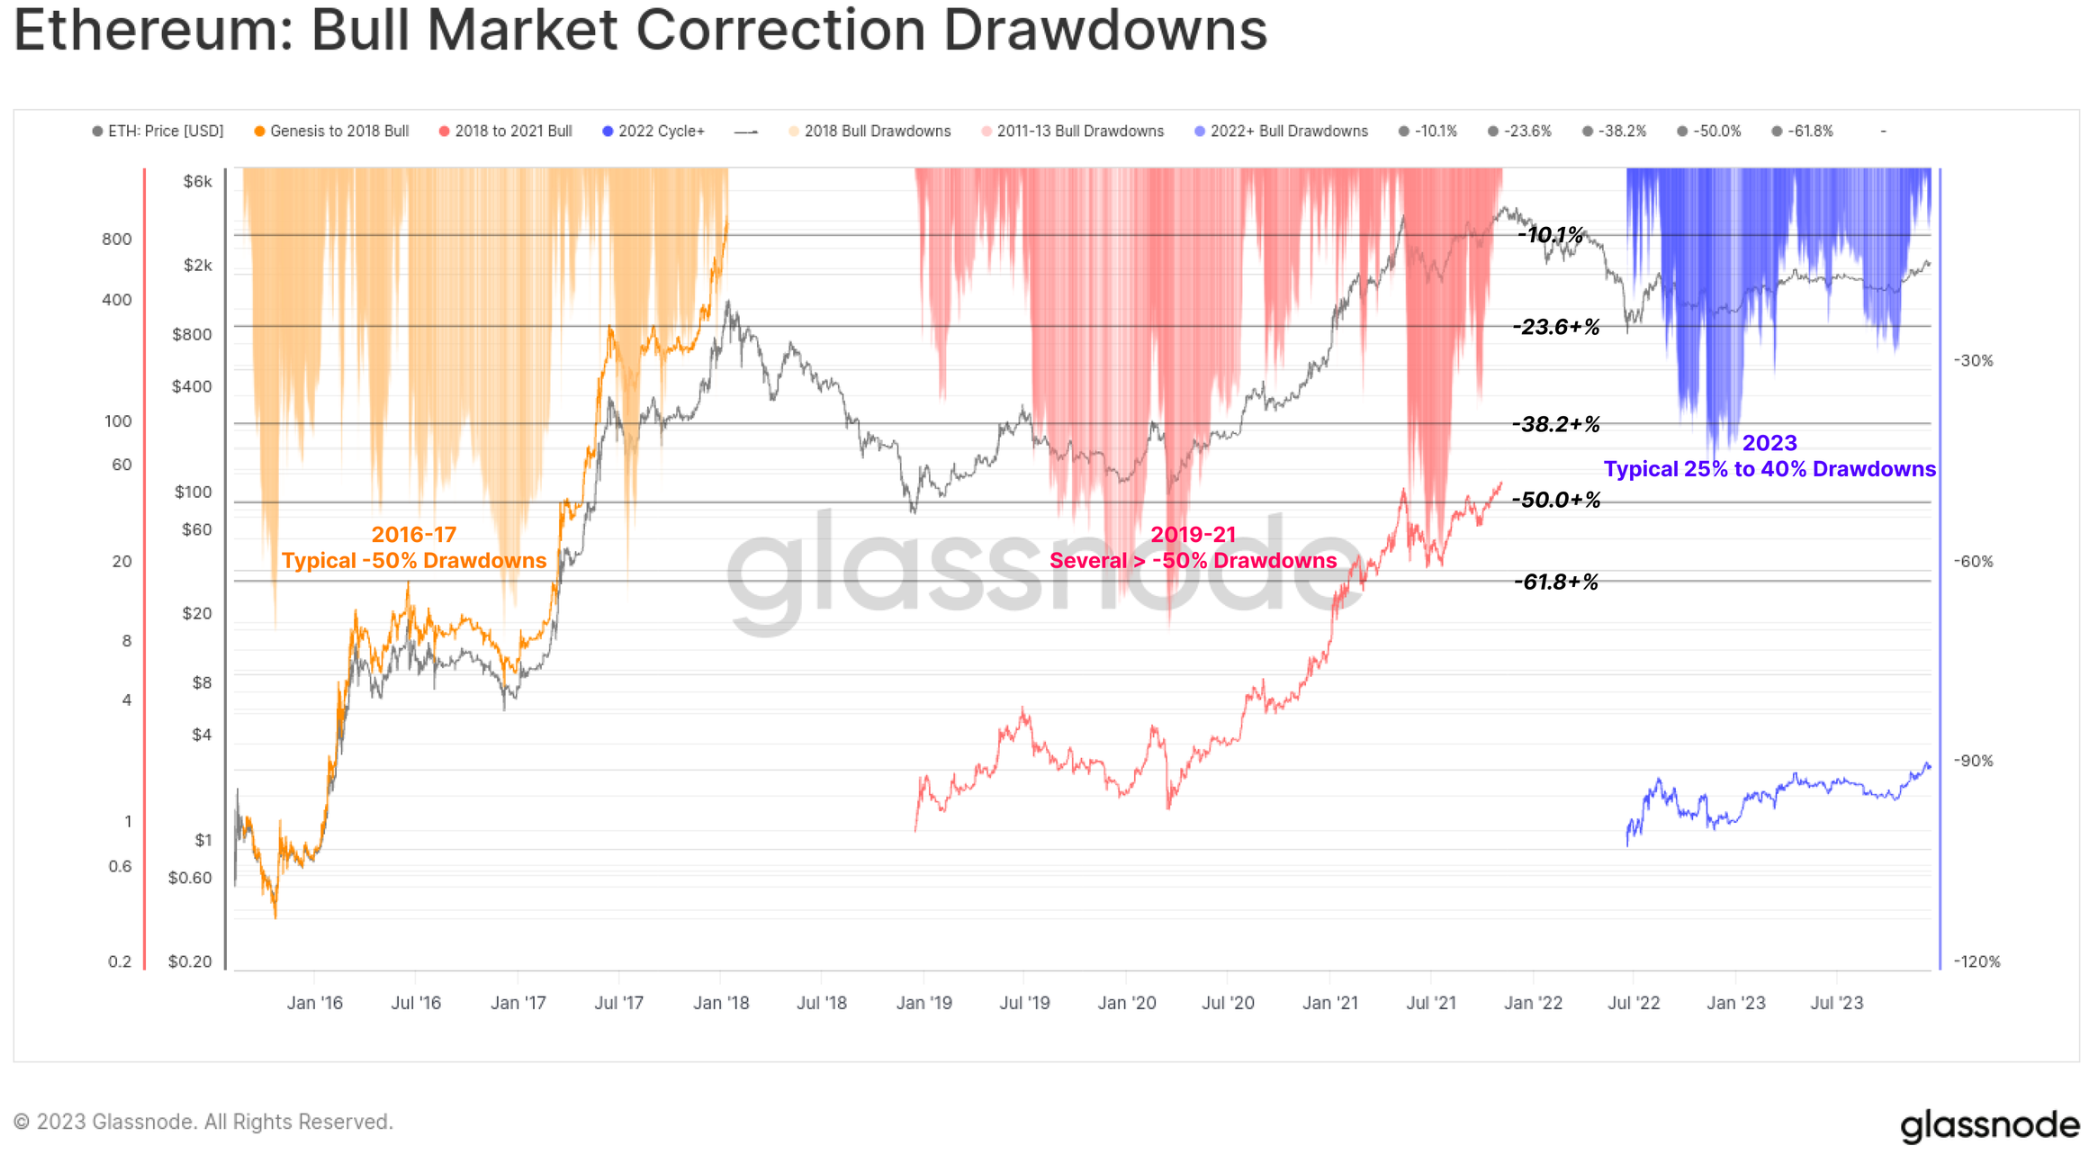
The magnitude of Ethereums correction is also relatively latent, with the deepest adjustment reaching -40% in early January. Although the performance is weaker relative to BTC, it also paints a constructive backdrop that the reduction in supply caused by the merger is meeting relatively elastic demand.
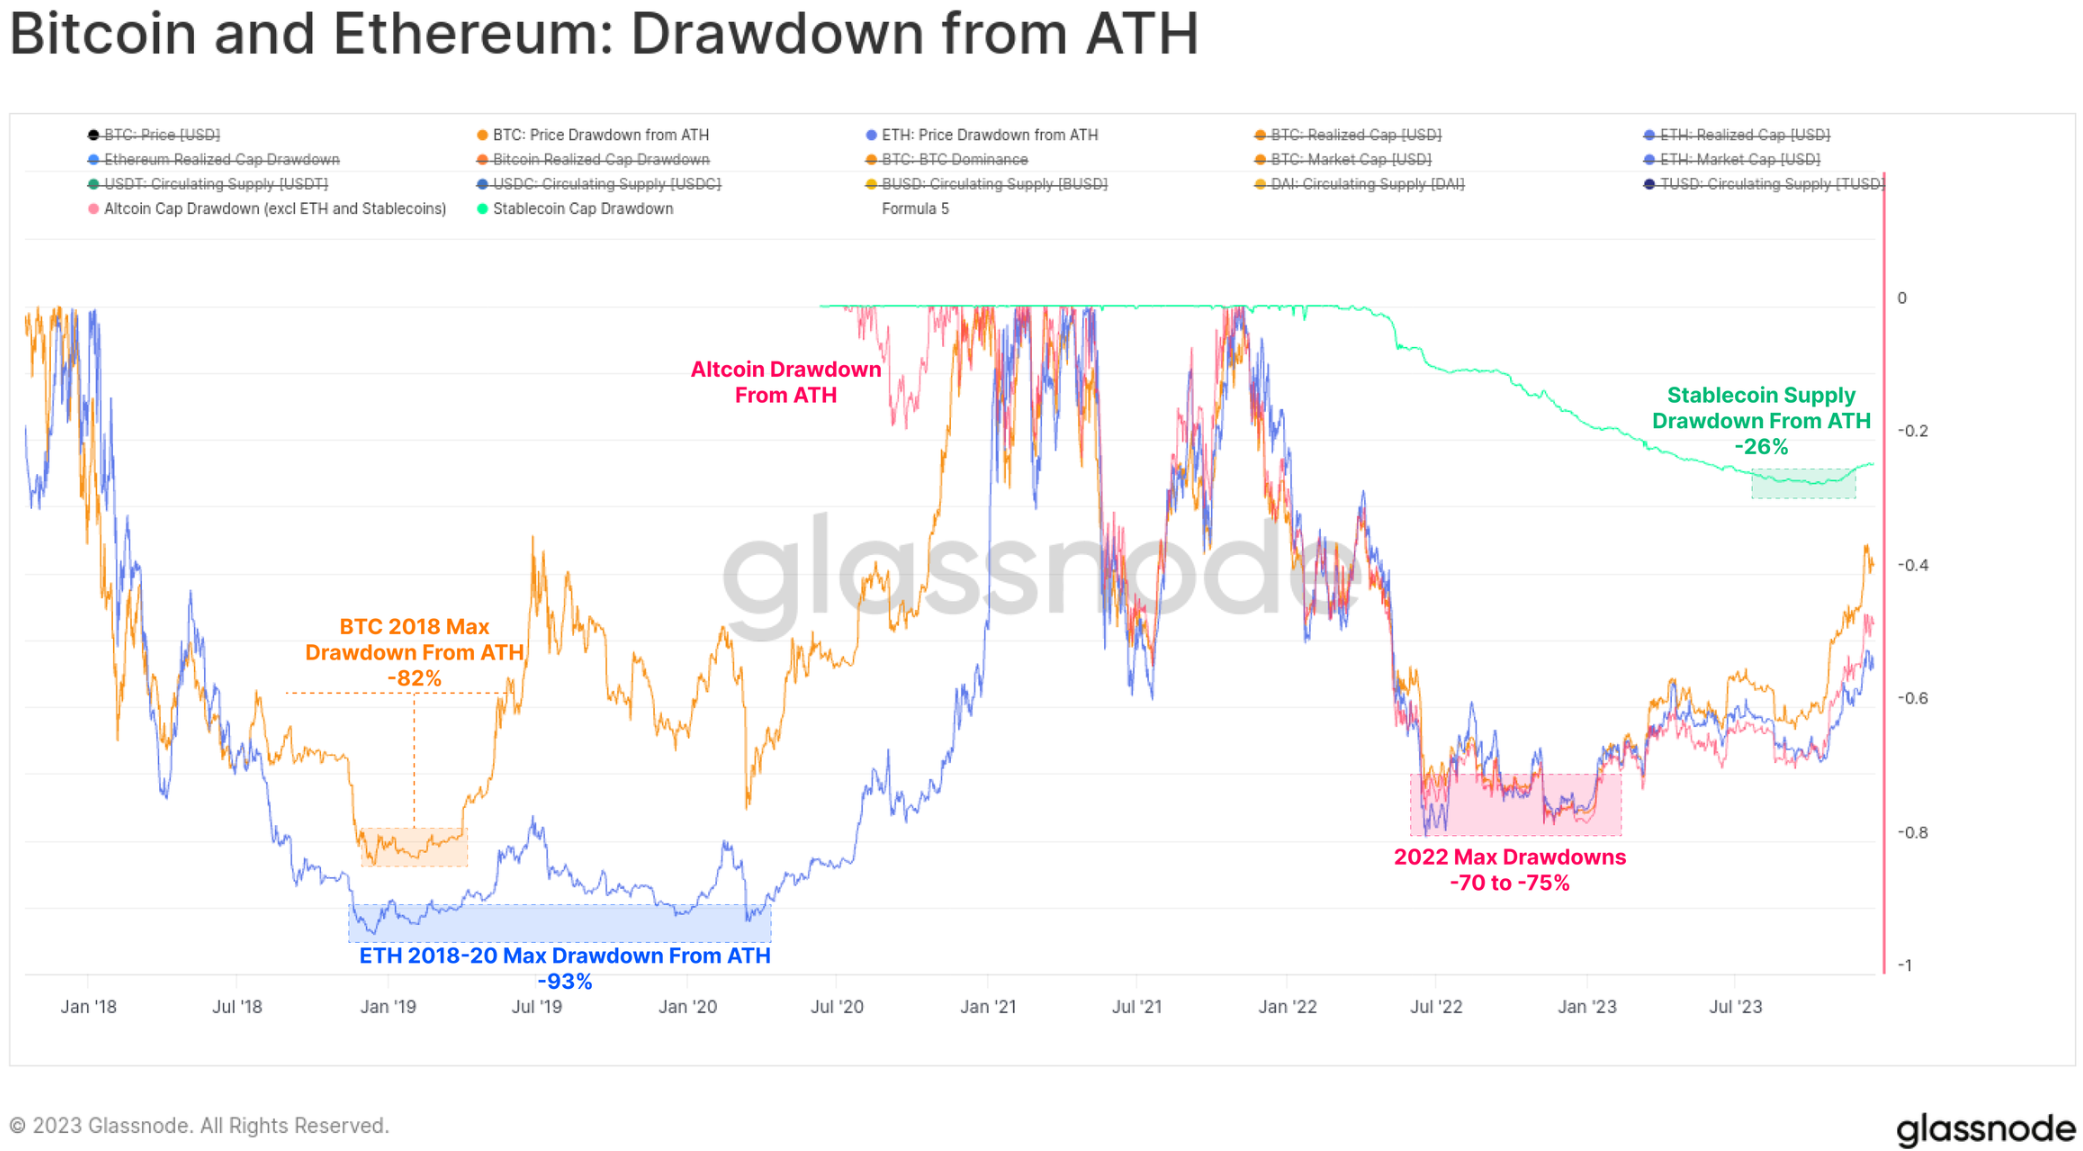
The 2022 bear market will be slightly less brutal than the 2018-20 bear market cycle, with most major digital assets starting in 2023 down -75% from ATH (all-time high). Strong performance since the lows has recouped much of the losses. The main asset currently lags behind its ATH -40% (BTC), -55% (ETH), -51% (altcoins, excluding ETH and stablecoins), and stablecoin supply (-24%).
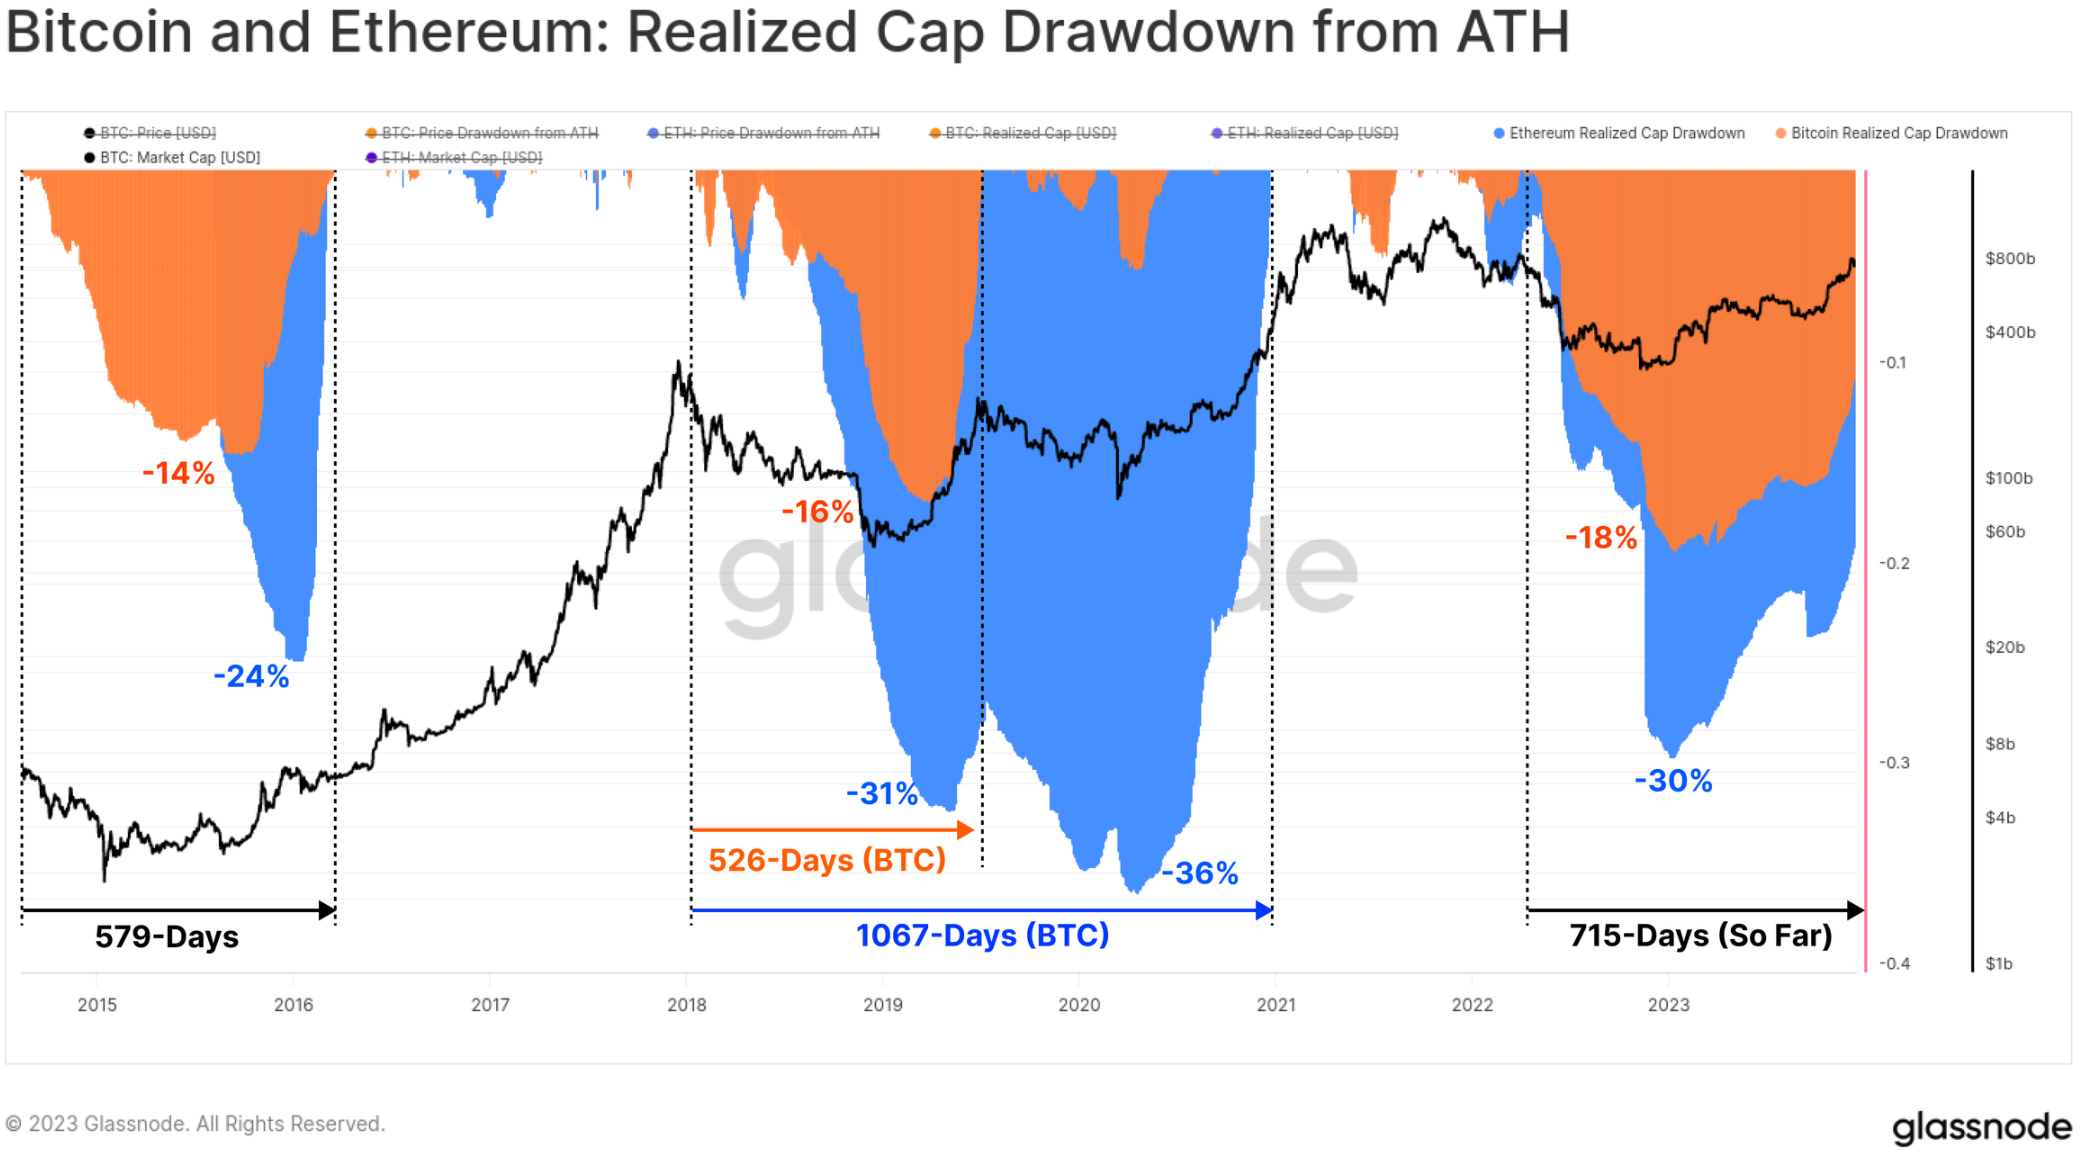
From an on-chain perspective, the Realized Cap of BTC and ETH provides an excellent tool to track the resumption of capital flows for the respective assets. The total realized market capitalization decline during the 2022 bear market reached similar levels to previous cycles, reflecting net capital outflows of -18% for BTC and -30% for ETH.
However, capital inflows have been much slower to recover, with Bitcoin’s realized market cap ATerH reaching over 100% 715 days ago. By comparison, in the previous cycle, full recovery of Realized Cap took approximately 550 days.
From an on-chain perspective, the realized caps for BTC and ETH provide an excellent tool to track the recovery of capital flows for the respective assets. The total realized cap drawdown during the 2022 bear market reached similar levels to previous cycles, reflecting net capital outflows of -18% for BTC and -30% for ETH. However, capital inflows have been much slower to recover, with Bitcoin achieving a cap of over 100% ATerH 715 days ago. By comparison, in the previous cycle, it took approximately 550 days to achieve full recovery of the cap.
Breaking through the $30,000 resistance level
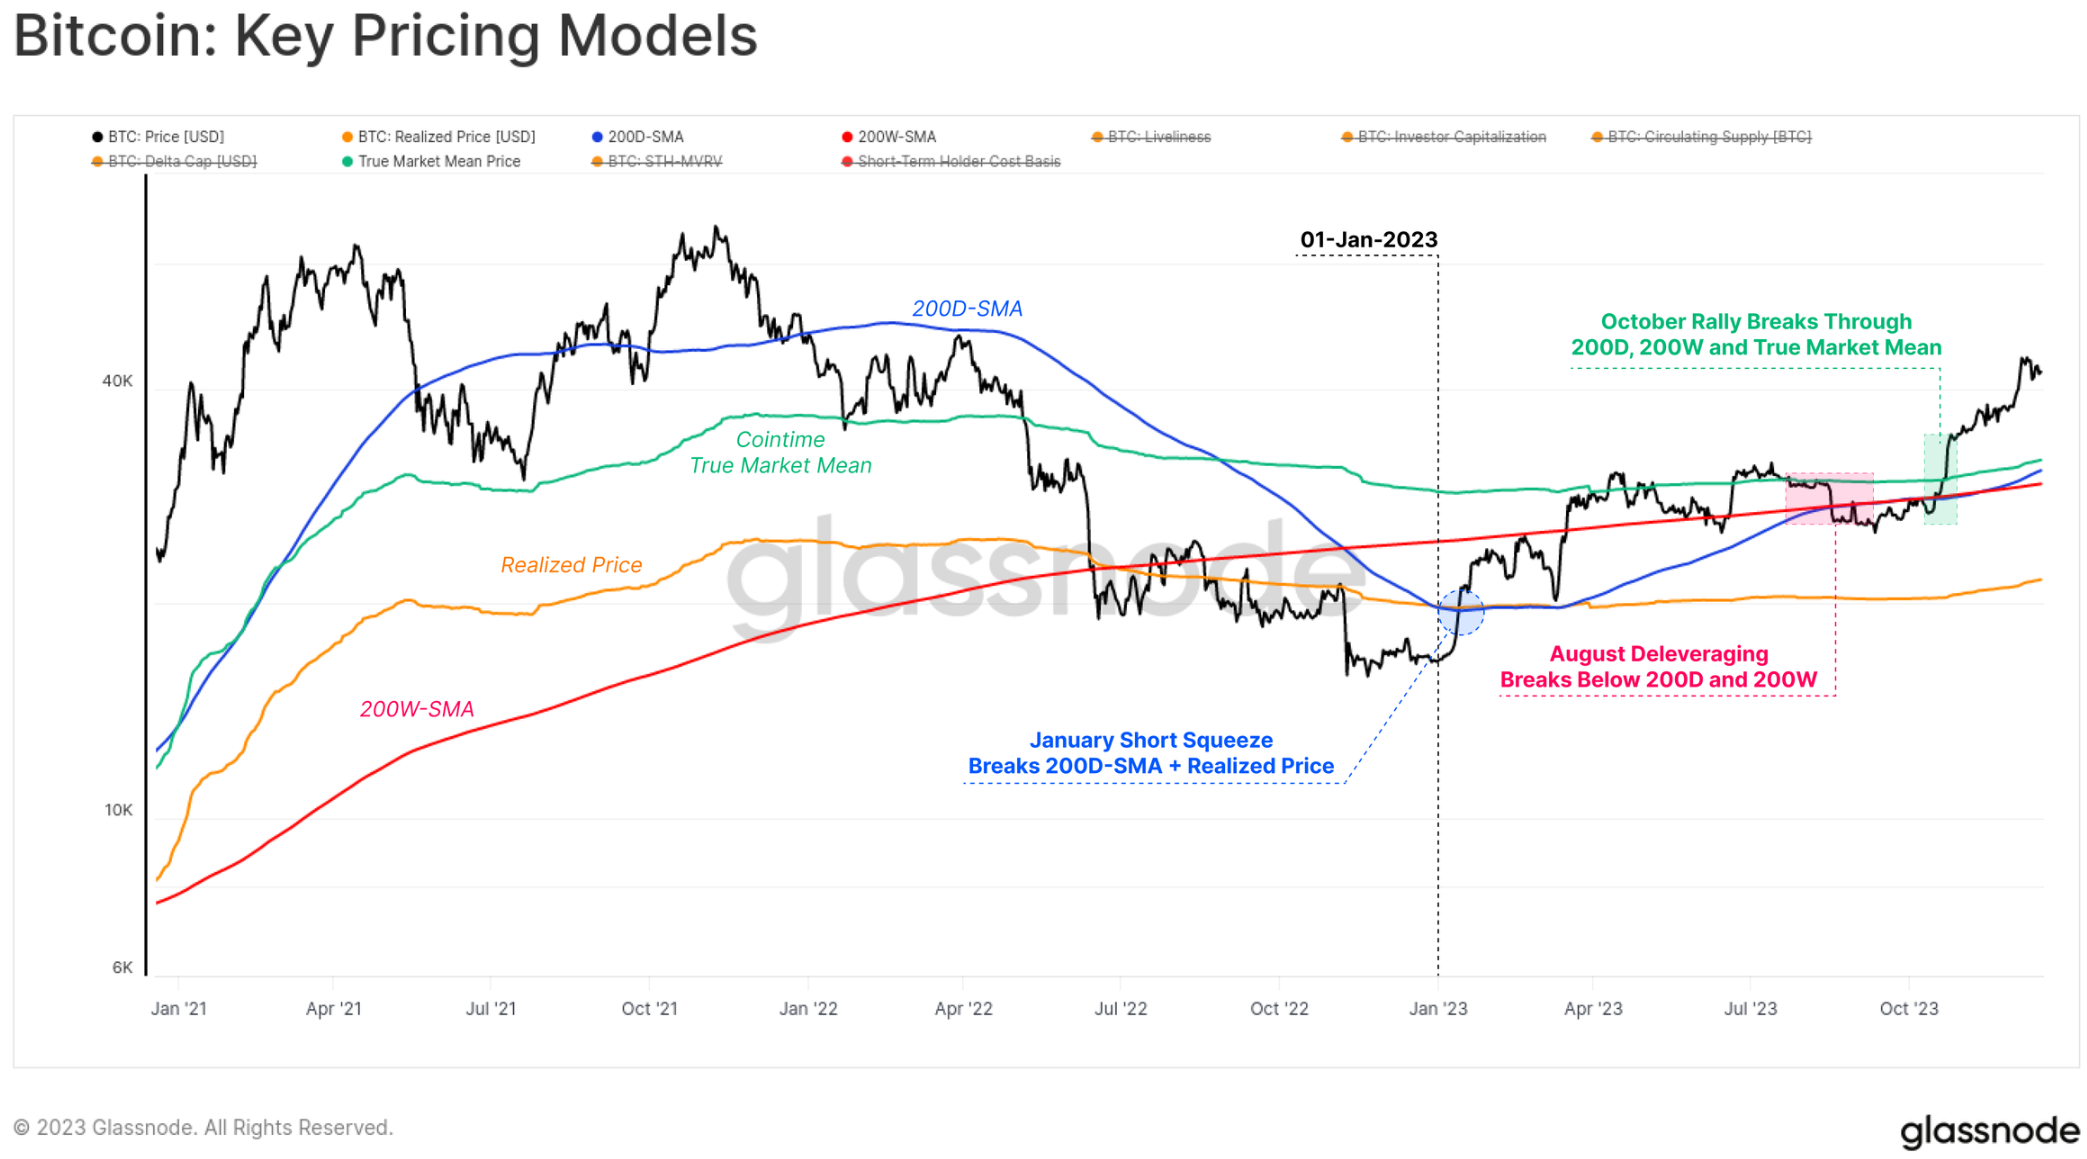
This year, the Bitcoin market has broken through numerous technology nodes and on-chain pricing models, all of which help us understand how strong its performance is.
The year began with a short squeeze in January that pushed the market above the Realized Price 🟠 which has effectively capped prices since June 2022. This rise also broke above the 200 D-SMA 🔵 until it encountered resistance at the 200 W-SMA 🔴 in March.
Until August, Bitcoin price continued to consolidate between the 200 D-SMA 🔵 and the real market average price 🟢, entering one of the least volatile periods in Bitcoin history (see WoC-32 and WoC-33). Soon after, a rapid deleveraging event took the price from $29,000 to $26,000 in a single day and below the two long-term technical price averages mentioned above.
The October rally was a real game changer, with all remaining price models recovering and breaking through the key psychological $30,000 mark. Bitcoin has since reached a yearly high of $44,500 and is consolidating around $42,000 at the time of writing.
A common theme readers may notice throughout this article is how capital flows, market momentum and performance have accelerated since the end of October. In WoC-49, we explored how this relates to BTC price breaking through the $30,000 level, which we described as a transition from an uncertain recovery phase to an enthusiastic uptrend.
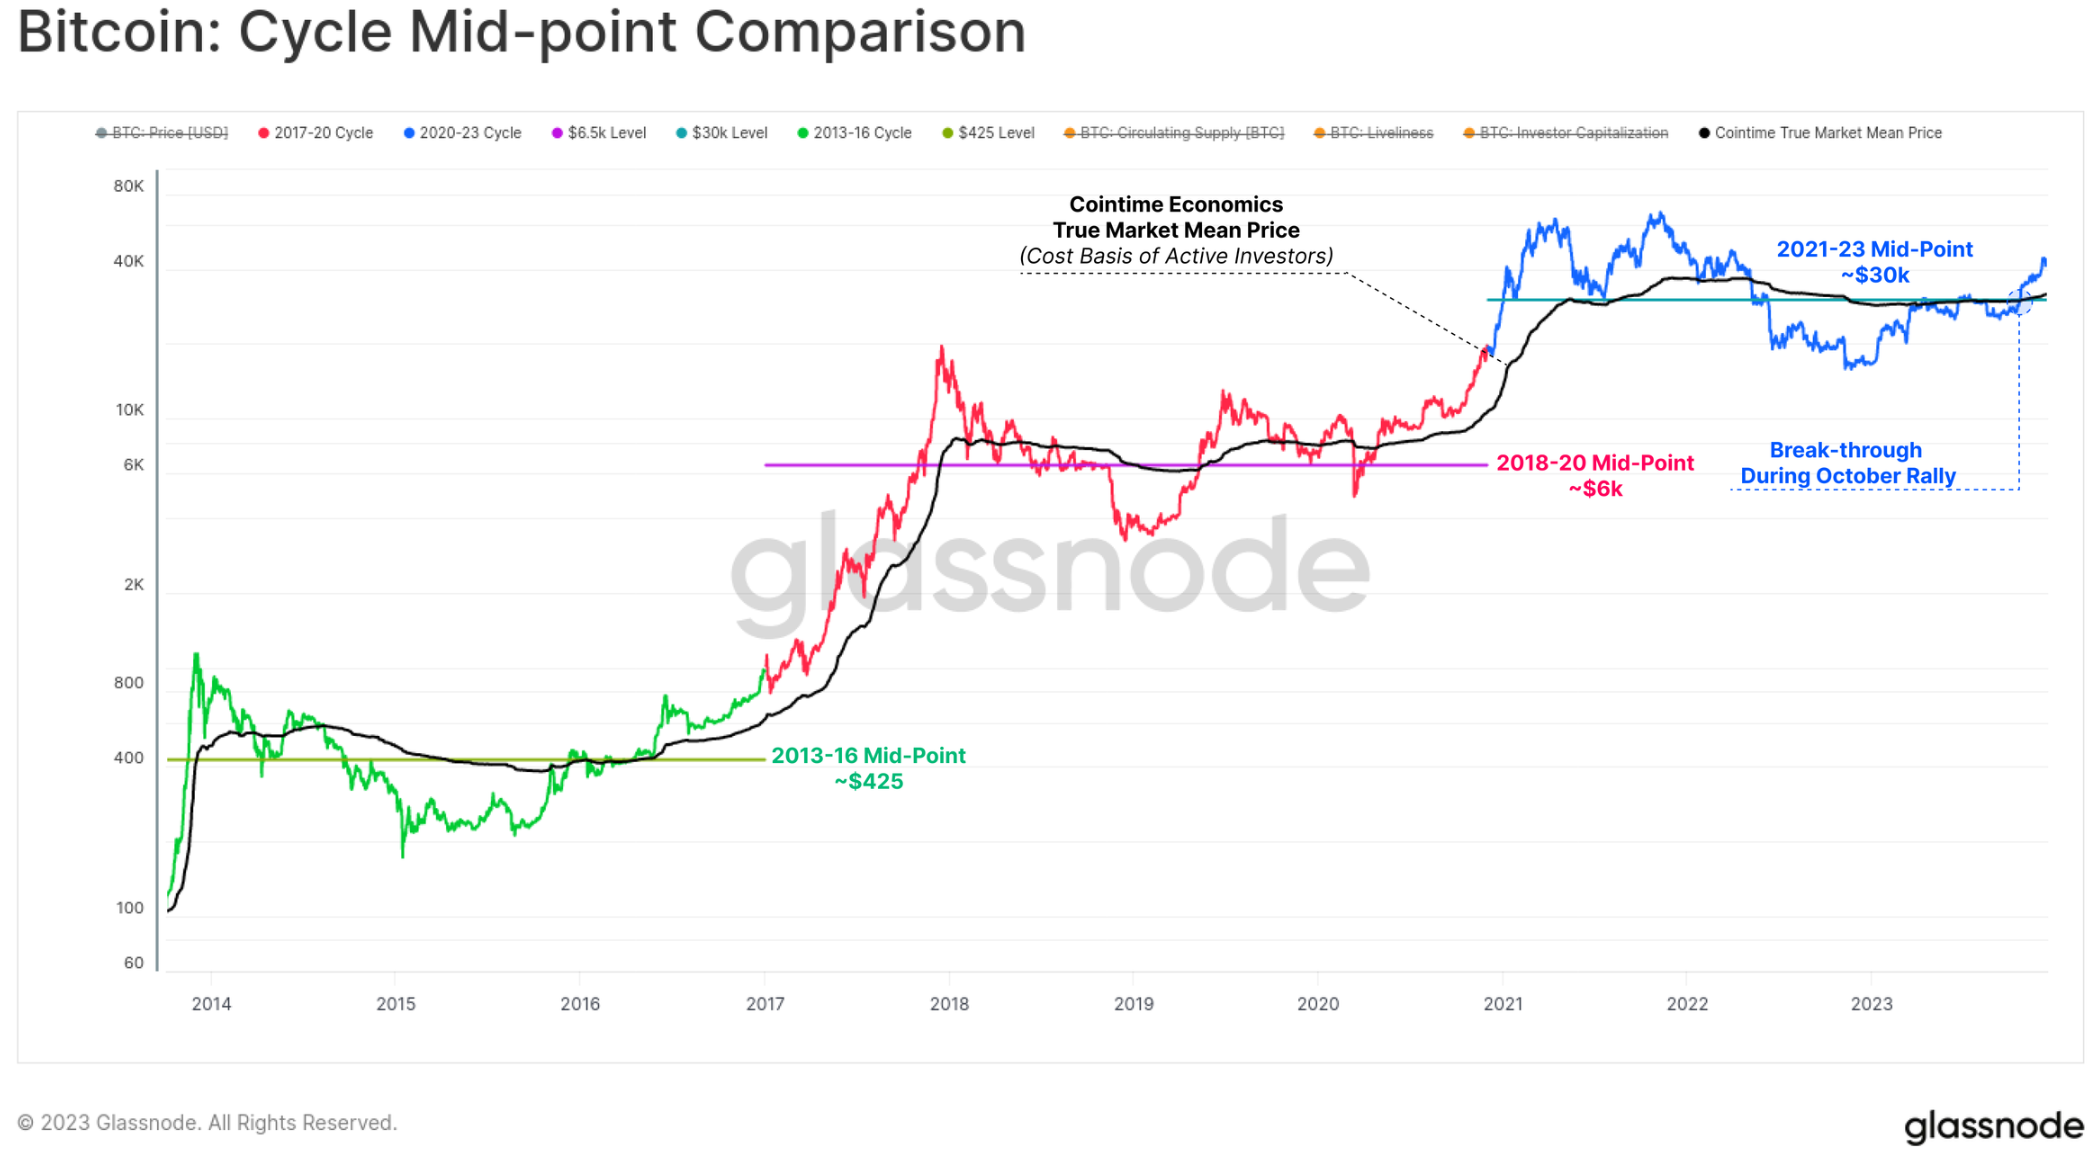
Notably, October’s rally broke through two important levels that had charted this shift in previous cycles:
1. Technology market midpoint:A broad range of price levels that act as support early in a bear market and as resistance later in a bear market. During this cycle, $30,000 was the last major support area before a series of capitulatory sell-offs that ultimately caused FTX to collapse.
2. Cointime real market average price:Reflects the cost basis of active investors. This model was developed in our Cointime Economics research in partnership with ARK Invest.
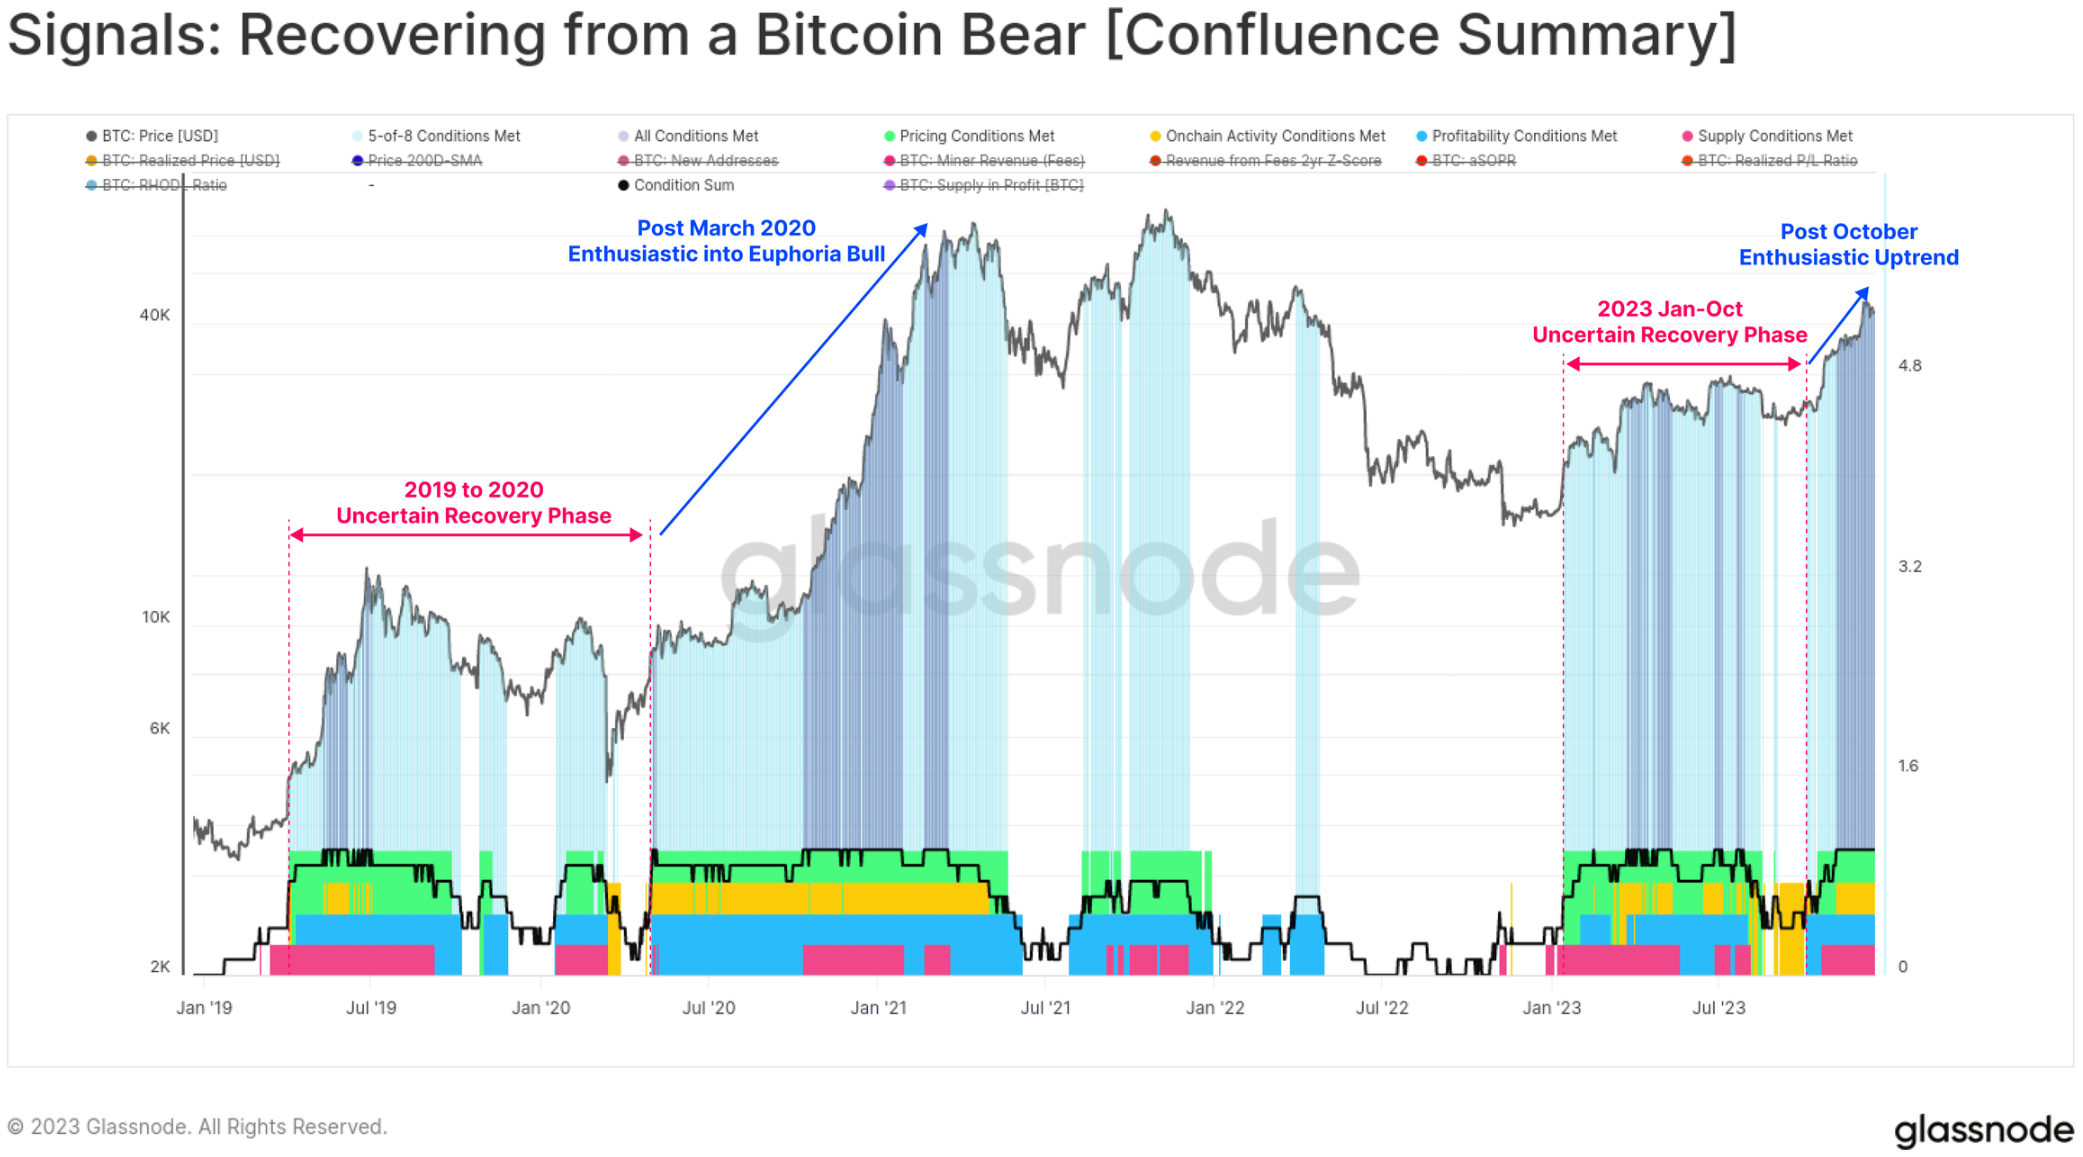
We can also see a significant change in the characteristics of the recovery from Bitcoin’s bear market signals, as all eight indicators have entered positive territory since October. Readings have been mixed throughout much of 2023, showing very similar characteristics to the 2019-20 period.
With all eight indicators now activated, this suggests that the market has entered positive territory typically associated with a resilient uptrend across multiple indicators and areas of the Bitcoin market structure.
Increases in quantity, cost and inscriptions
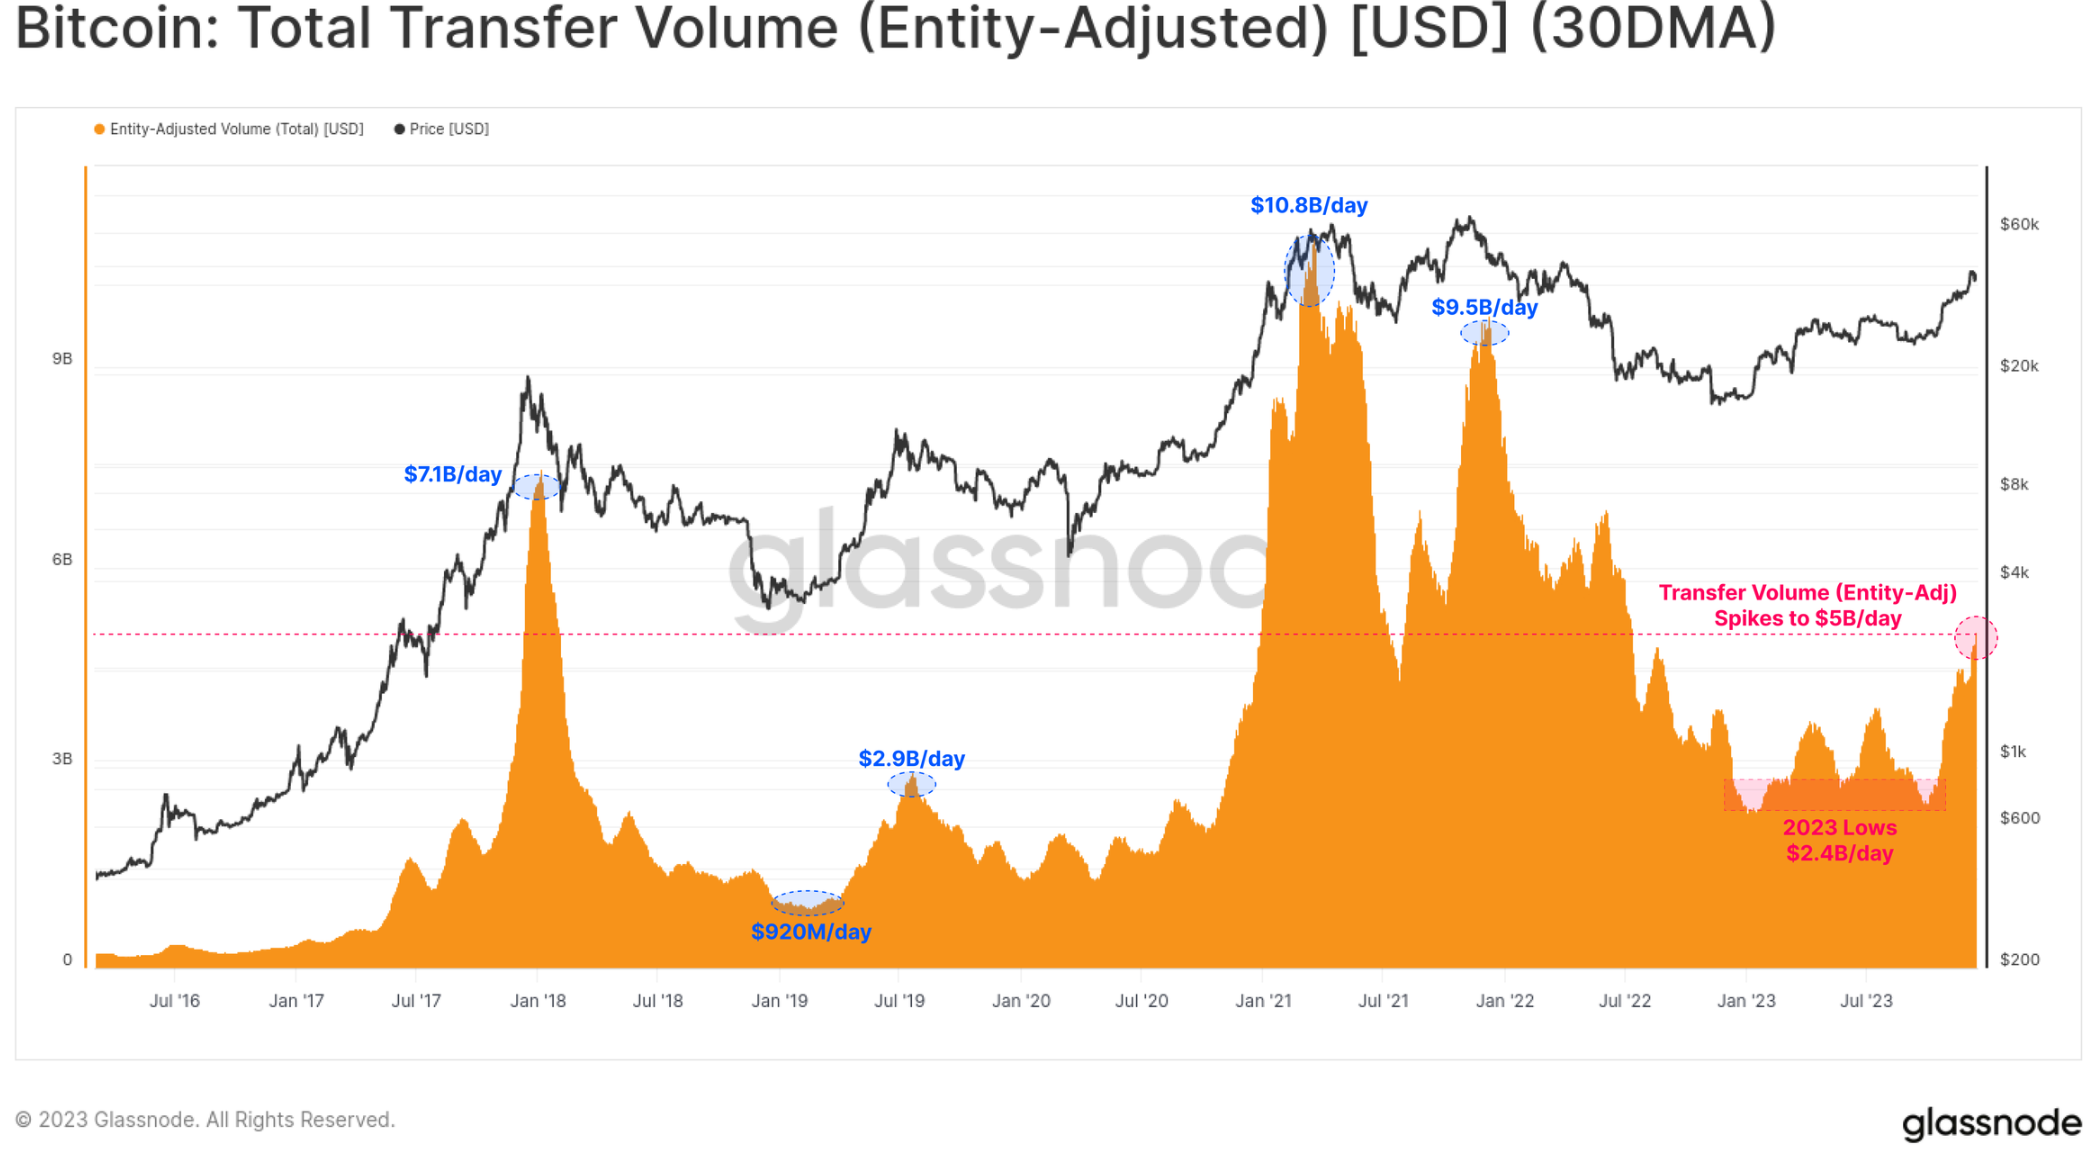
We can see that before this, Bitcoin’s trading volume was relatively stagnant, which supports the idea that October is to some extent a market phase change. The rise in October saw Bitcoin transfer volume double from $2.4B per day to over $5.0B per day, the highest level since June 2022.
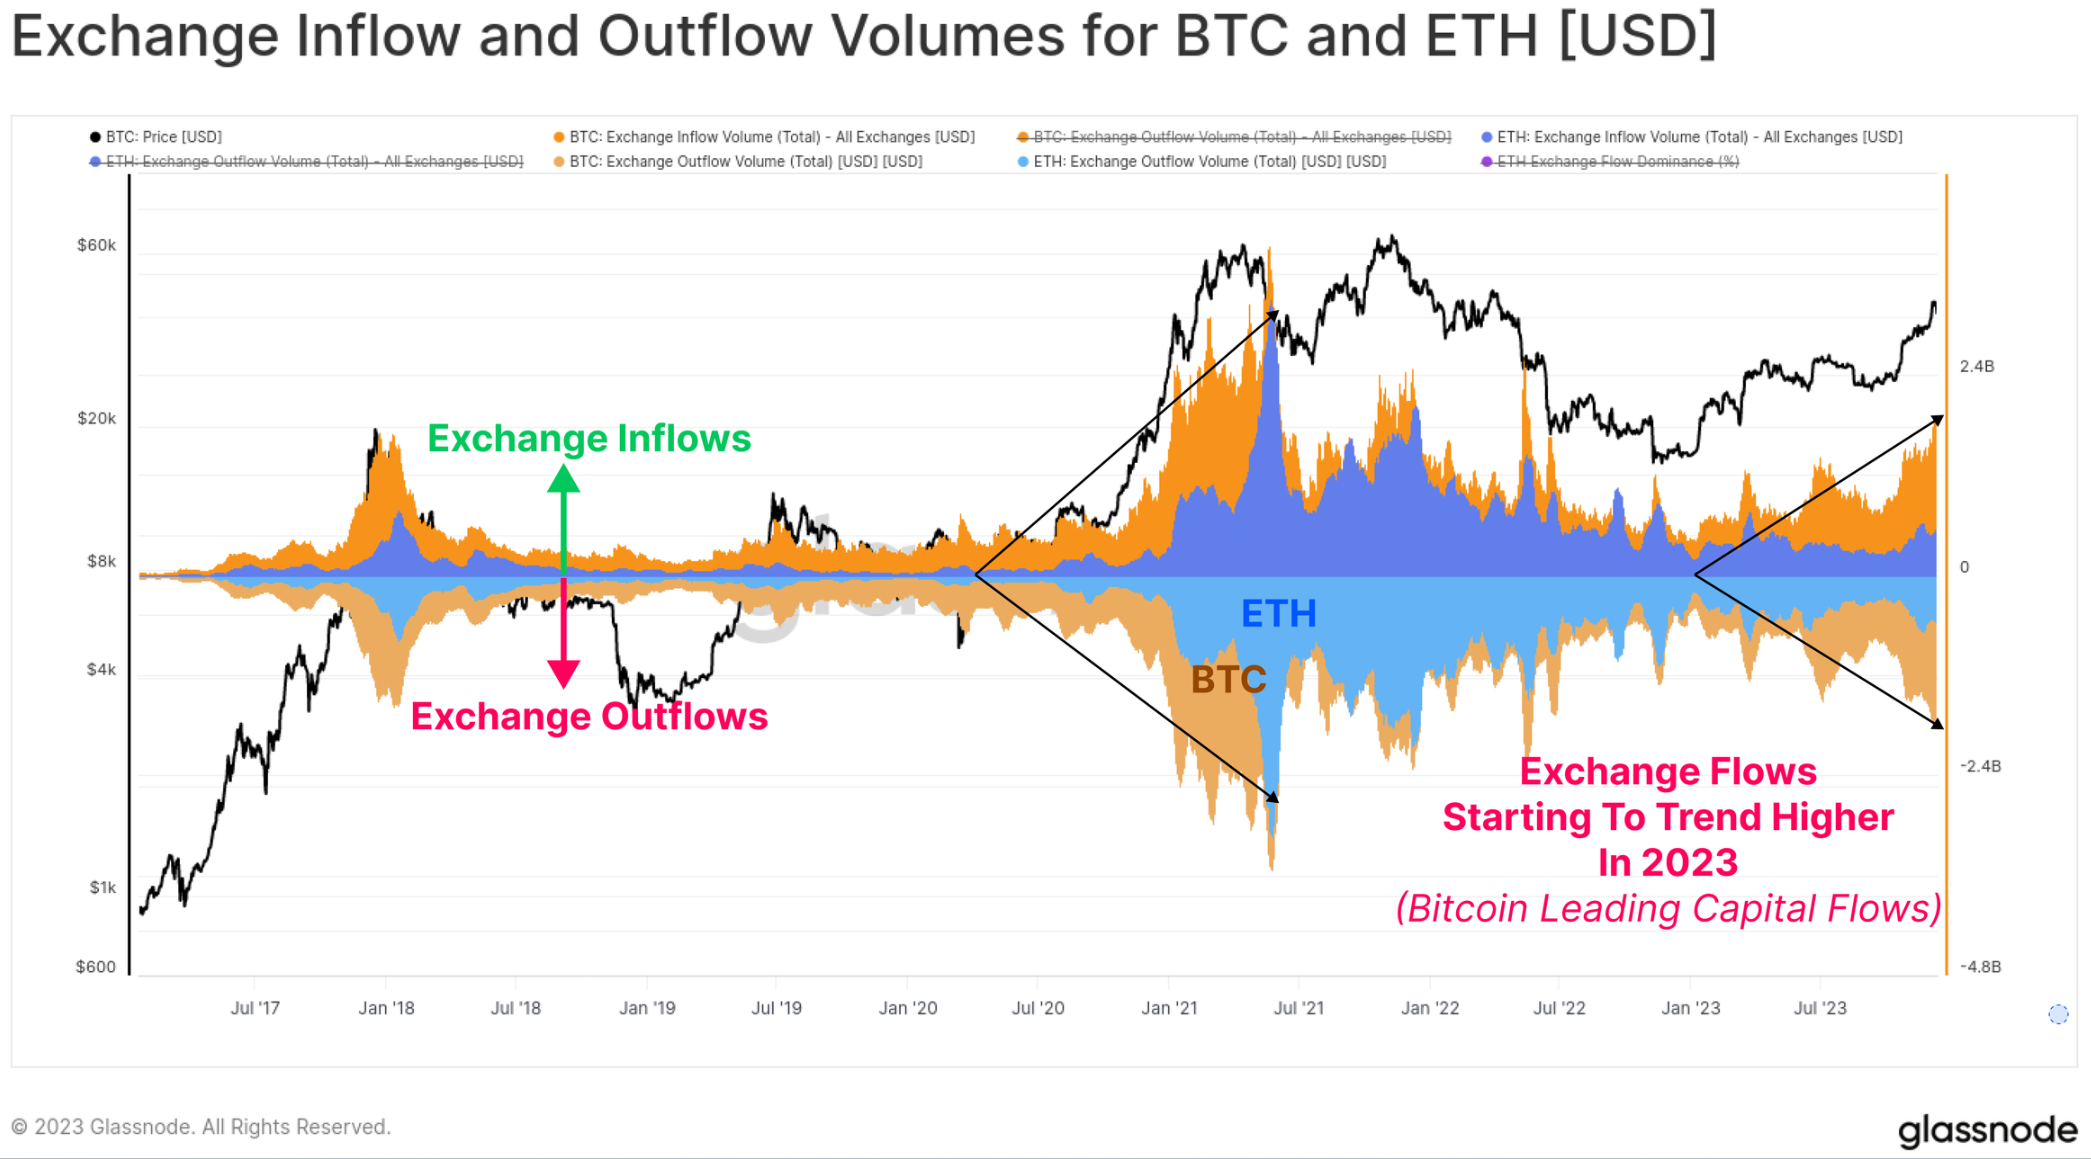
We can also see an increase in exchange inflows and outflows for BTC and ETH throughout the year, indicating a general expansion in spot trading interest. Notably, BTC trading volume is growing significantly faster than ETH trading volume, which is consistent with observations of Bitcoin’s rising dominance. It’s common for Bitcoin to lead the way out of a downturn in investor confidence after a prolonged bear market, and this chart helps visualize the phenomenon.
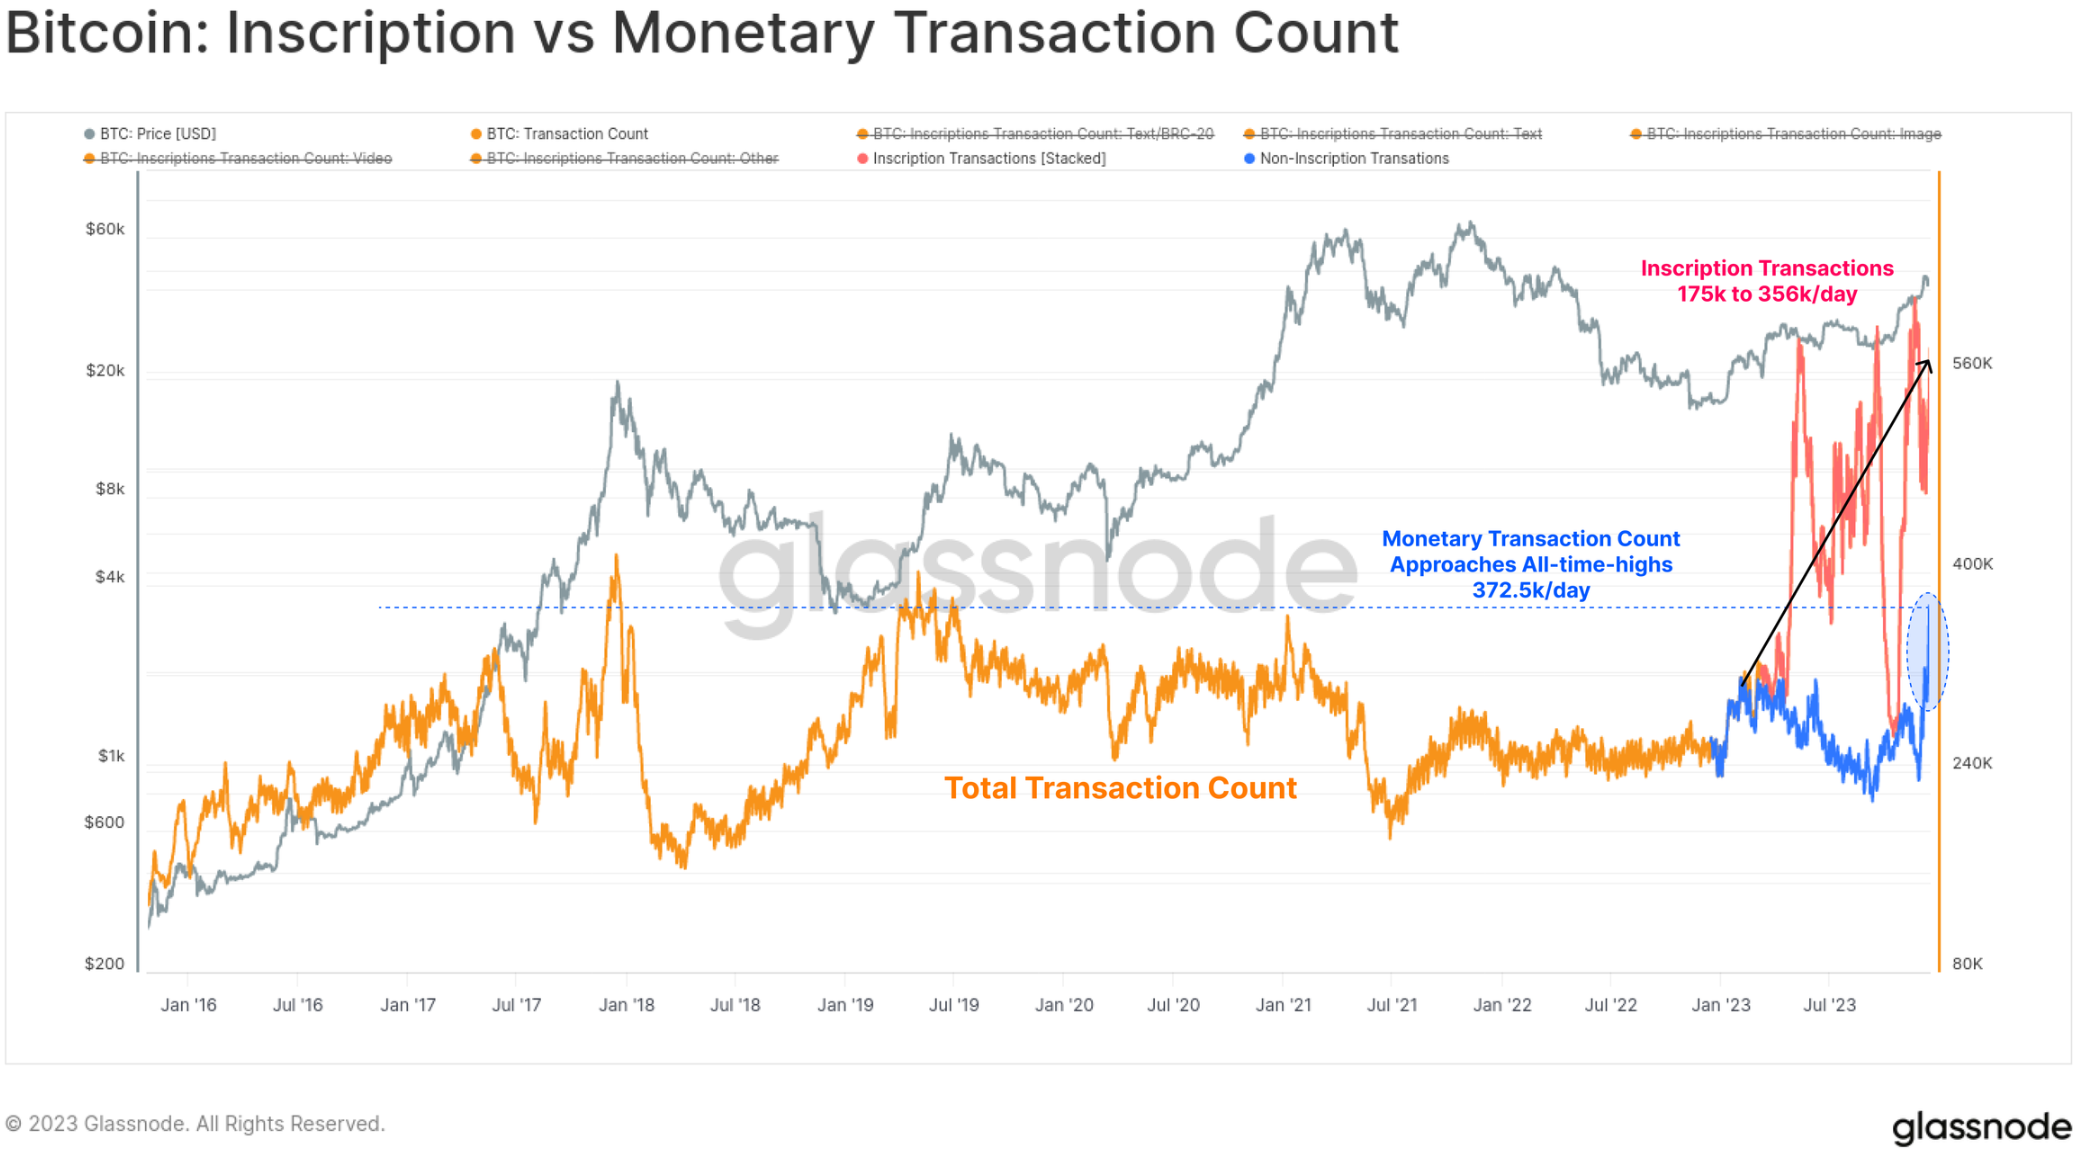
This year, the number of Bitcoin transactions hit an all-time high, largely due to unexpected growth in ordinal and inscription numbers. These transactions embed data such as text files and images into the signature portion of the transaction.
Therefore, we can now evaluate two types of Bitcoin transactions:
🟠 Total transaction count (unfiltered)
🔵 Currency trading volume has reached multi-year highs, almost reaching an all-time high of 372.5 k/day.
🔴 Inscription trading adds an additional 175,000 to 356,000 transactions per day on top of classic currency trading.
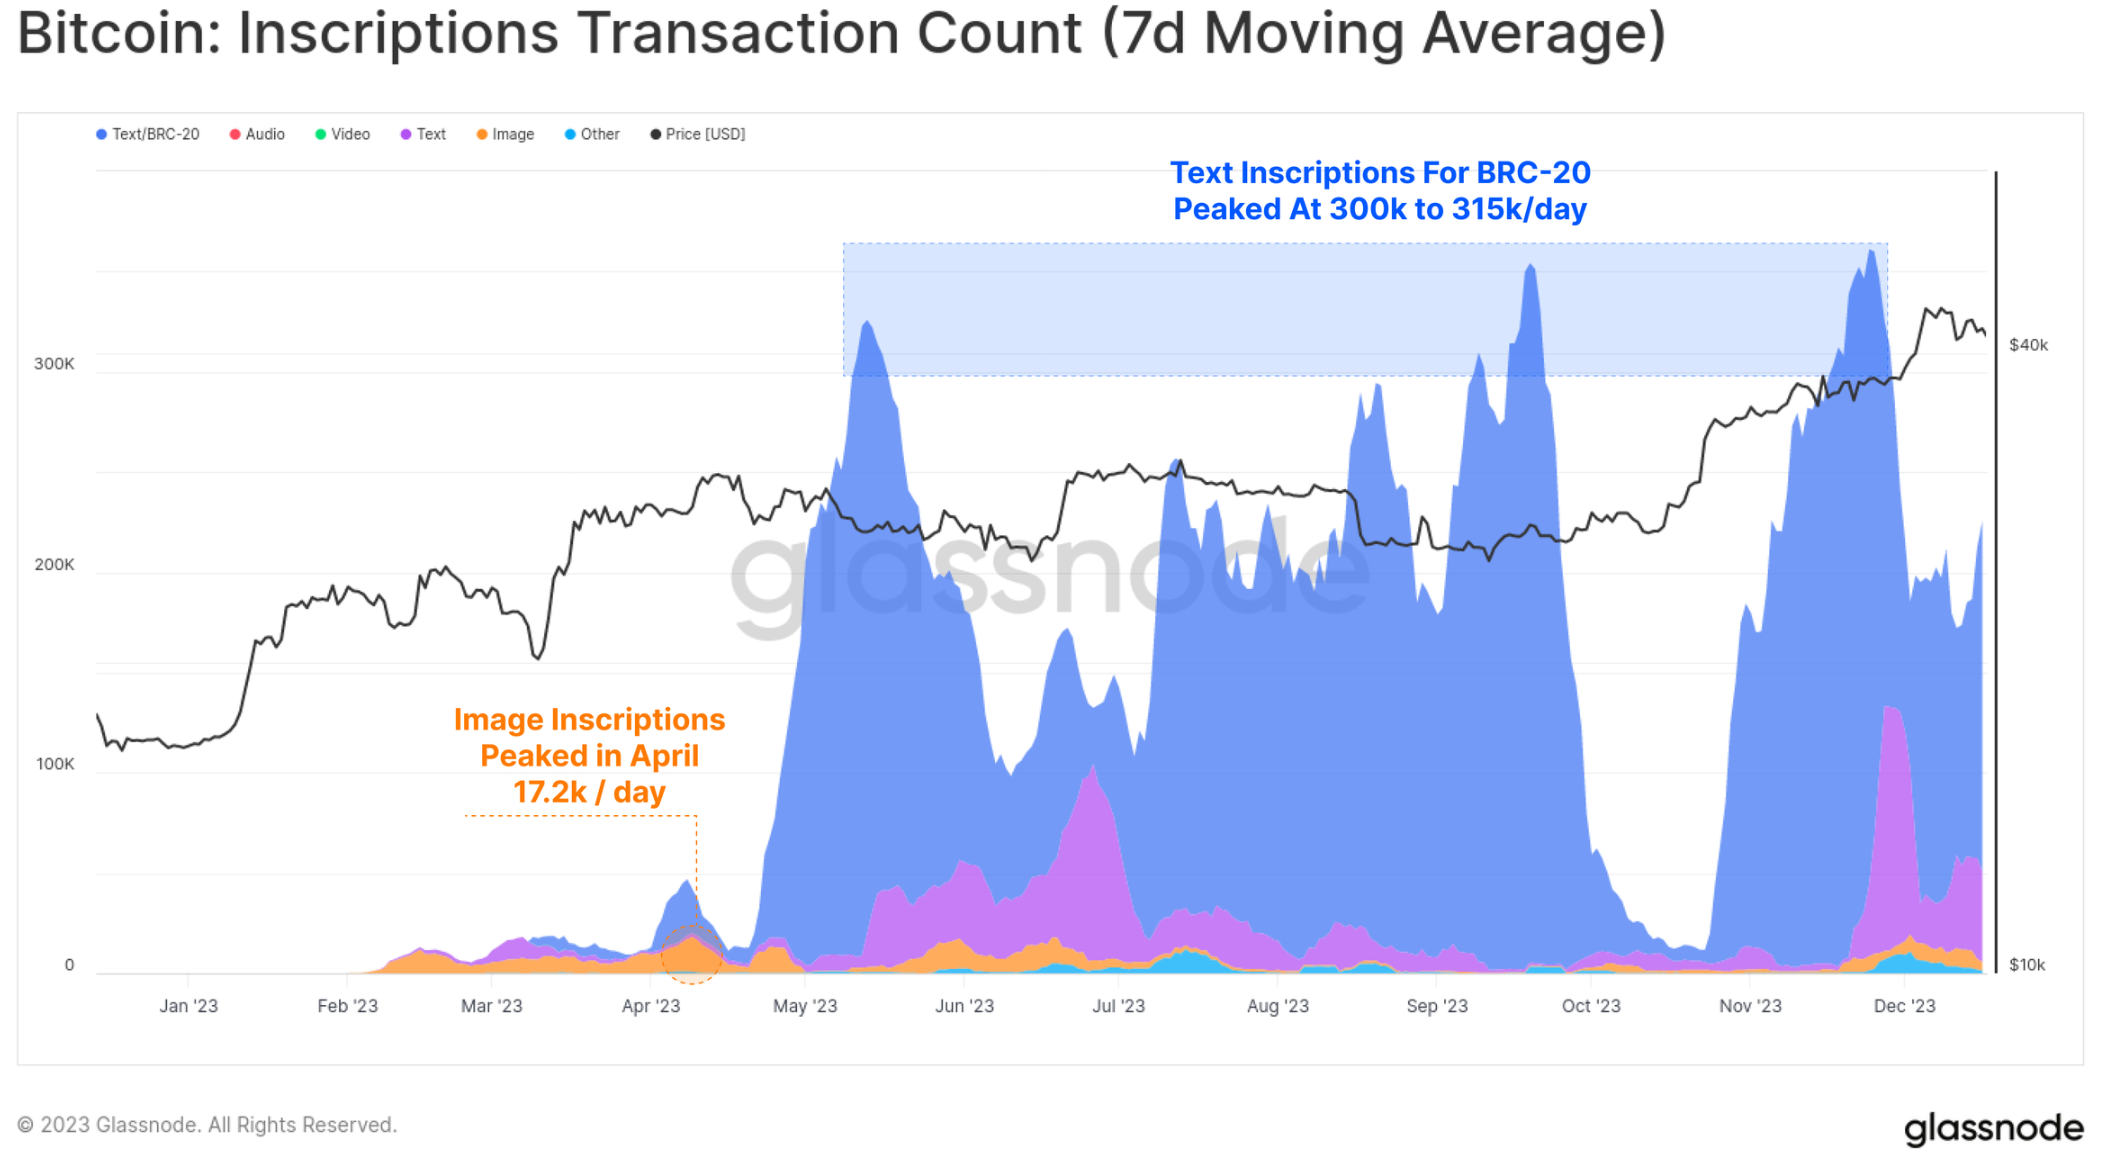
The vast majority of inscriptions tend to be text-based and related to a novel token standard called BRC-20 🔵. At its peak, the Bitcoin network was seeing over 300,000 inscriptions per day, far exceeding the peak of 172,000 per day for image-based inscriptions in April (images are larger, so inscriptions cost more as fees increase).
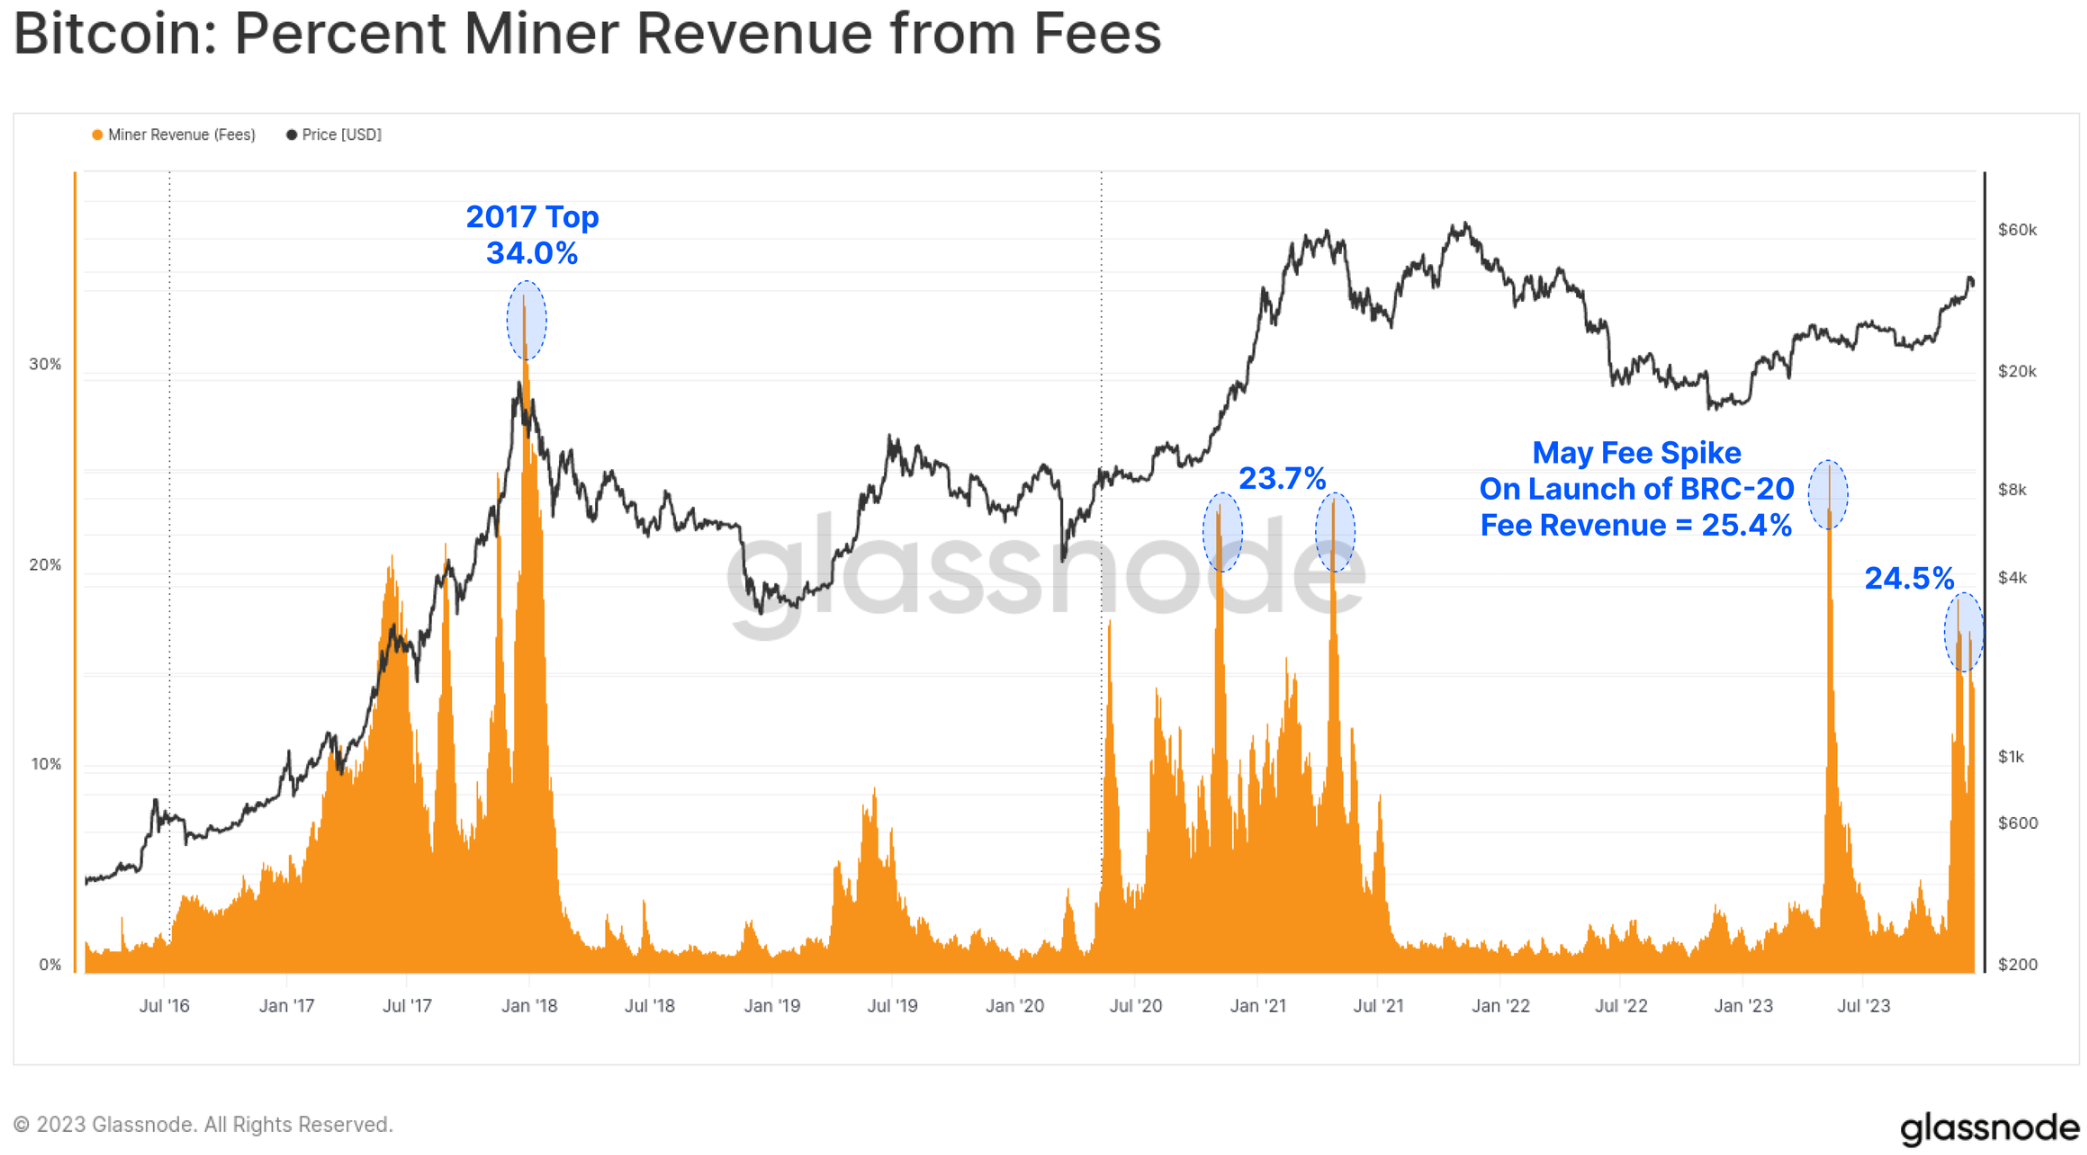
Due to this new buyer of Bitcoin block space, miners fee income increased significantly, with several blocks in 2023 paying even more than the 6.25 BTC subsidy. There have been two major fee hikes this year, and fees now account for about a quarter of miners’ revenue. This is comparable to the euphoric phases of the 2017 and 2021 bull markets.
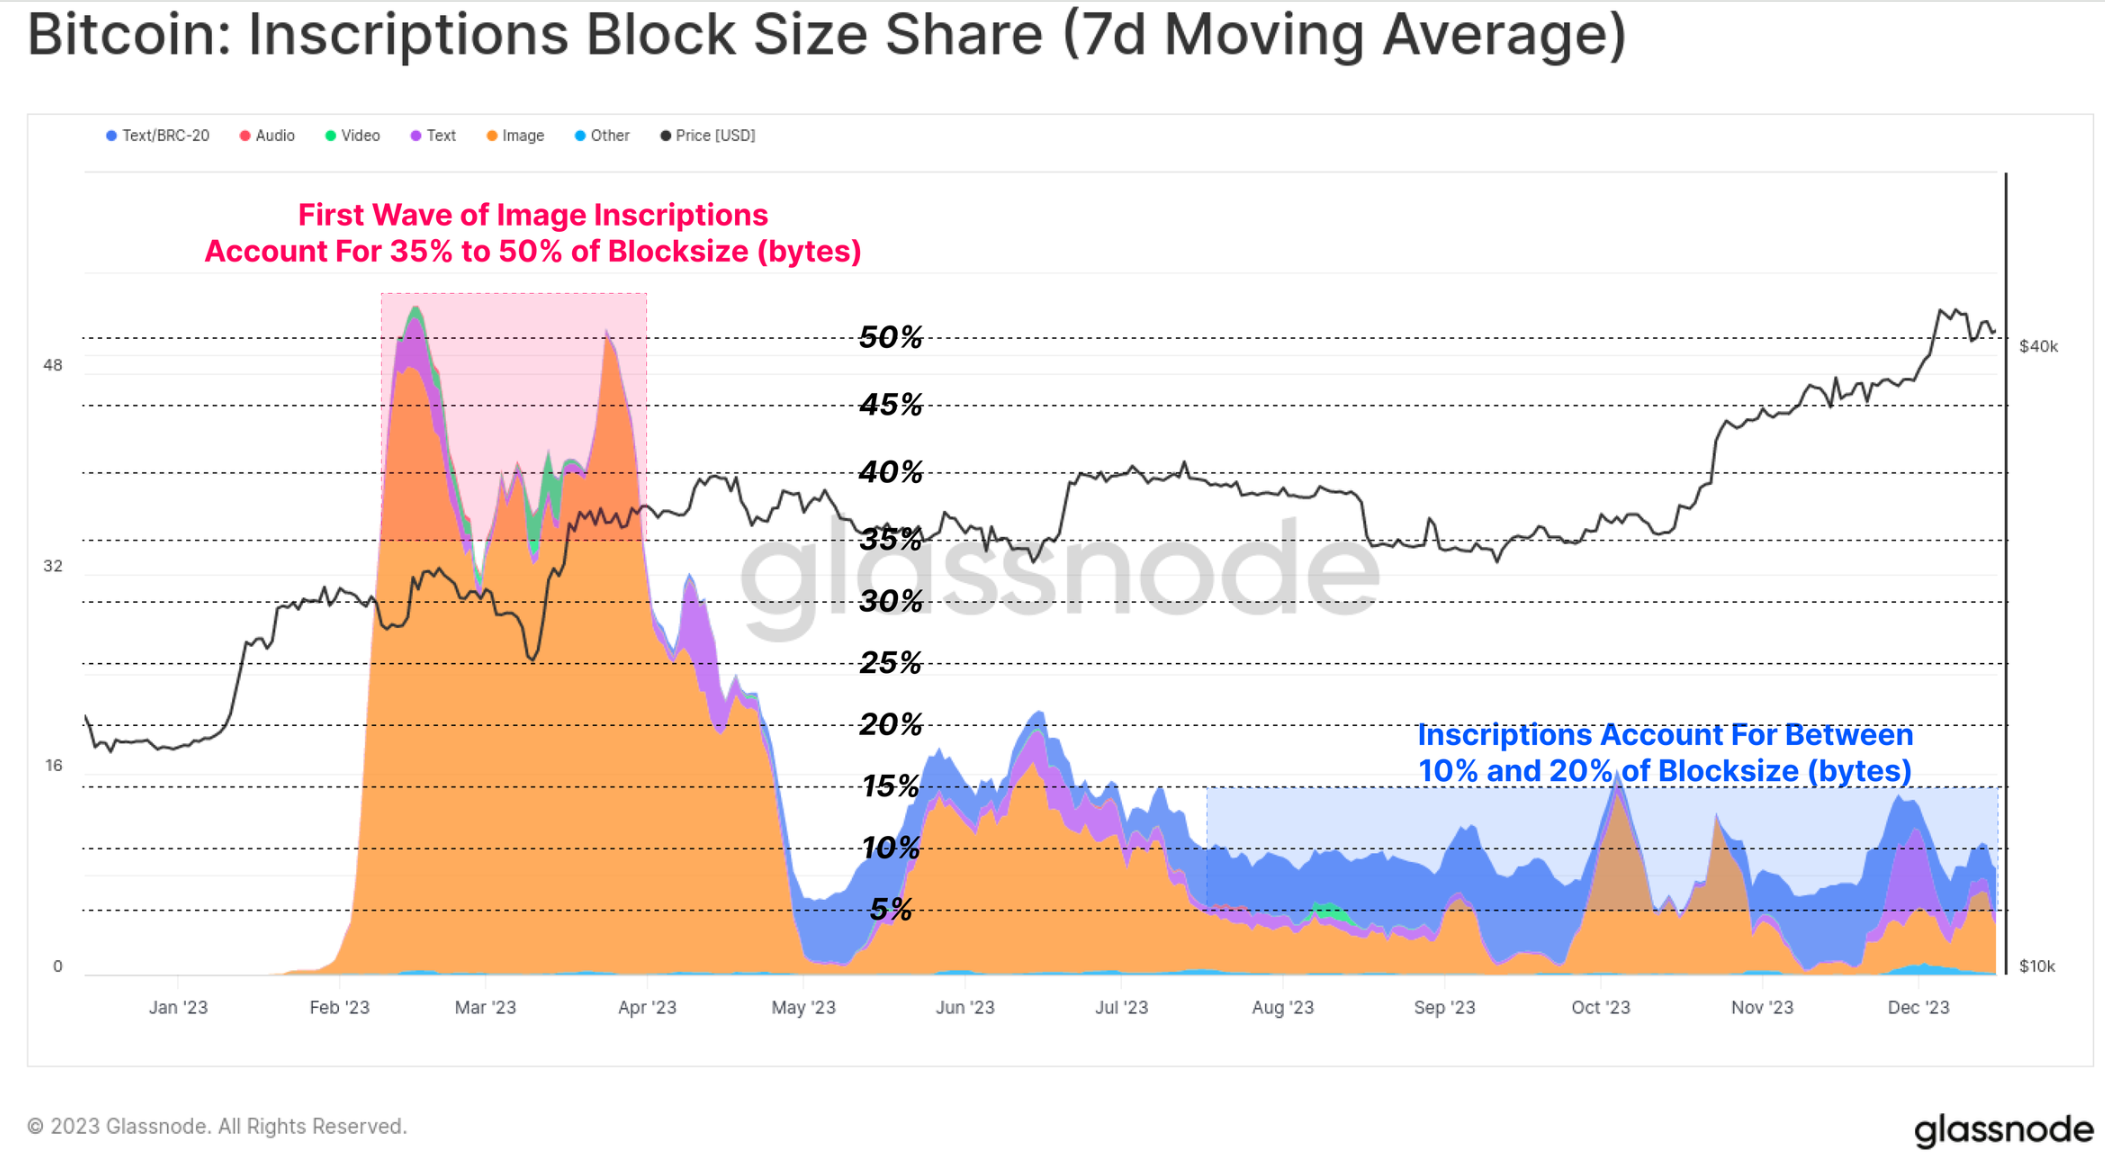
Interestingly, while inscriptions account for approximately 50% of confirmed transactions, they surprisingly only occupy around 10% to 15% of the block space. This is a result of the smaller text files and the nuances related to SegWit data discounting (a topic we covered in WoC-39).
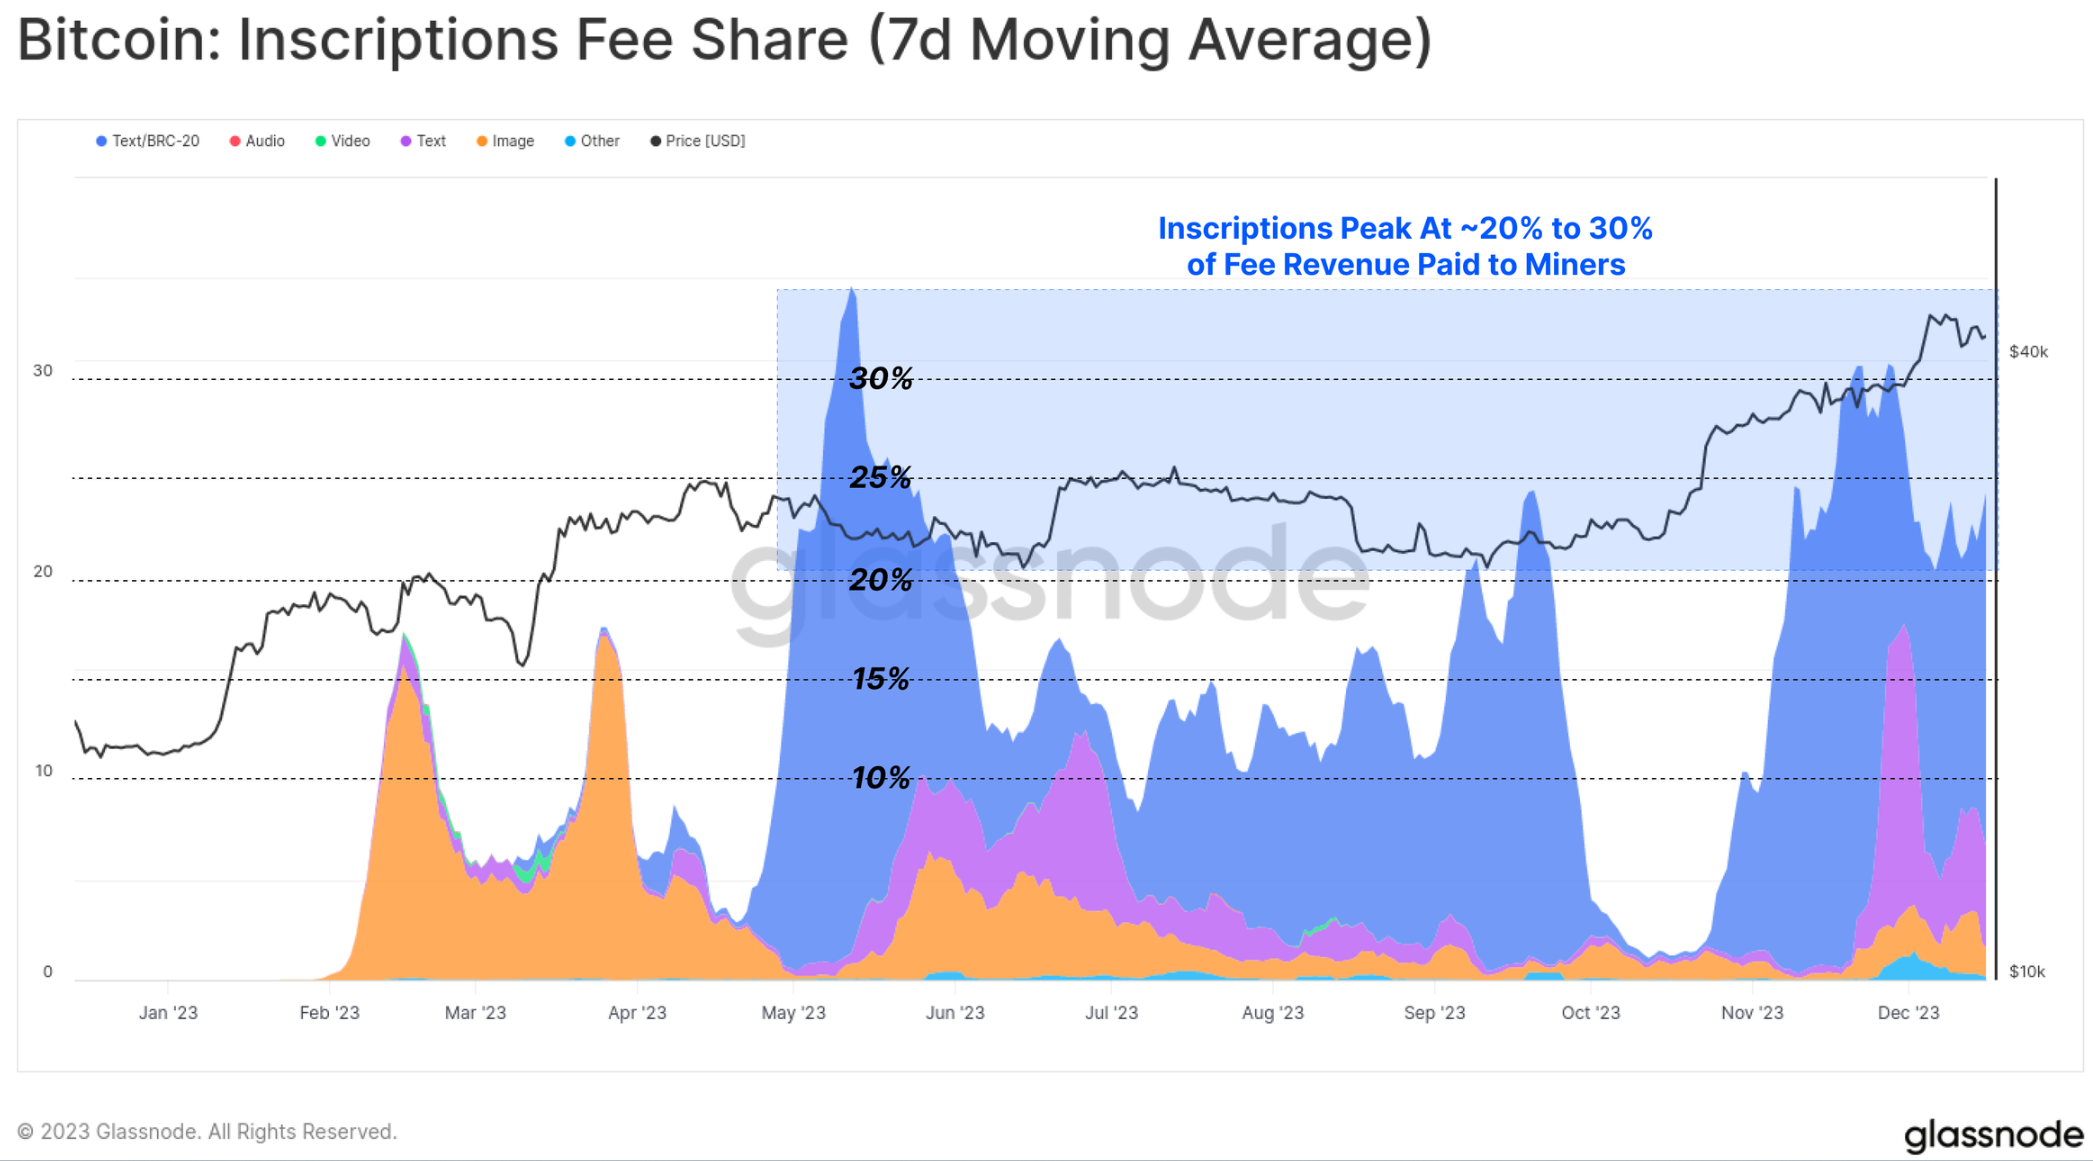
This year, Inscription contributed 15% to 30% of miners’ total transaction fee revenue. This highlights the unintuitive nature of SegWit discounts, where Inscription transactions consume a small portion of the block space (in bytes), paying a significant proportion of fees, but also account for around half of all confirmed transactions.
In effect, Inscriptions and SegWit data discounts allow miners to put more transactions into the same maximum size block and thus pay more. If demand for Inscriptions persists, the impact on miners’ income could meaningfully improve miners’ economics, especially with the fourth halving on the horizon.
Cross-chain bridge, staking and Shanghai upgrade
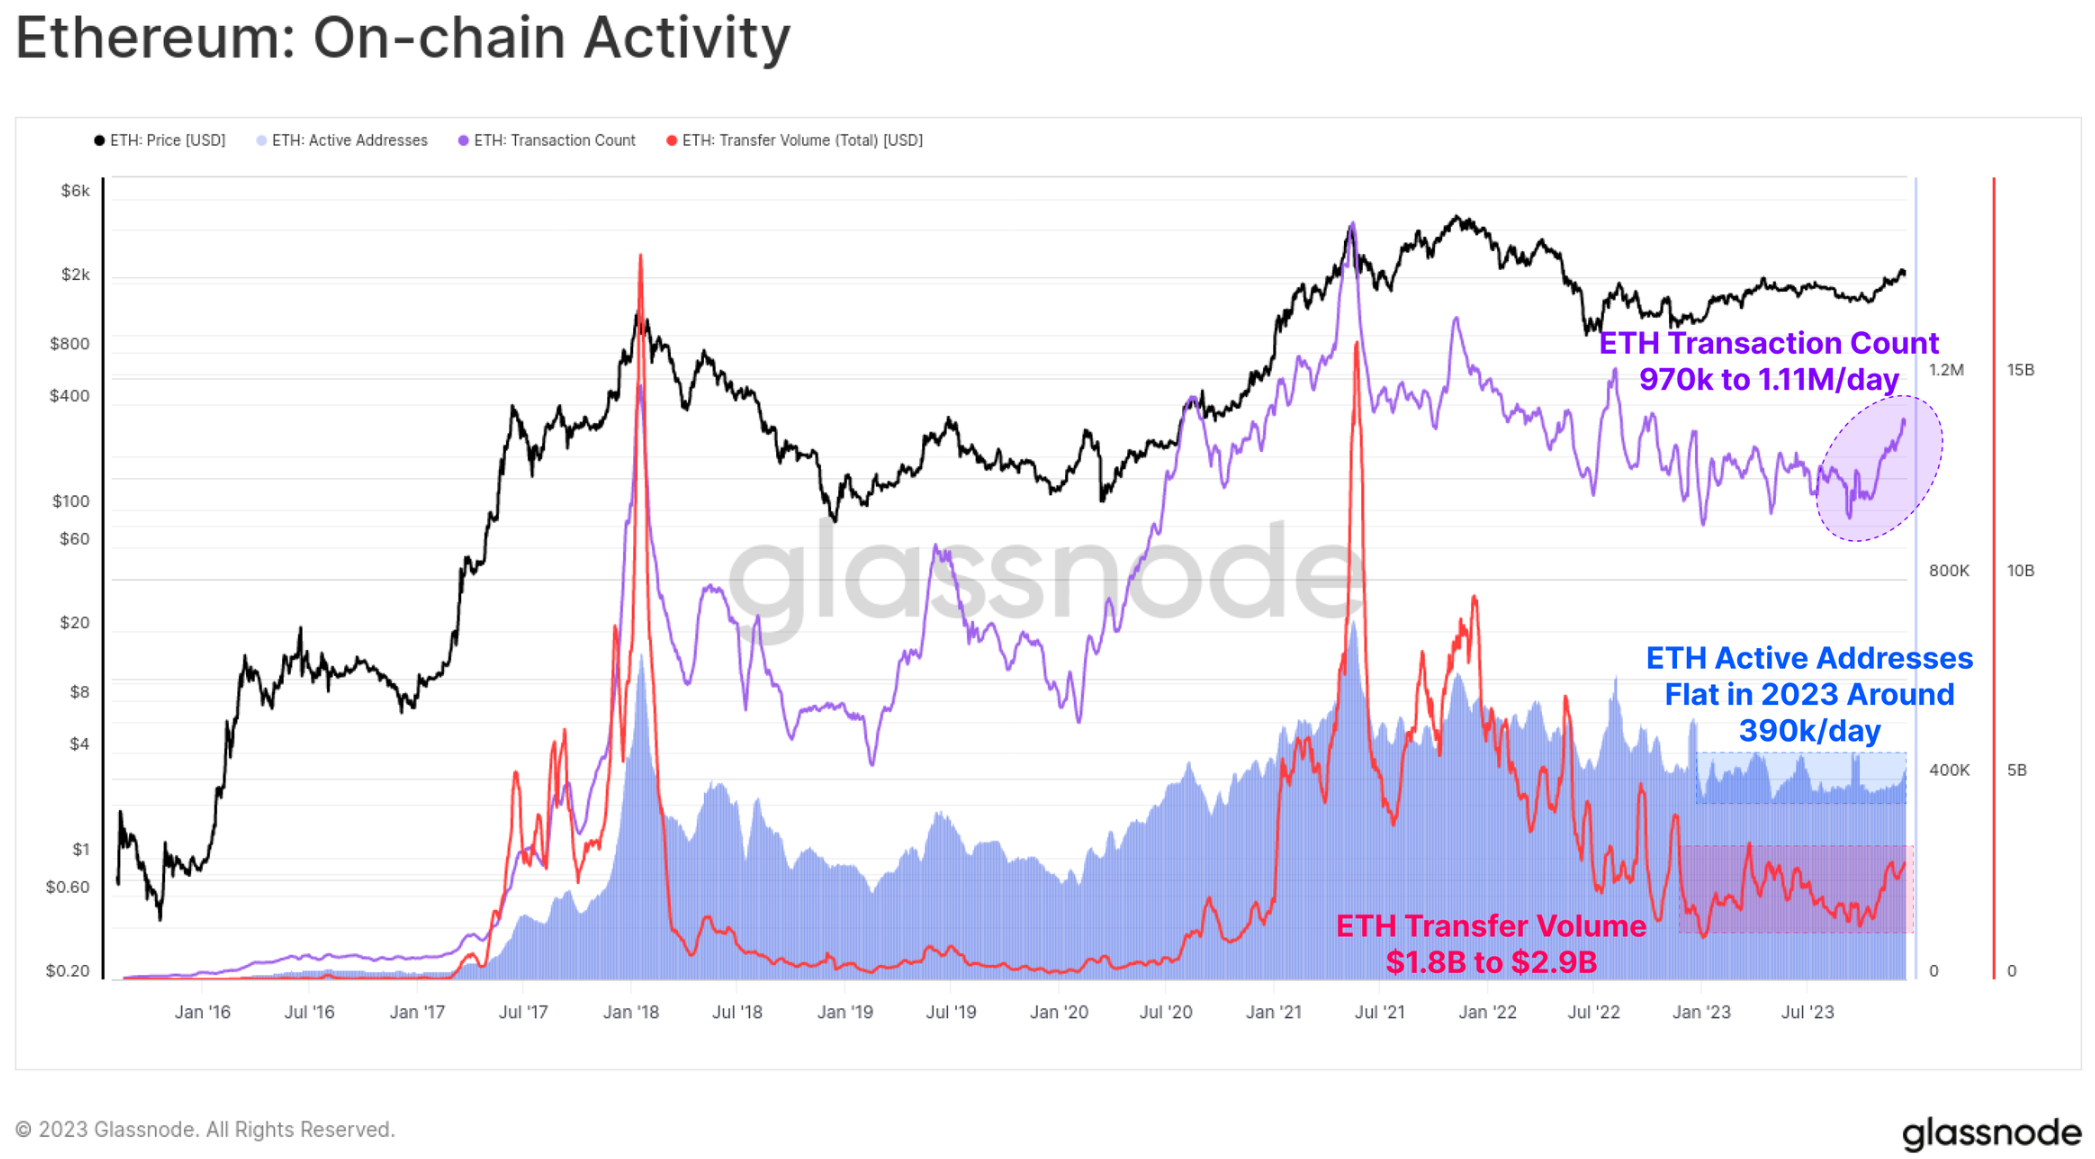
For Ethereum, on-chain activity has been a bit subdued this year, with October once again becoming a significant inflection point.
Active addresses are relatively stable, about 390,000/day
Transaction volume recently increased from 970,000 transactions/day to 1.11 million transactions/day
ETH transfer volume has increased from $1.8 B/day to $2.9 B/day
While ETH’s overall market price performance lags behind that of the broader digital asset space, its ecosystem continues to expand, mature, and develop. In particular, the total value locked in the expanding Layer-2 blockchain increased by 60%, with over $12B now locked in the bridge.
These L2 chains are looking to expand and expand the Ethereum block space while anchoring their data and finality into the main Ethereum chain to maintain its security.
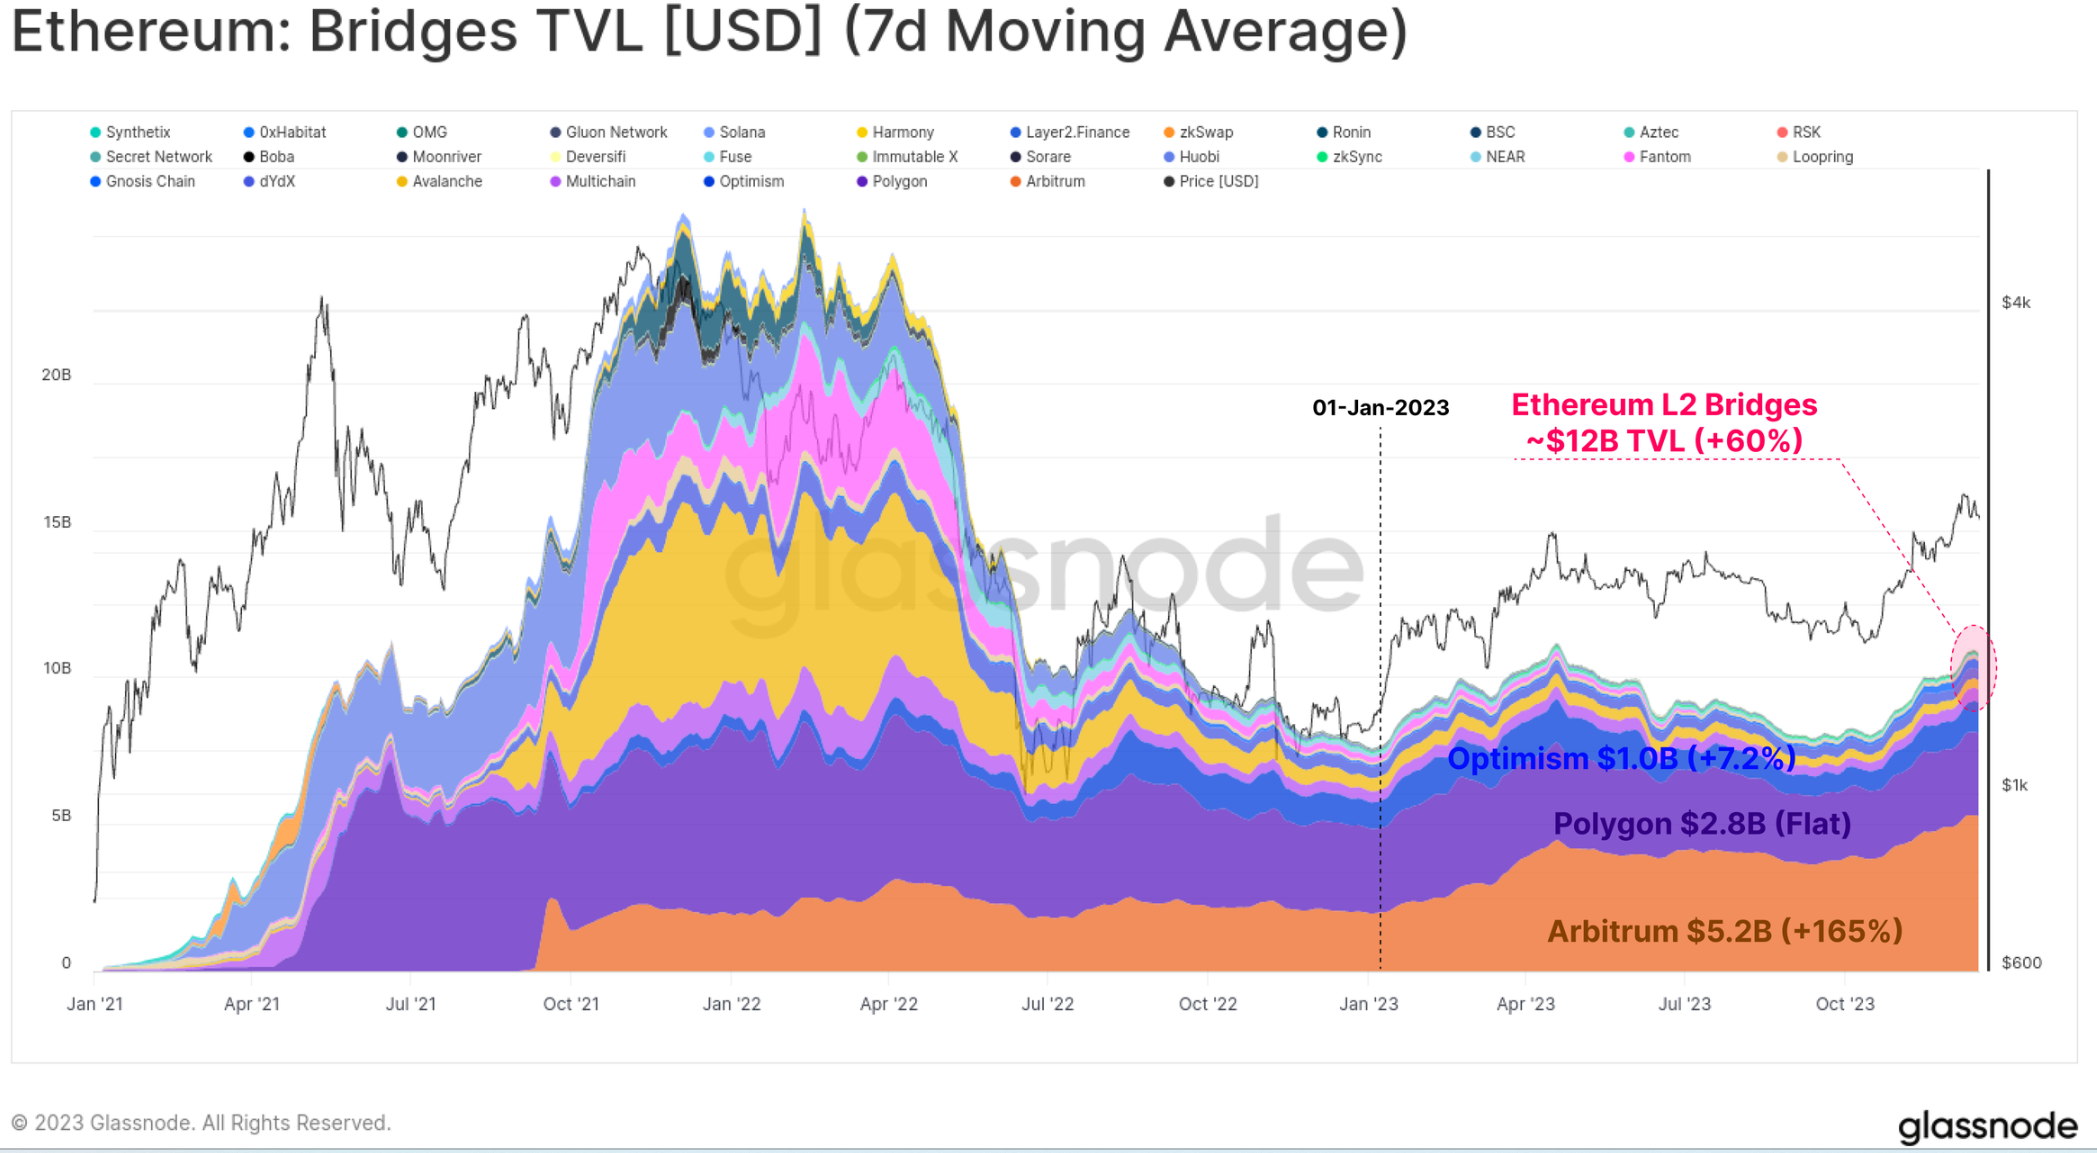
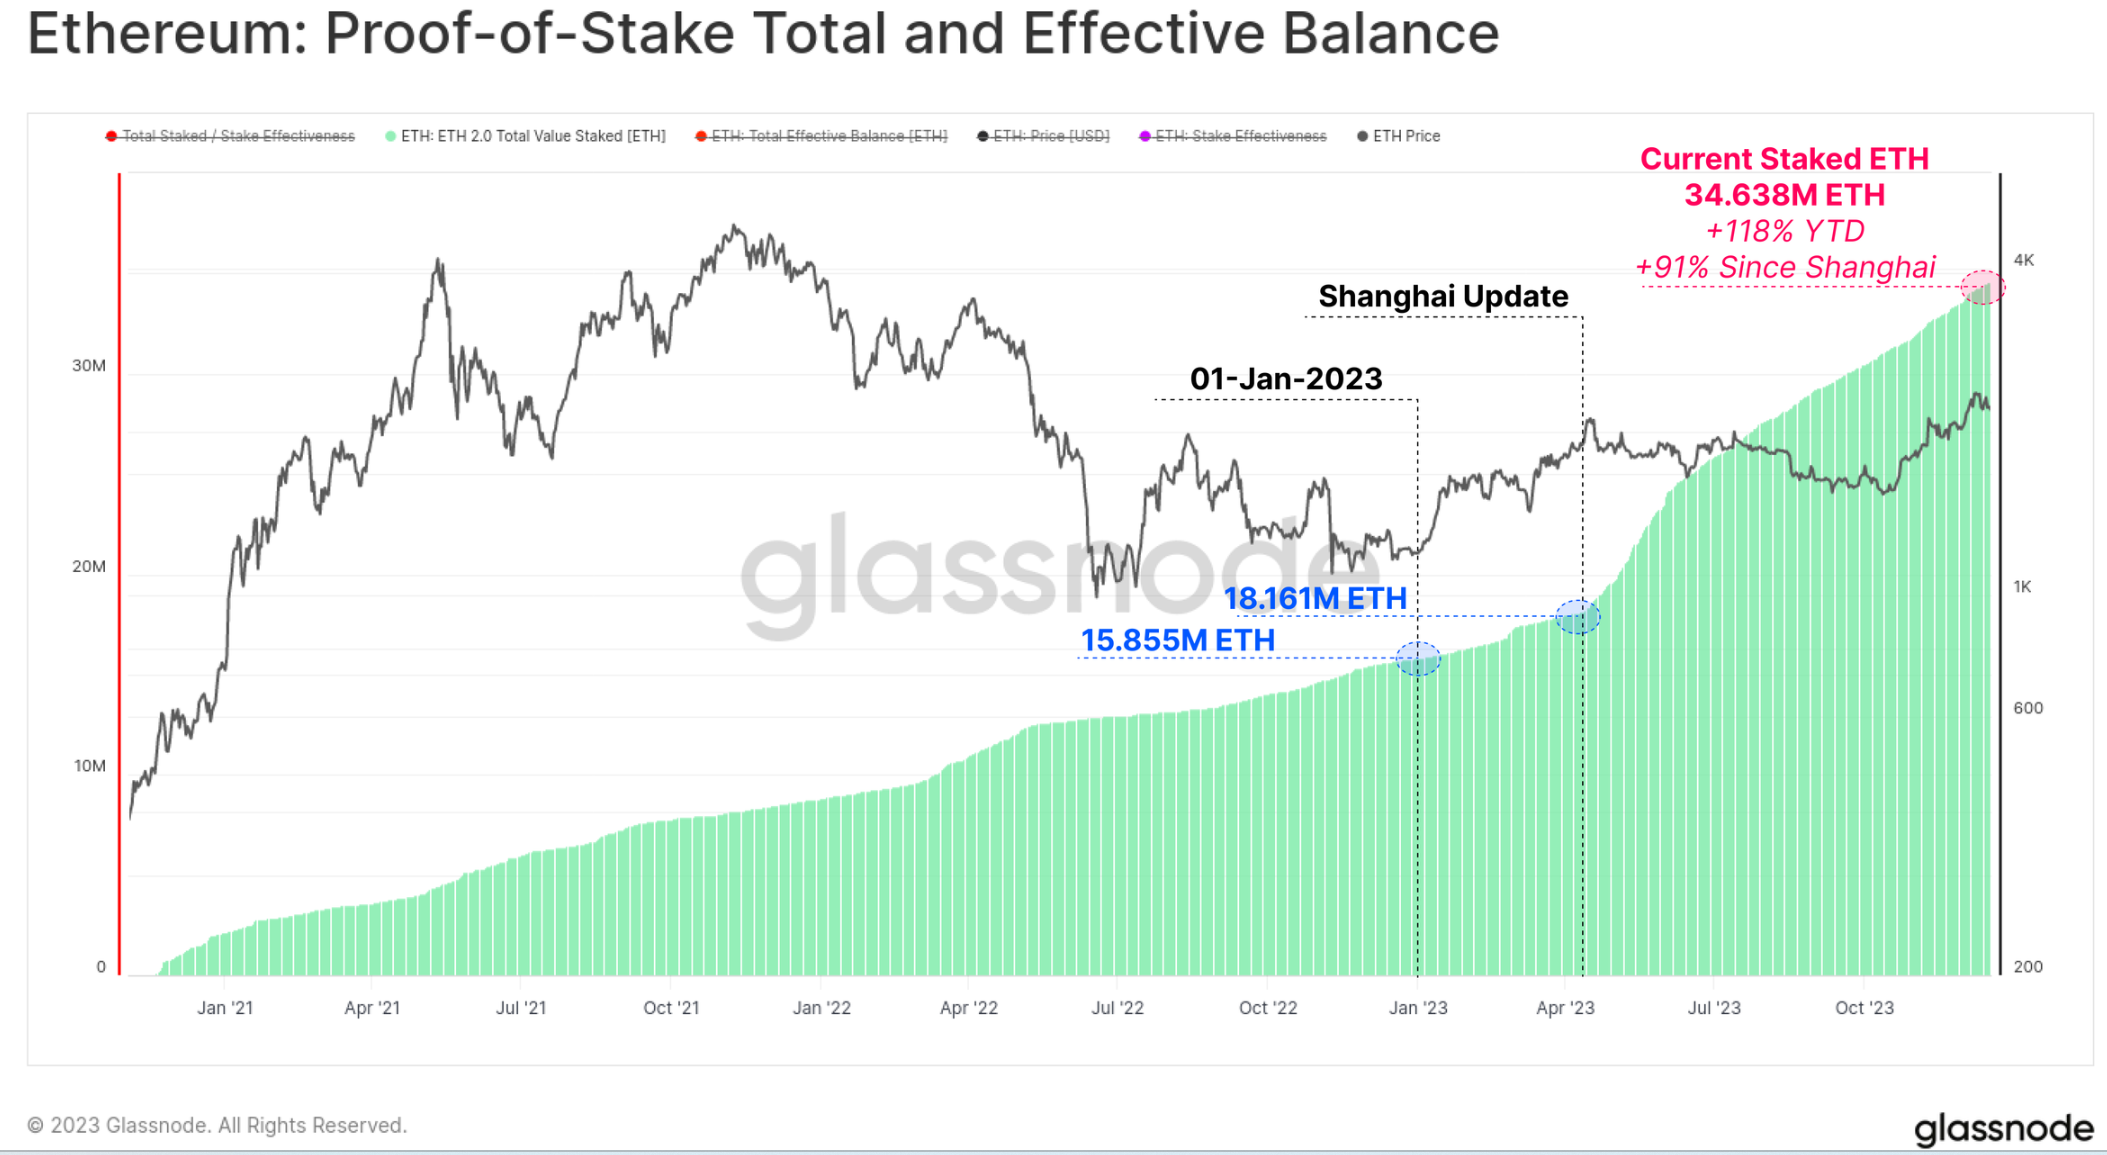
Another key growth area for Ethereum is the amount of ETH staked through the new proof-of-stake consensus mechanism. Since the beginning of this year, the number of pledged ETH has increased by 119%, and the number of ETH currently locked in the pledge agreement has exceeded 34.638 million. The Shanghai update was also successfully launched in April, allowing stakers to complete withdrawals and reshuffle staking providers and settings for the first time since the launch of the Beacon chain in December 2020.
Think long term
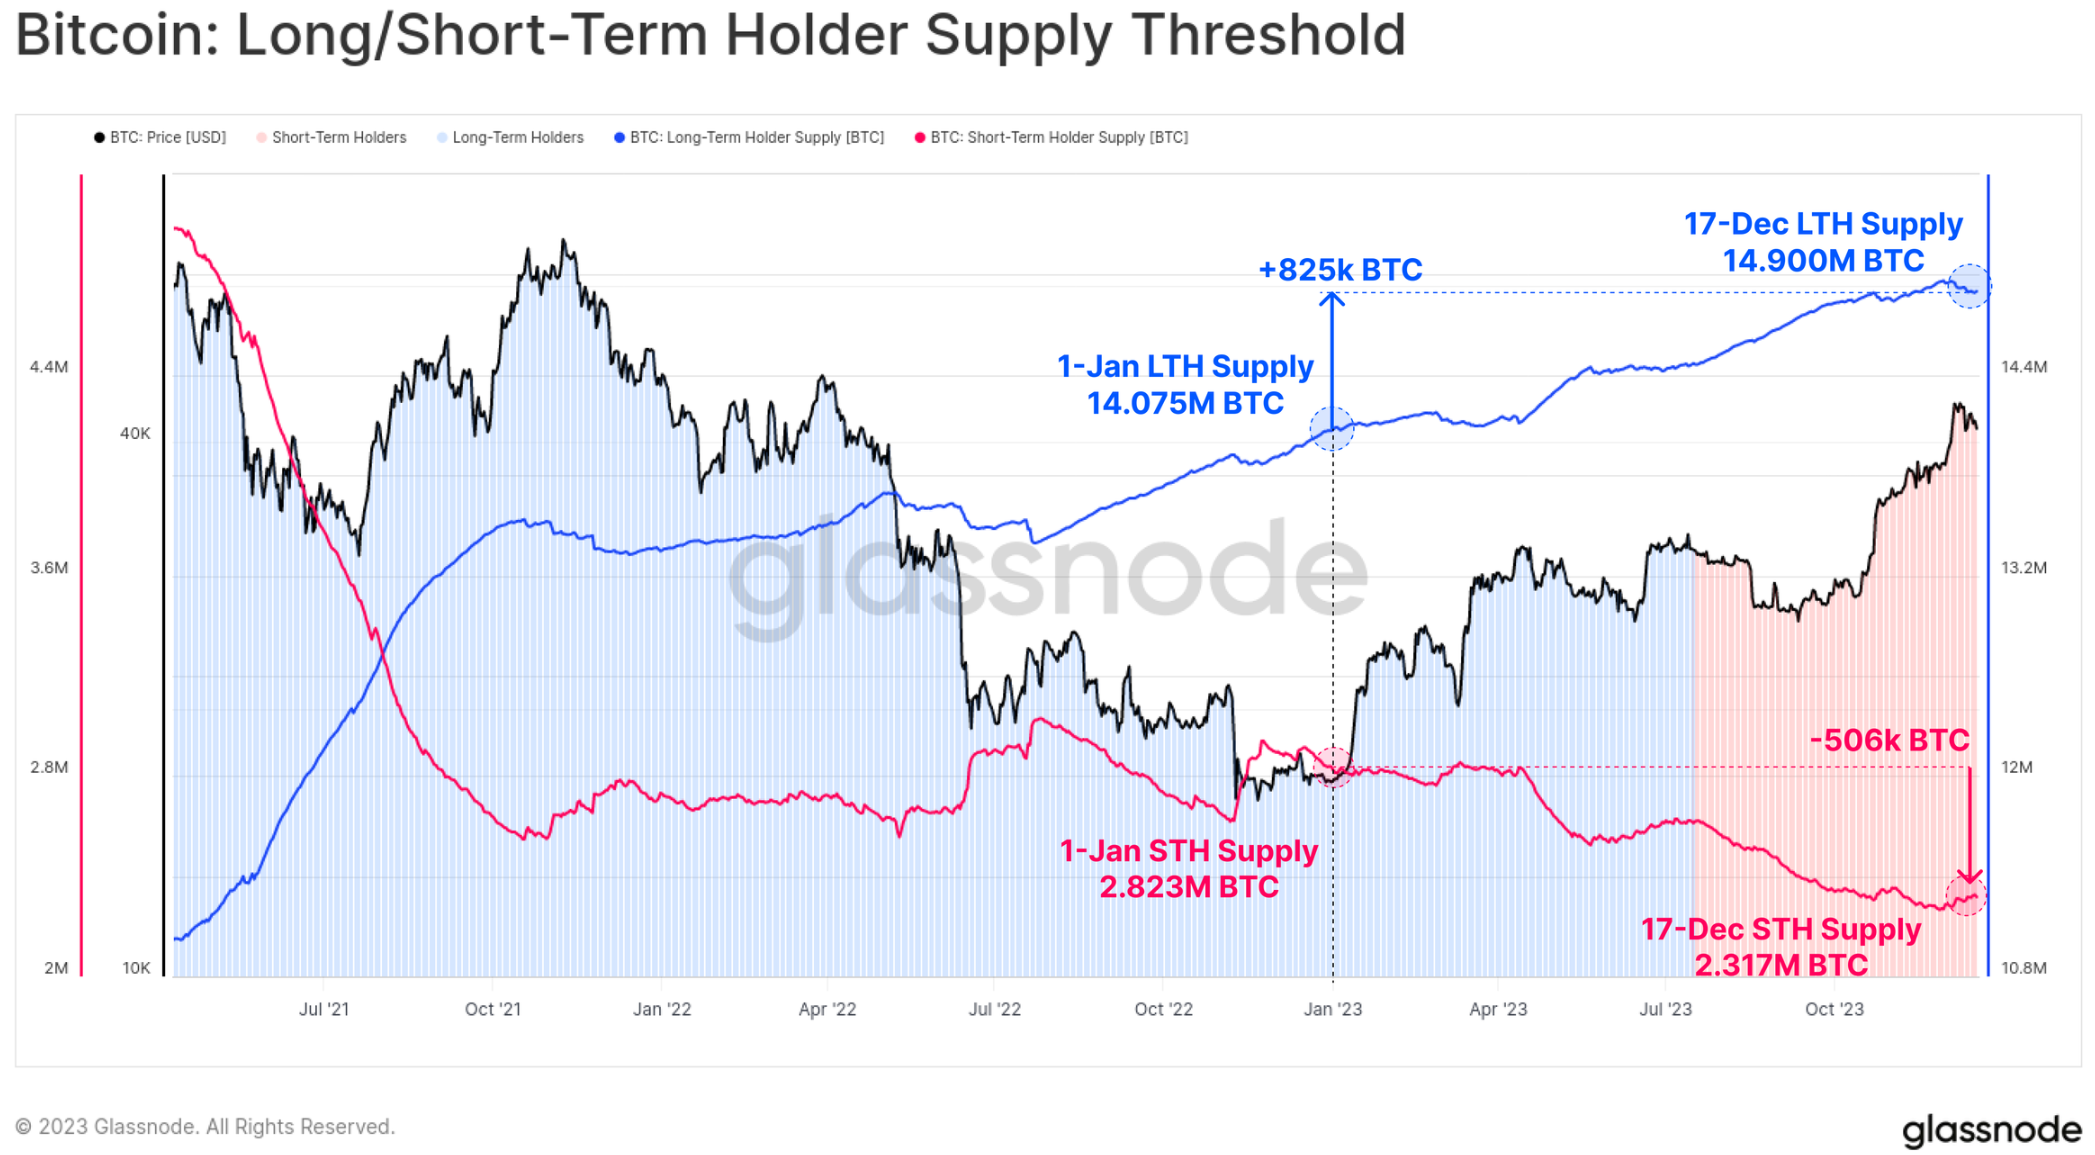
Despite Bitcoin’s incredible price performance, a large portion of Bitcoin remains dormant and reaches long-term holder status in investor wallets. Of the total circulating supply of 19.574 million BTC, over 14.9 million (76.1%) are held off exchanges and have not moved in over 155 days, an increase of 825,000 so far this year BTC. This also brought the short-term holder supply to an all-time low of 2.317 million BTC.
As the market rebounds, the vast majority of investors’ tokens have returned to “profitability,” whether due to changing hands or rising in price above cost. The chart below shows how the total number of “losing” tokens has dropped to around 1.9 million BTC, most of which is held by long-term holders who bought near the 2021 highs.
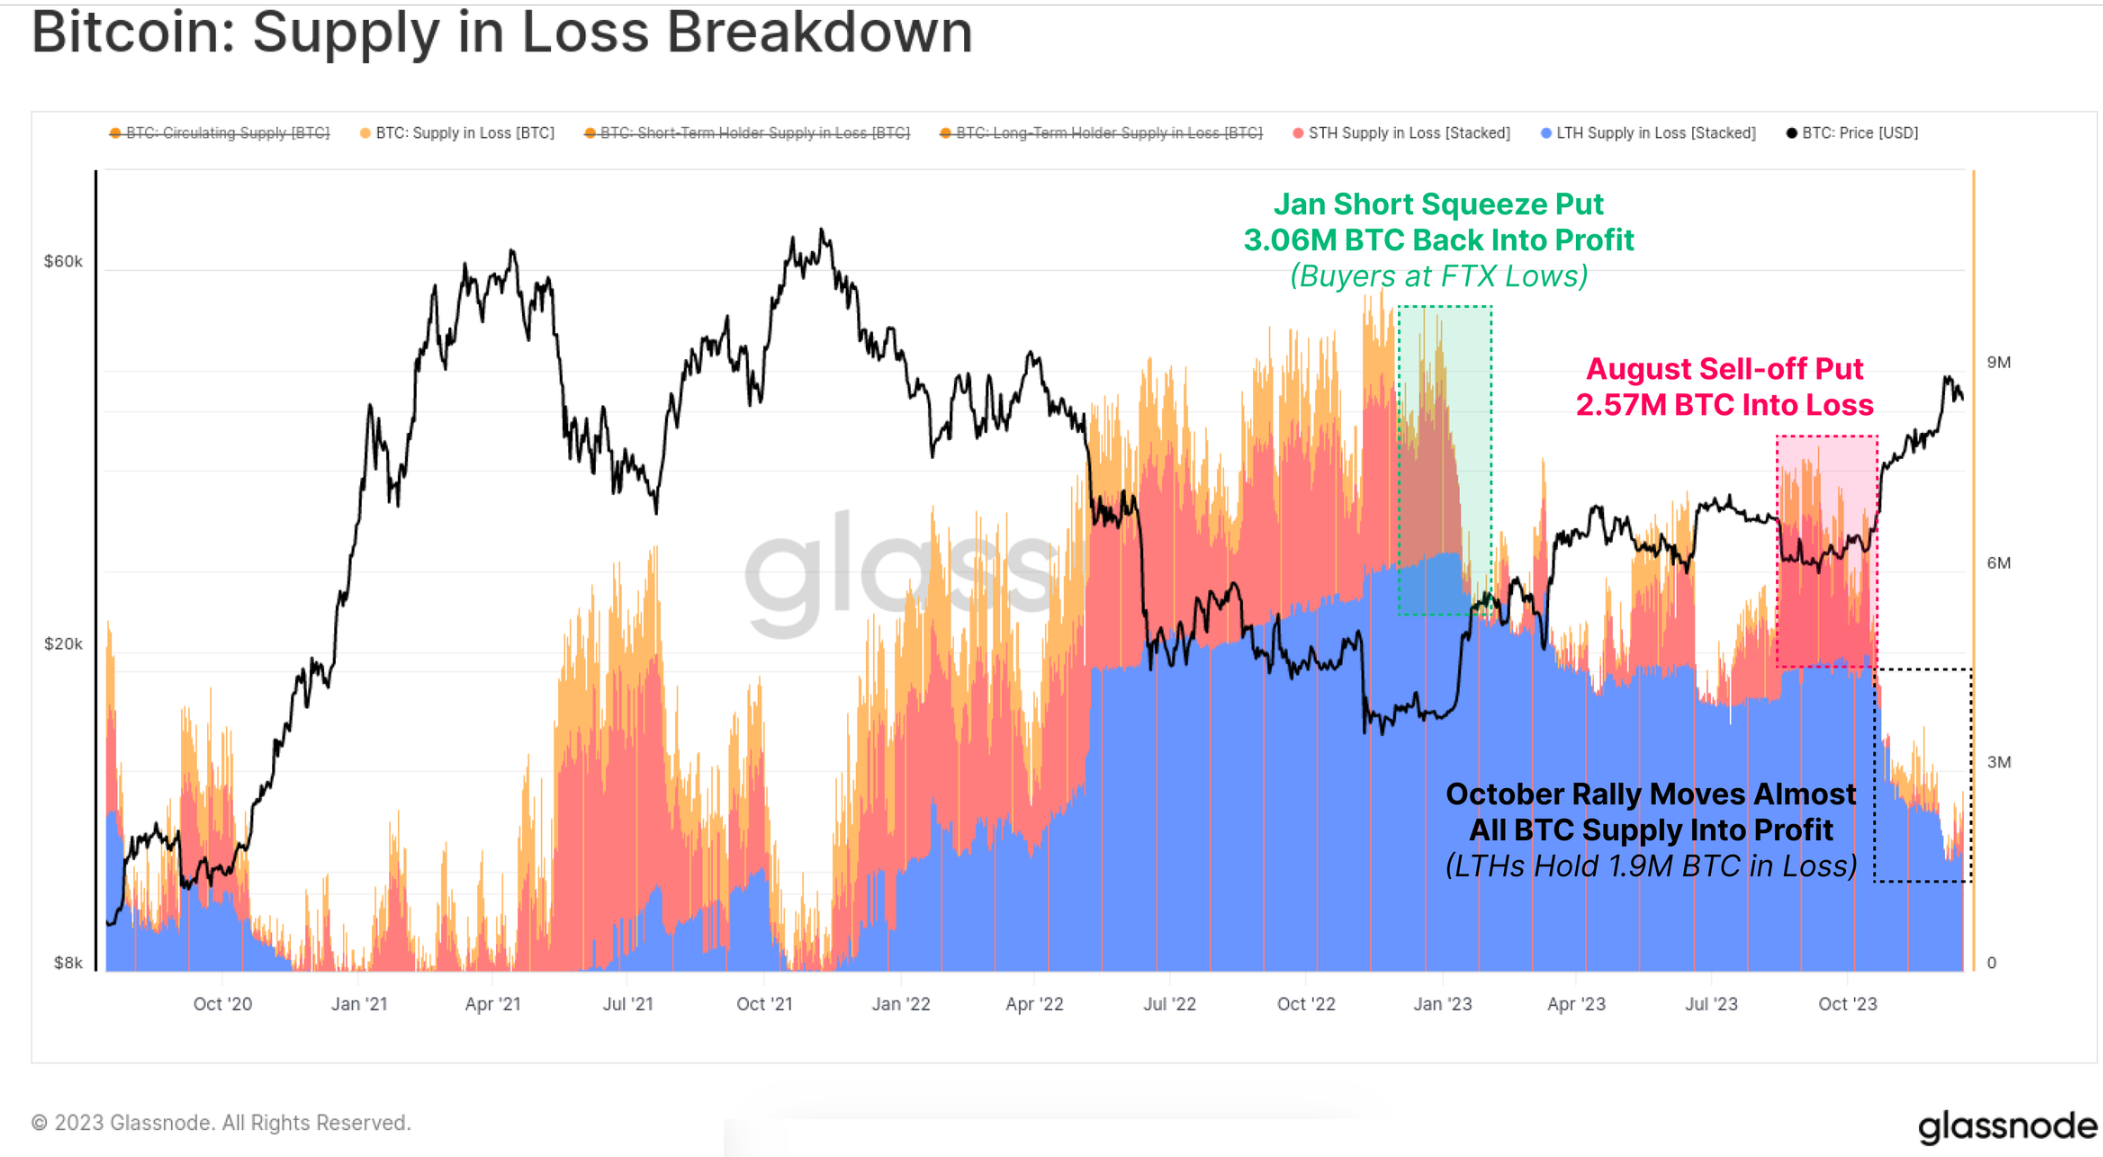
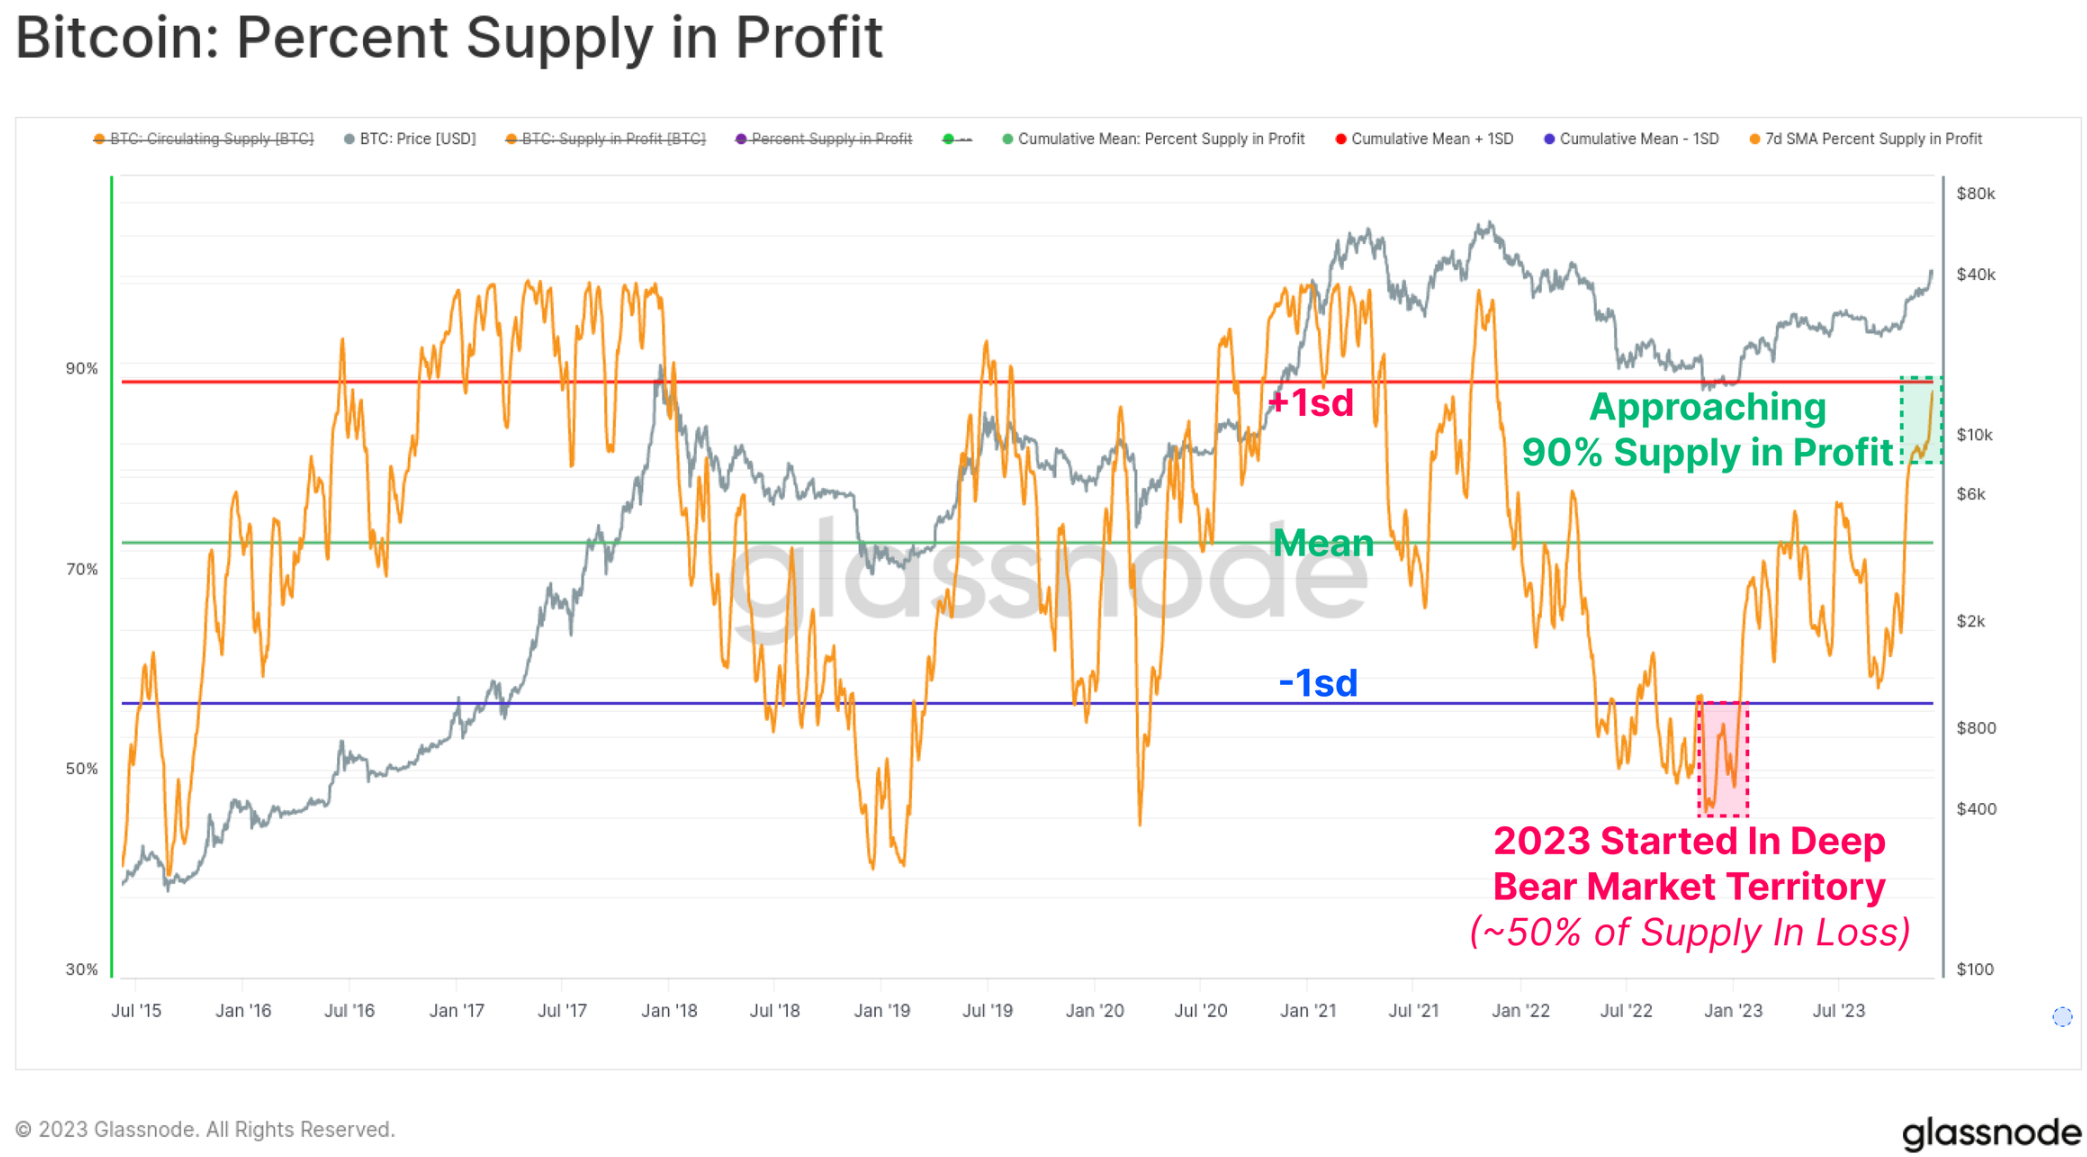
On the other hand, profitable supply currently accounts for over 90% of circulating supply, and the rebound in October has put it above historical averages. With over 50% of supply underwater at the start of 2023, this is one of the fastest recoveries in history (second only to the 2019 rebound).
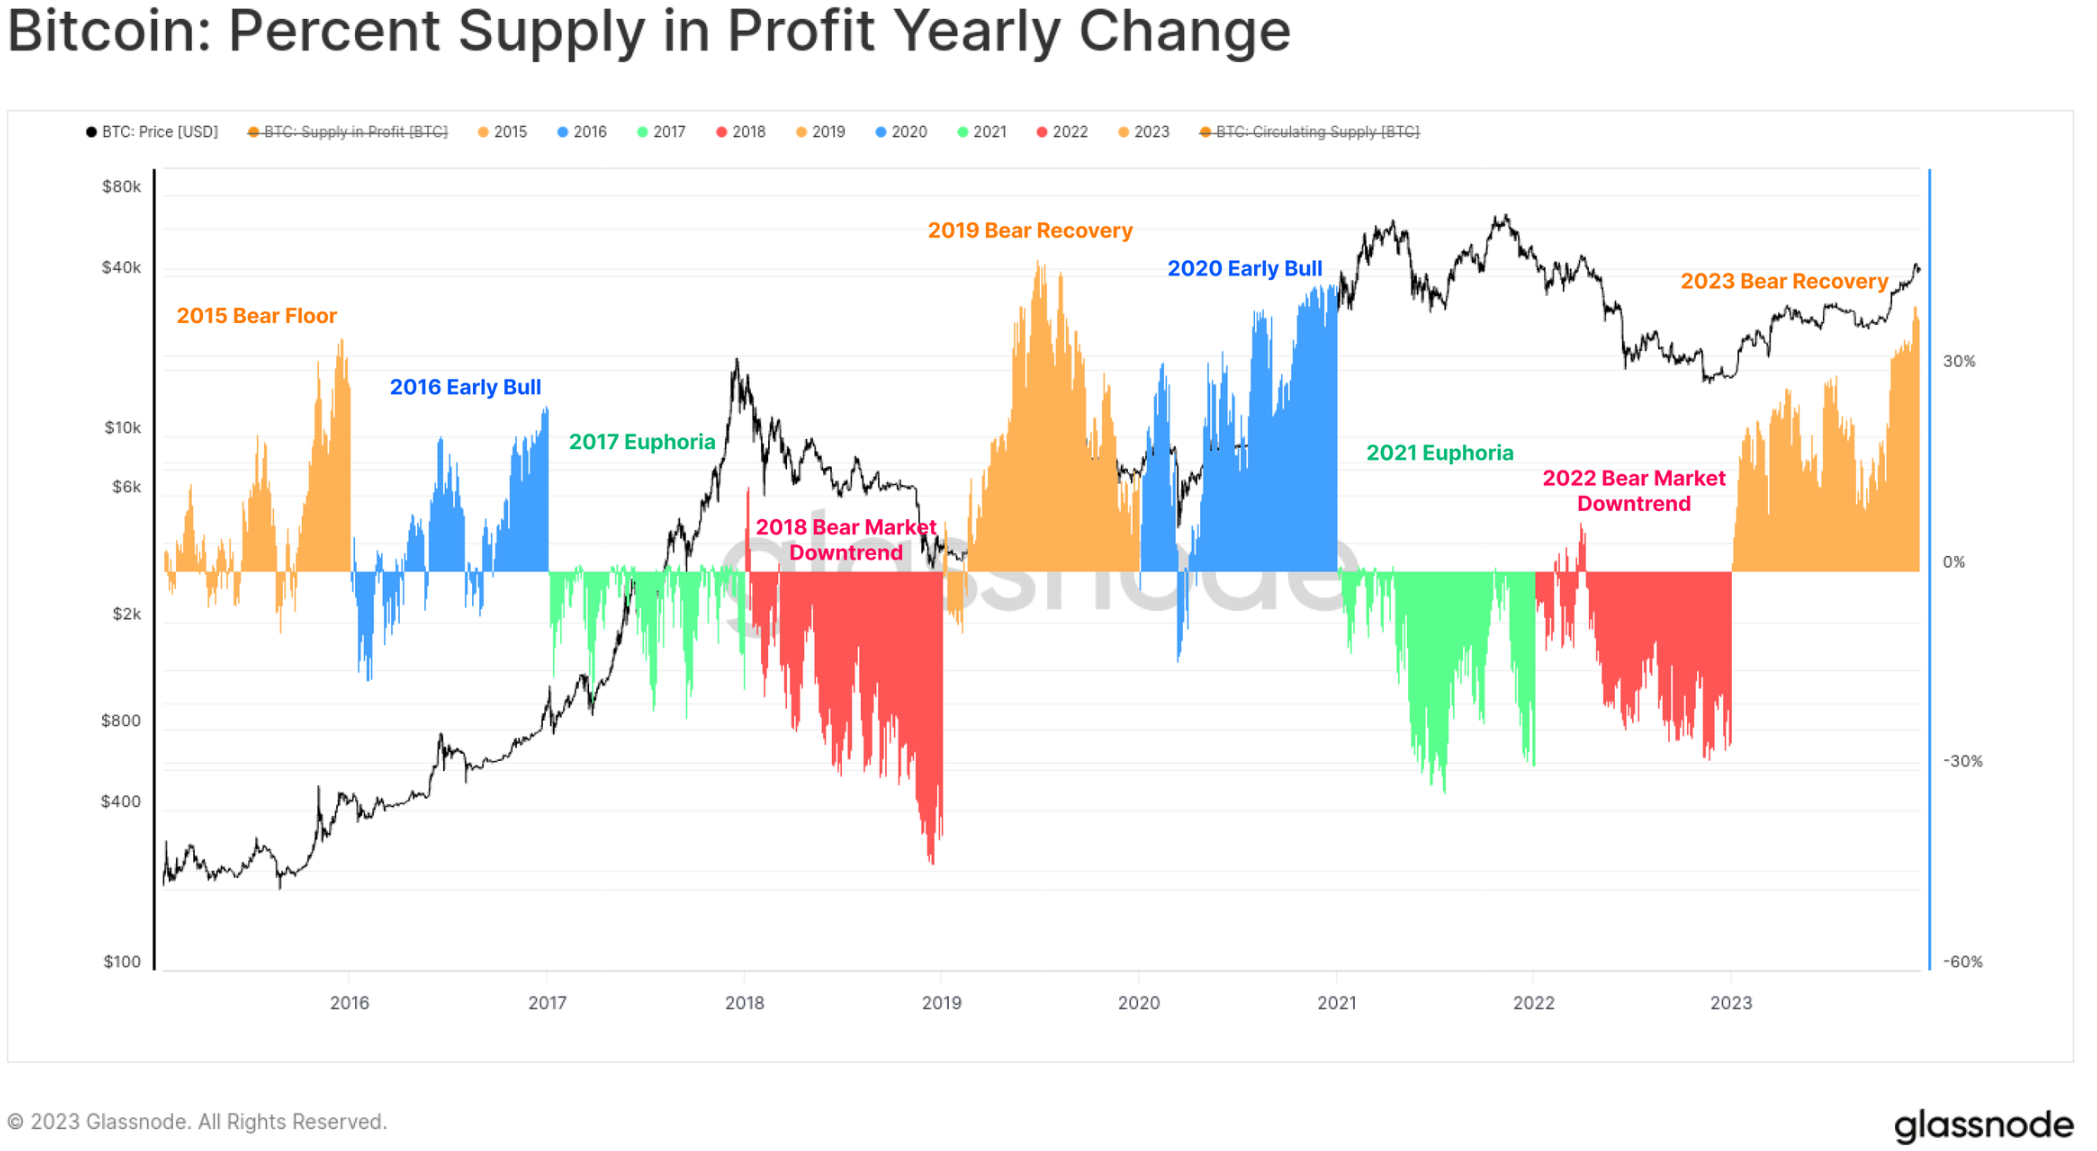
The chart below provides a visual representation of the profit supply percentage change for each calendar year since 2015. While not perfect by year, the classic four-year Bitcoin cycle allows us to spot some interesting patterns:
🟠The bear market/recovery phase sees the largest increase in profit supply as the token capitulates near the lows and returns to profitable territory.
🔵Early bull market, the general uptrend saw most coins profiting and rallying to new highs.
🟢In the late bull run, the market is at the ATH level, resulting in small positive to negative readings as all coins have made profits and the market is close to drying up.
🔴Major bear market after the market peaked, with a large number of tokens falling into losses.
Although simple in structure, the framework does highlight the similarities between progress made to date in 2015-16, 2019-20 and 2023.
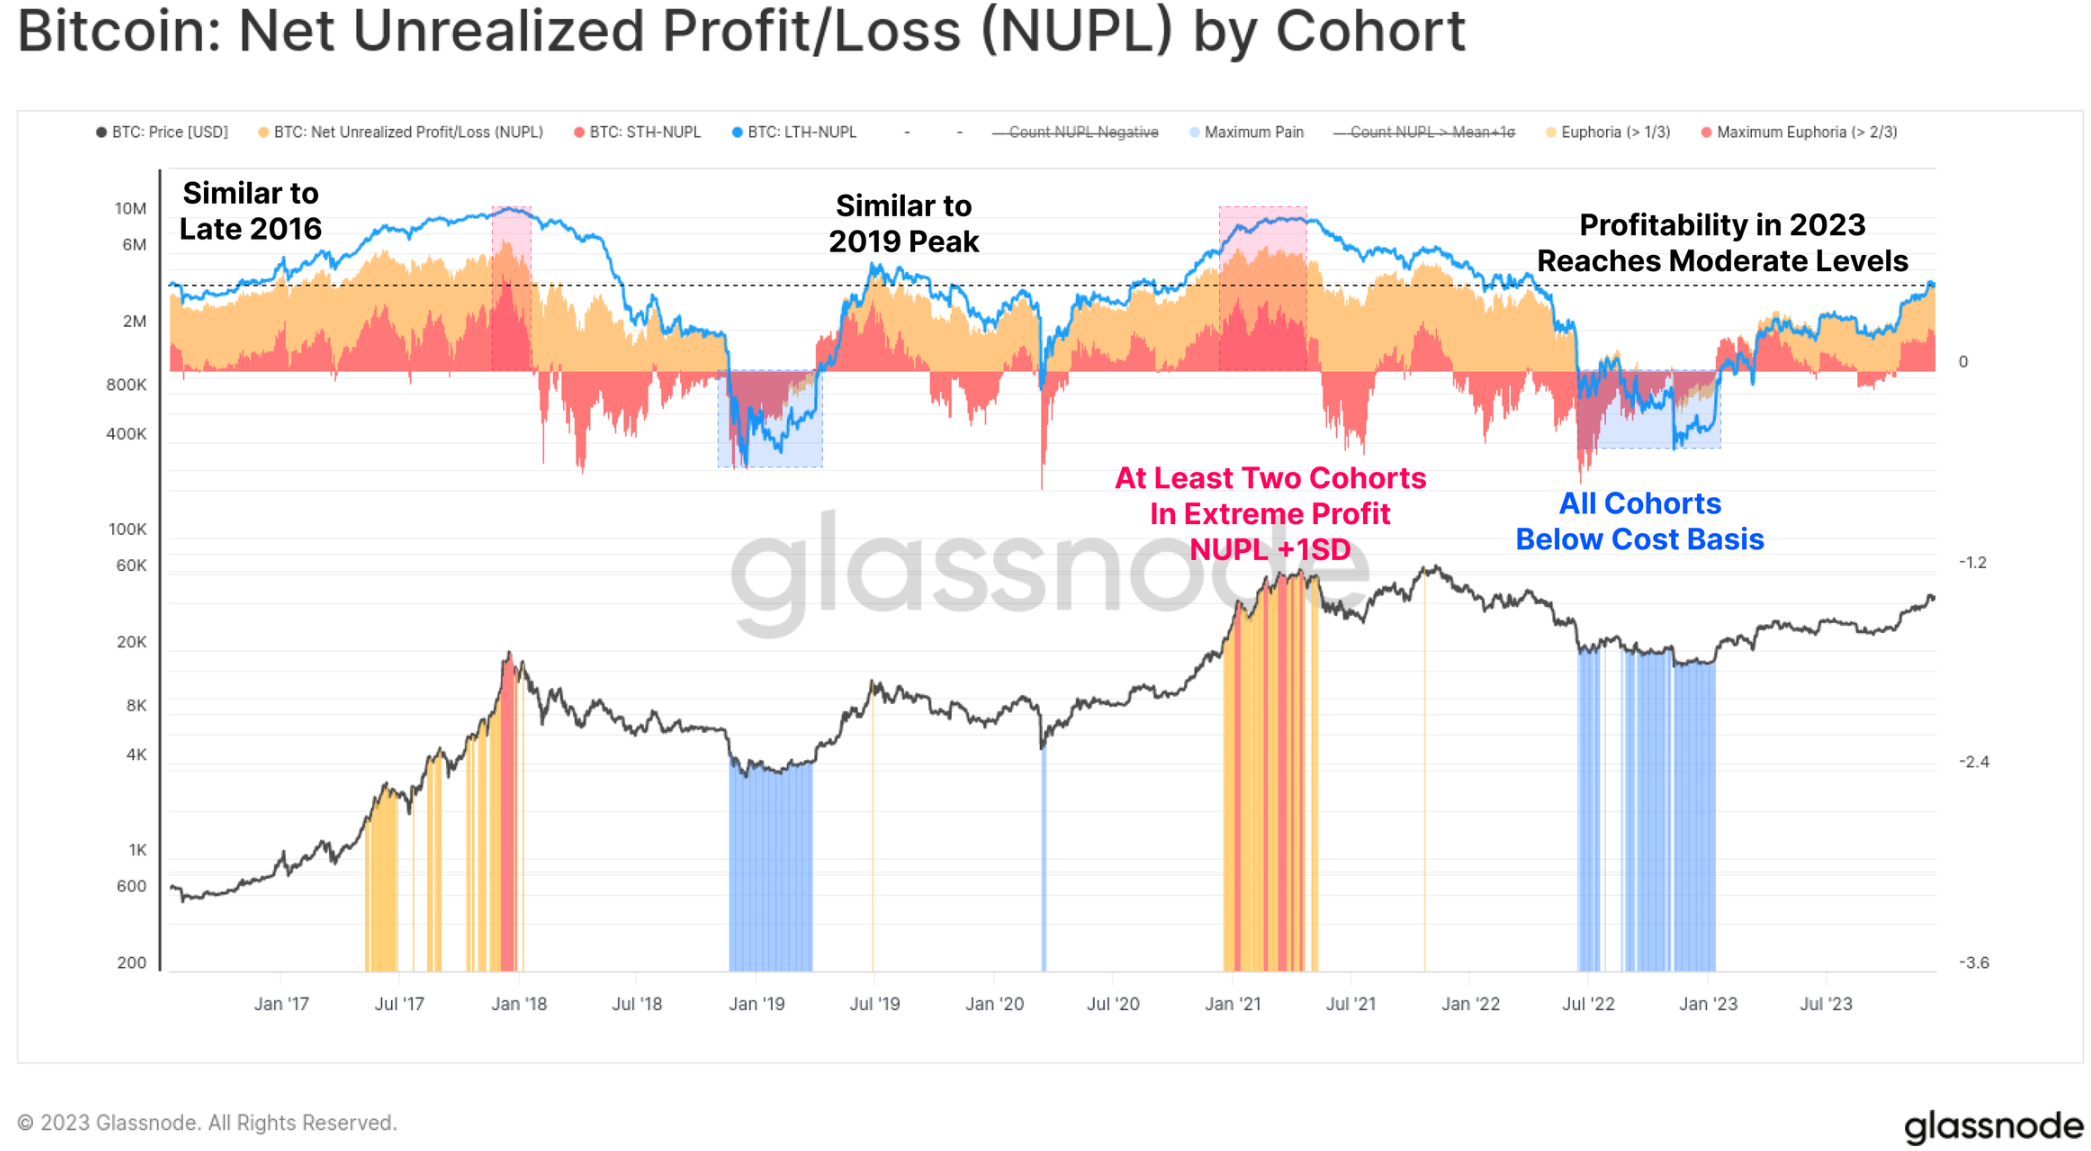
Finally, on the topic of investor profitability, 2023 will transform long-term holders, short-term holders and ordinary holders from unprofitable to moderately profitable. The NUPL metric for each cohort has not yet reached exciting highs, but is significantly above the respective cohorts break-even levels.
The maturing derivatives market
A striking feature of the 2020-23 cycle has been the emergence of futures and options markets as the preferred venue for price exposure and liquidity. 2023 is proving to be an important year in this maturation process, as the options market’s open interest has grown to rival or exceed the futures market in size.
Open interest for both currently ranges between $16B and $20B, with Deribit continuing to dominate the options space (90%+). This hints at growing institutional interest in Bitcoin, as traders and positions take advantage of the options market to deploy more sophisticated trading, risk management, and hedging strategies.

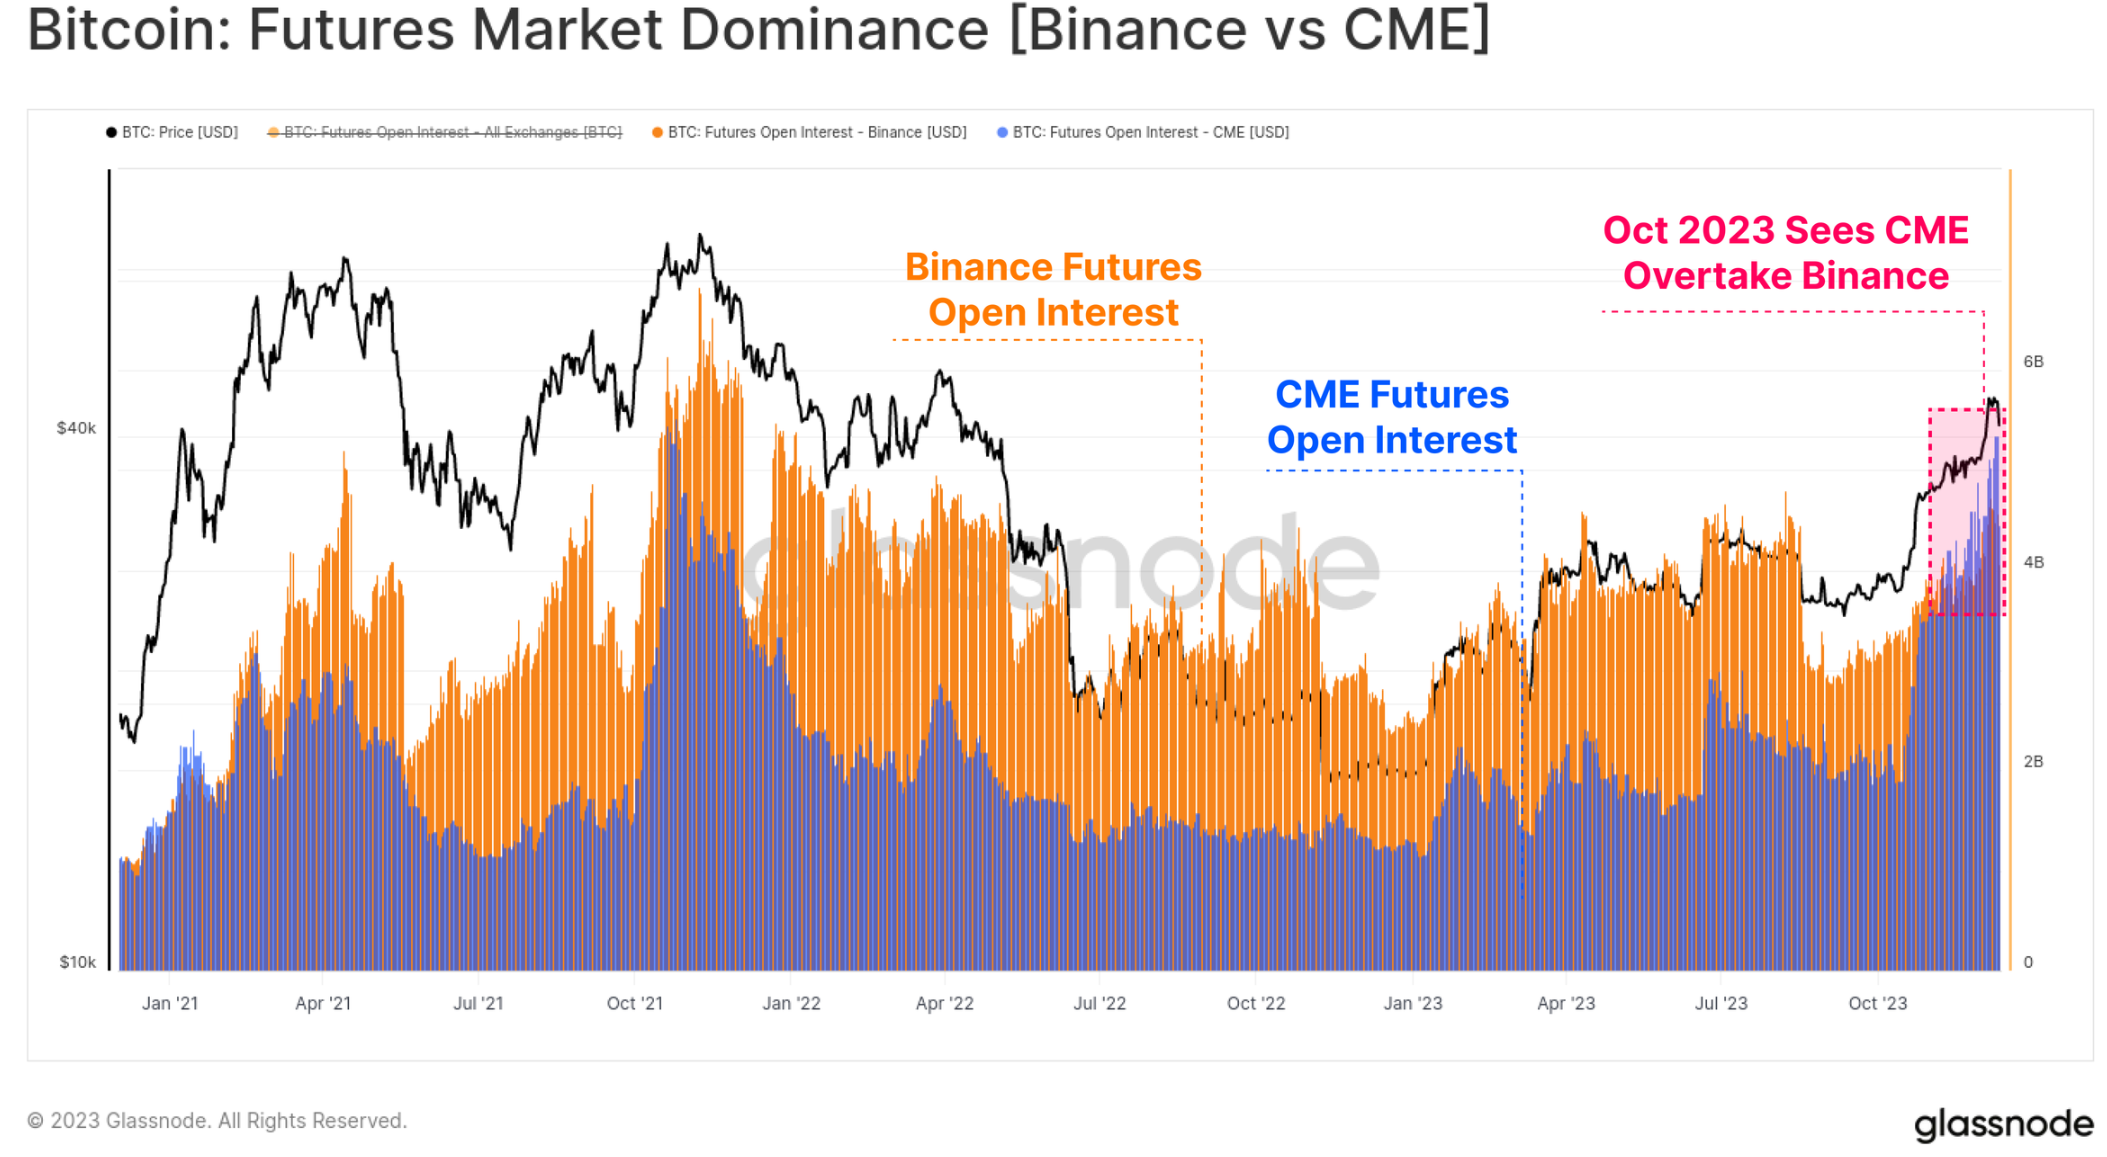
Within the futures market, there was also a noteworthy shift in dominance, with the regulated CME exchange holding more open interest than offshore exchange Binance for the first time in history. October once again appears to be an important moment for this phase of transition, suggesting an influx of institutional capital.
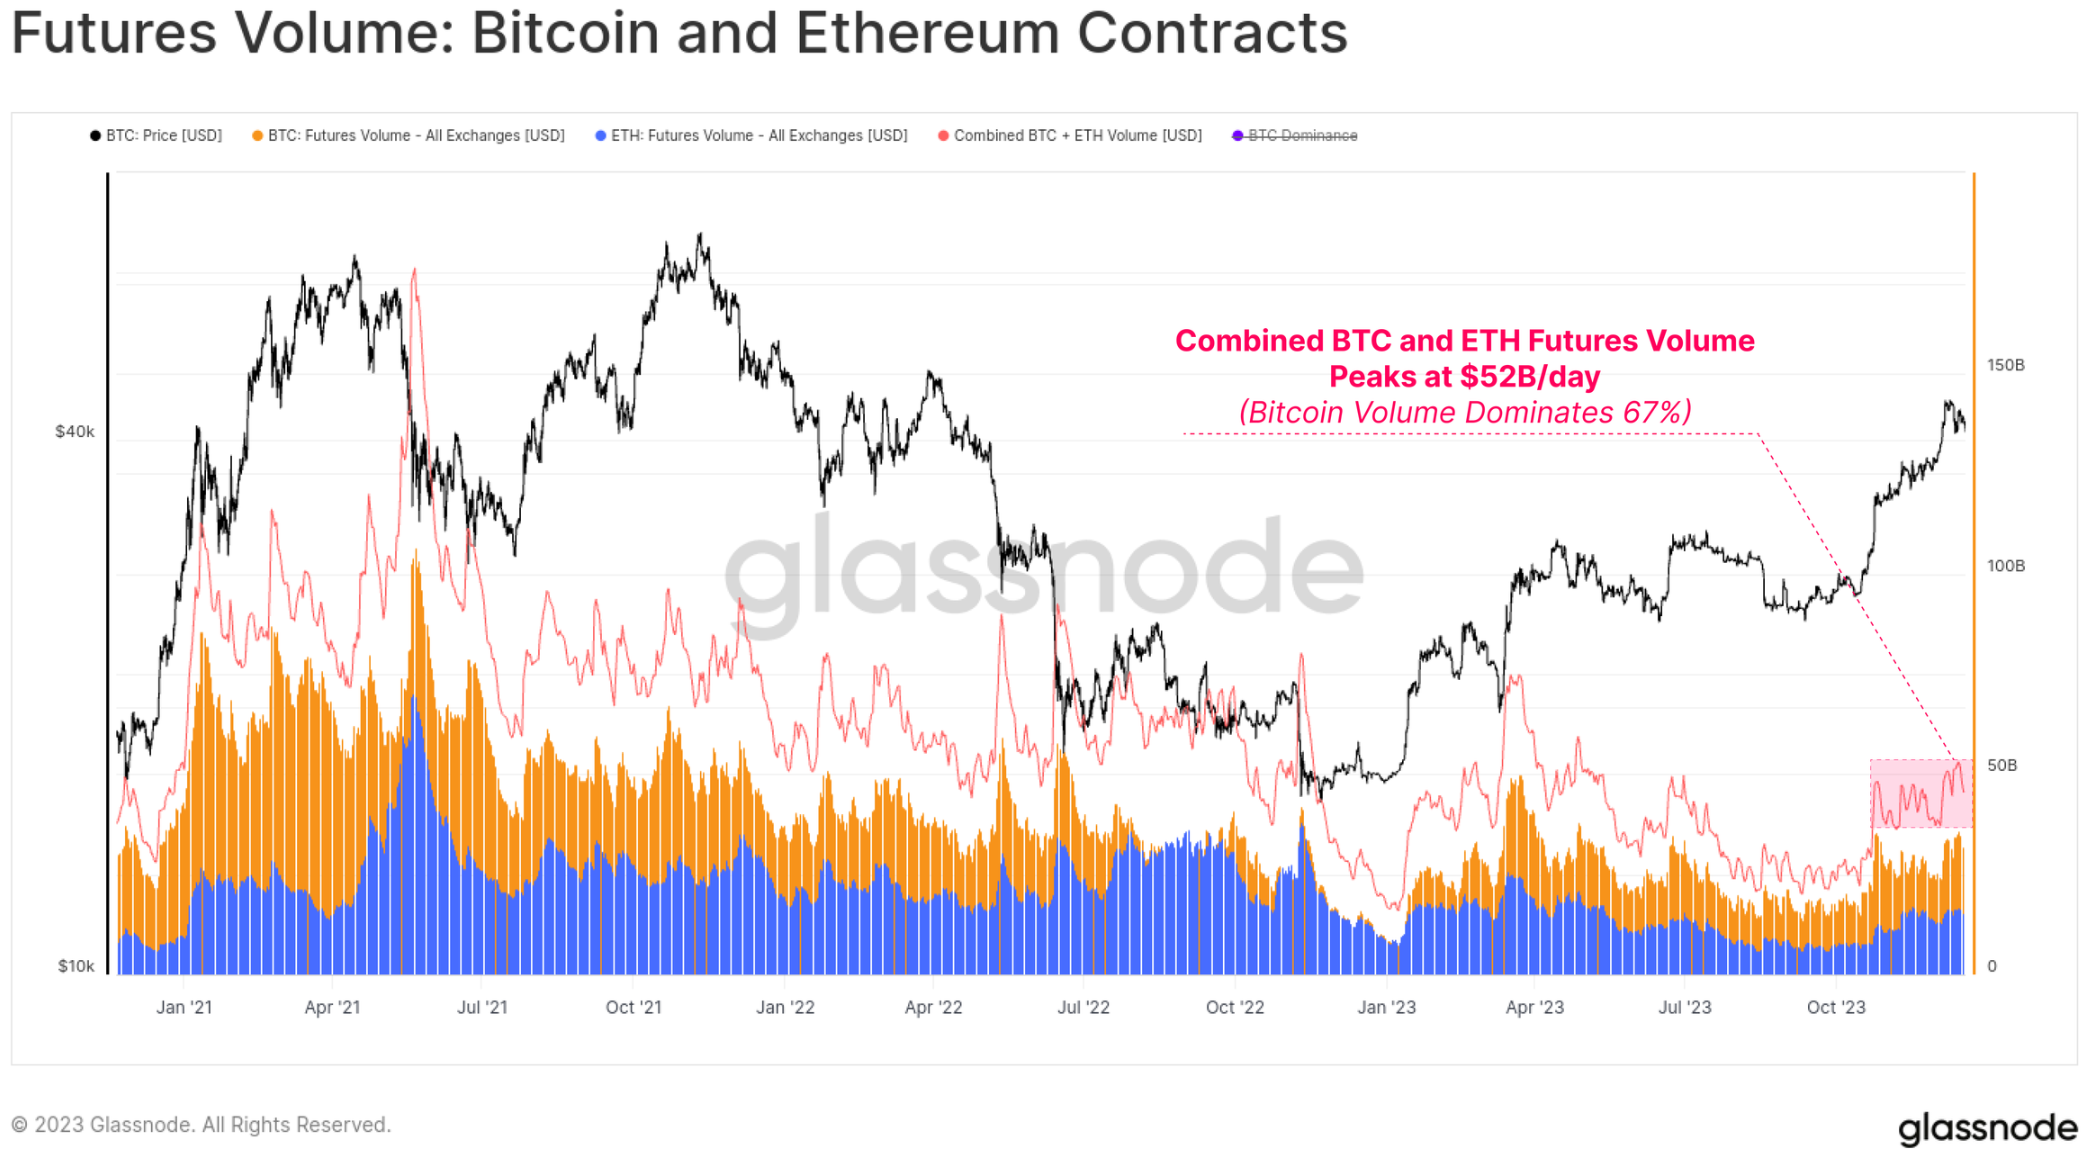
Futures trading volume for both BTC and ETH increased in October, with total daily trading volume at $52B/day. Bitcoin contracts account for about 67% of trading volume, while Ethereum contracts account for 33%.
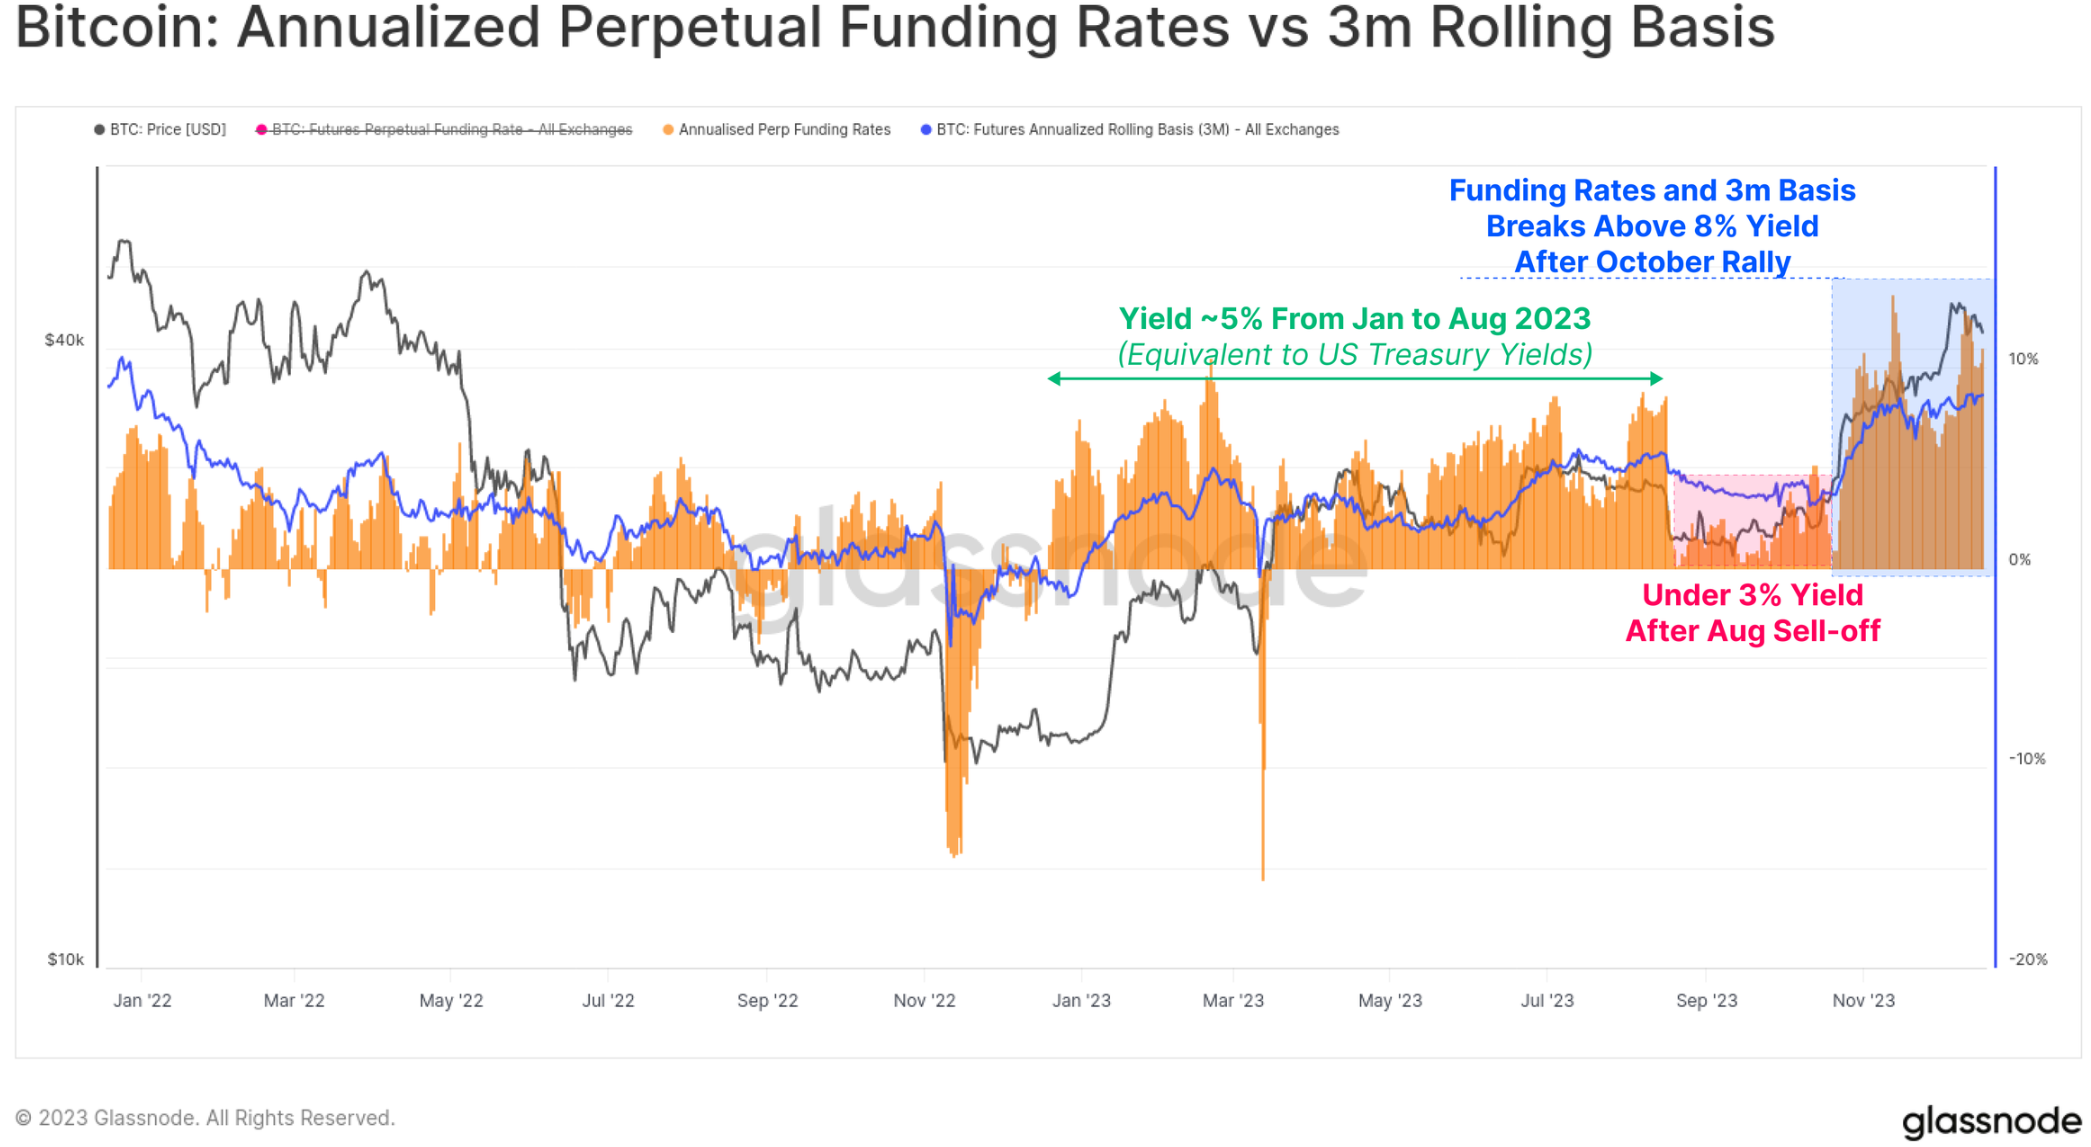
Cash and arbitrage yields in the futures market go through three distinct phases during the year, which also tells the story of capital inflows into the space:
From January to August, the yield fluctuated around 5%. This is largely in line with short-term Treasury yields, making it relatively unattractive given the additional risk and complexity of the trade.
From August to October, after a sell-off to $26,000, yields were below 3% and the volatility environment was surprisingly low.
Since October, the yield has exceeded 8%. With futures basis currently holding at 300 basis points above U.S. Treasuries, market maker capital is now motivated to return to the digital asset space.
Stablecoin supply
A relatively new phenomenon of the last cycle has been the outsized role that stablecoins have played in market structure, becoming traders’ preferred quote currency and a major source of market liquidity.
The total stablecoin supply has been declining since March 2022, down -26% from its peak, becoming a major headwind to market liquidity. This is due to a combination of regulatory pressure (the SEC charged BUSD with being a security), capital rotation (preferring U.S. Treasuries to interest-free stablecoins), and waning investor interest in a bear market.
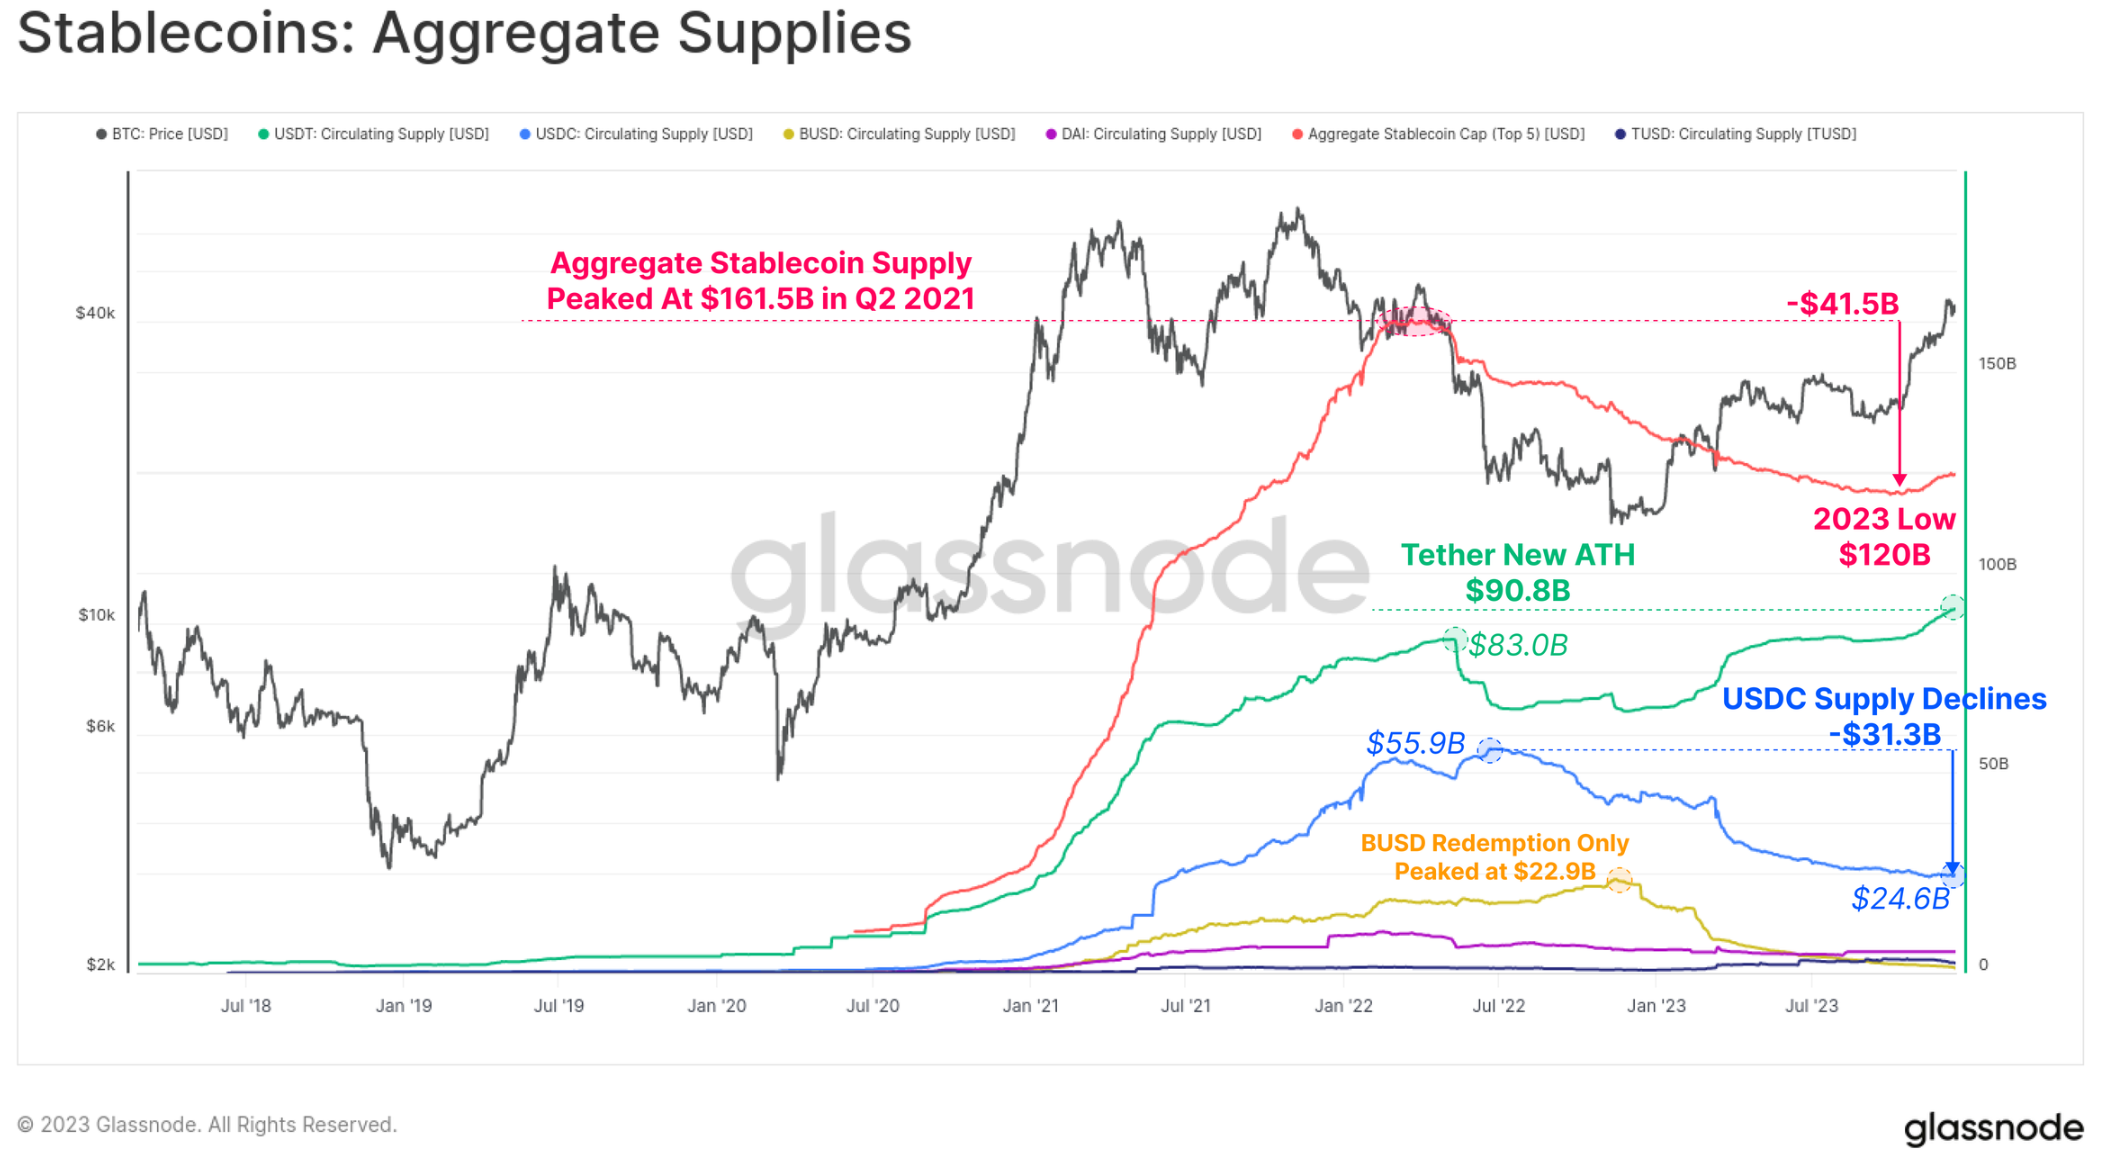
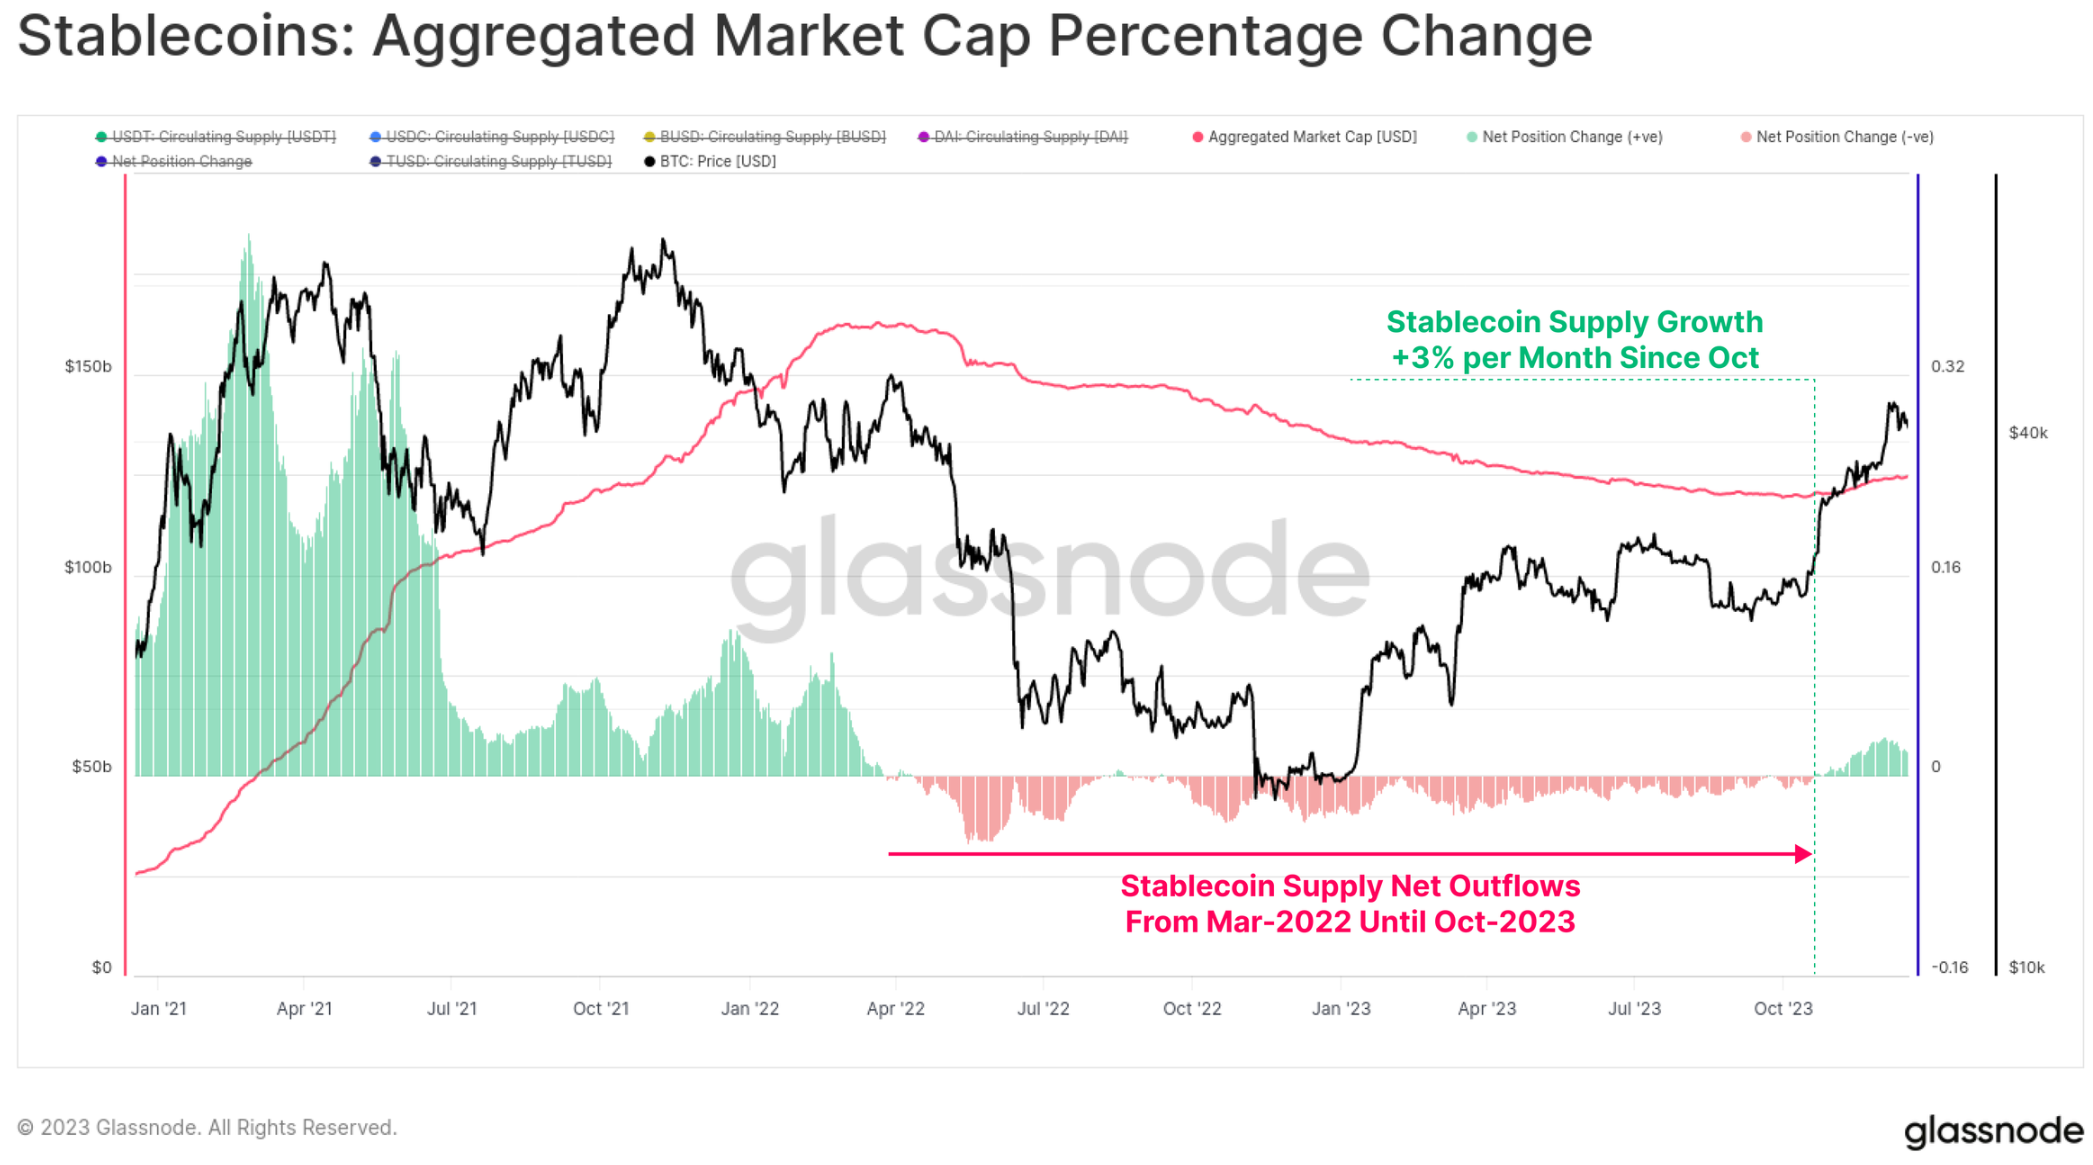
However, October was a critical point, with the total stablecoin supply bottoming out at $120B and supply starting to grow at a rate of up to 3% per month. This is the first expansion of the stablecoin supply since March 2022 and may also be a sign of returning investor interest.
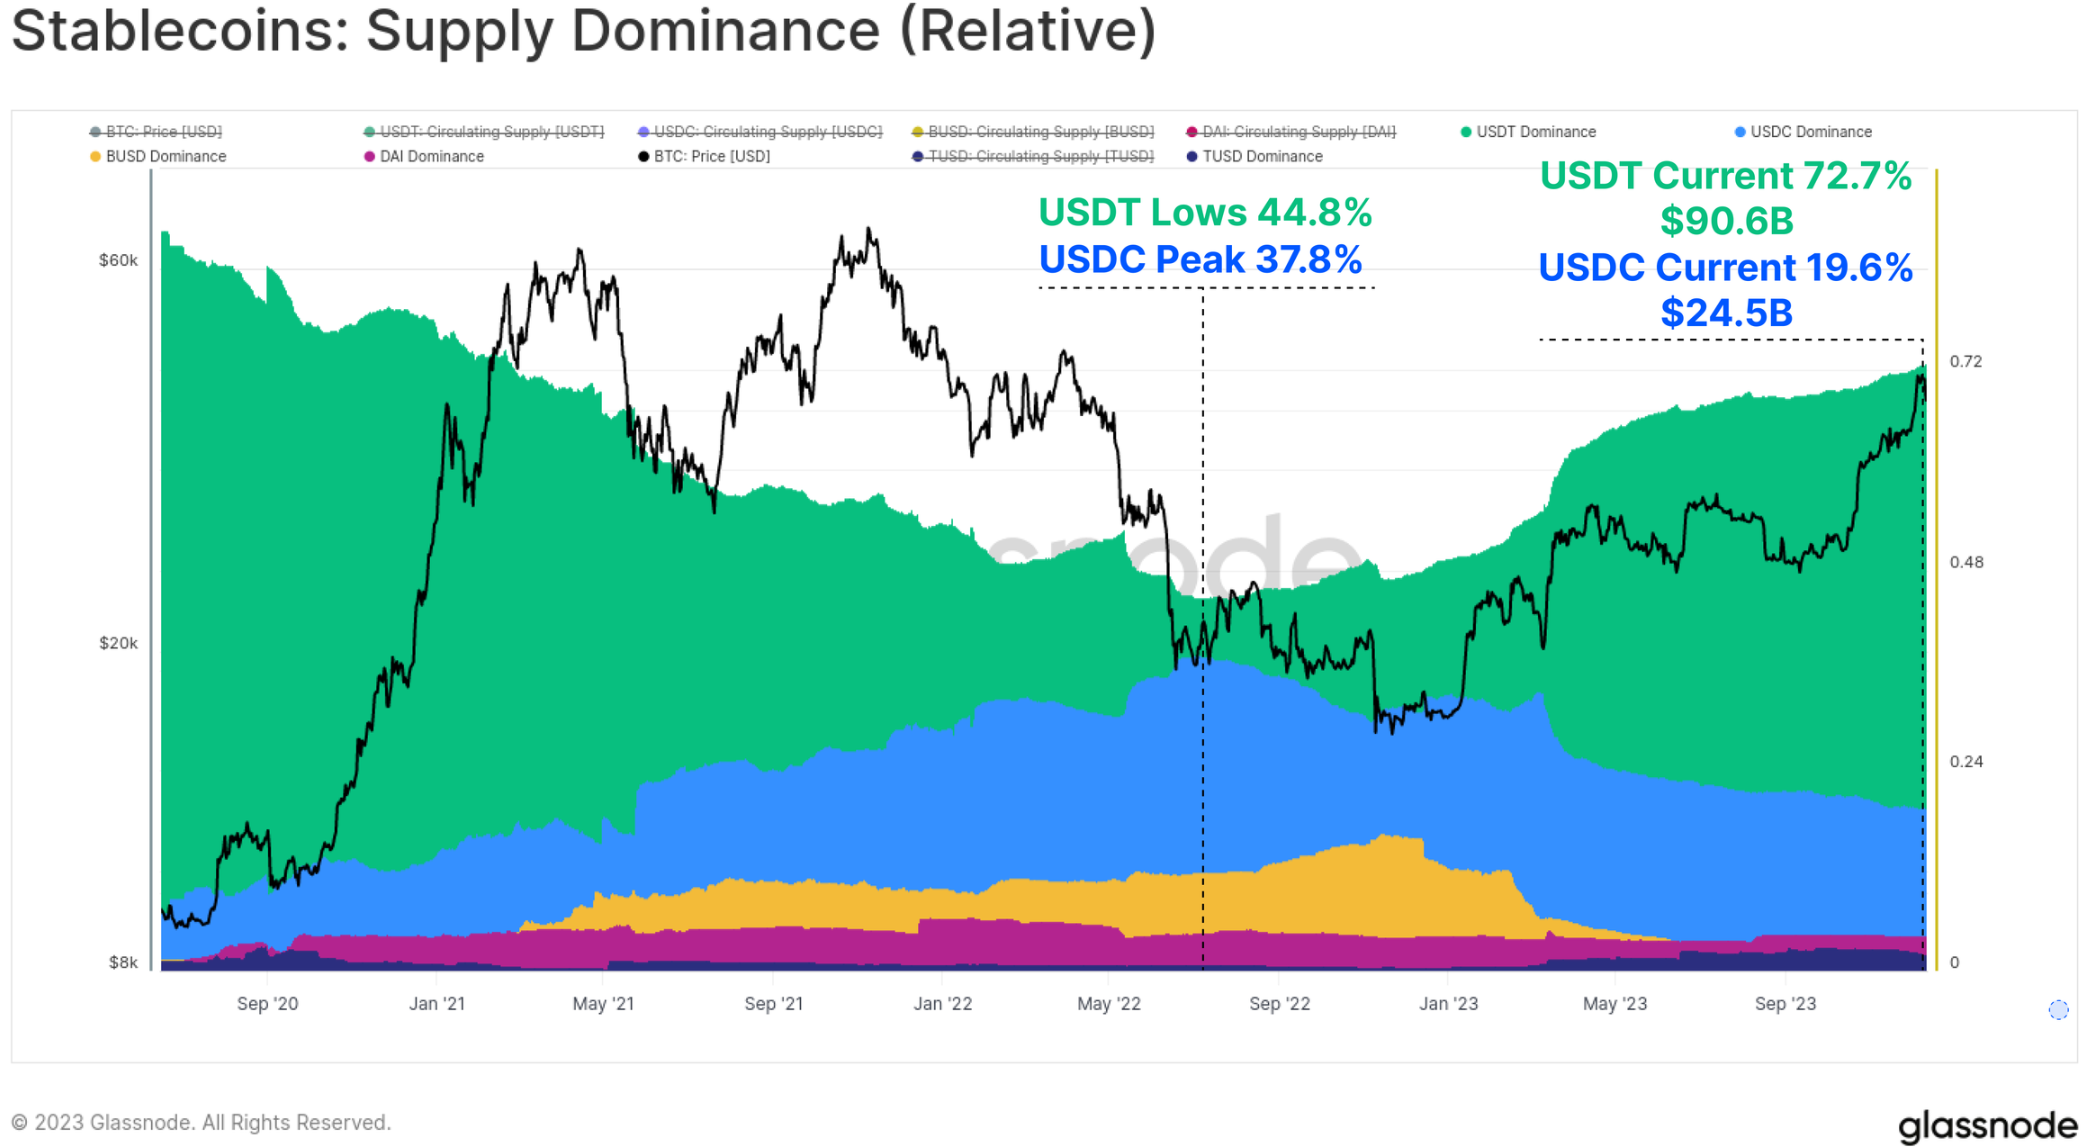
The relative dominance among the various stablecoins also changes significantly between 2022 and 2023. The dominance of previously rising stablecoins such as USDC and BUSD has shrunk significantly, with BUSD entering redemption-only mode, while USDC’s dominance has dropped from 37.8% to 19.6% since June 2022.
Tether (USDT) is once again the largest stablecoin with total supply climbing to over $90.6 B, taking 72.7% of the market share.
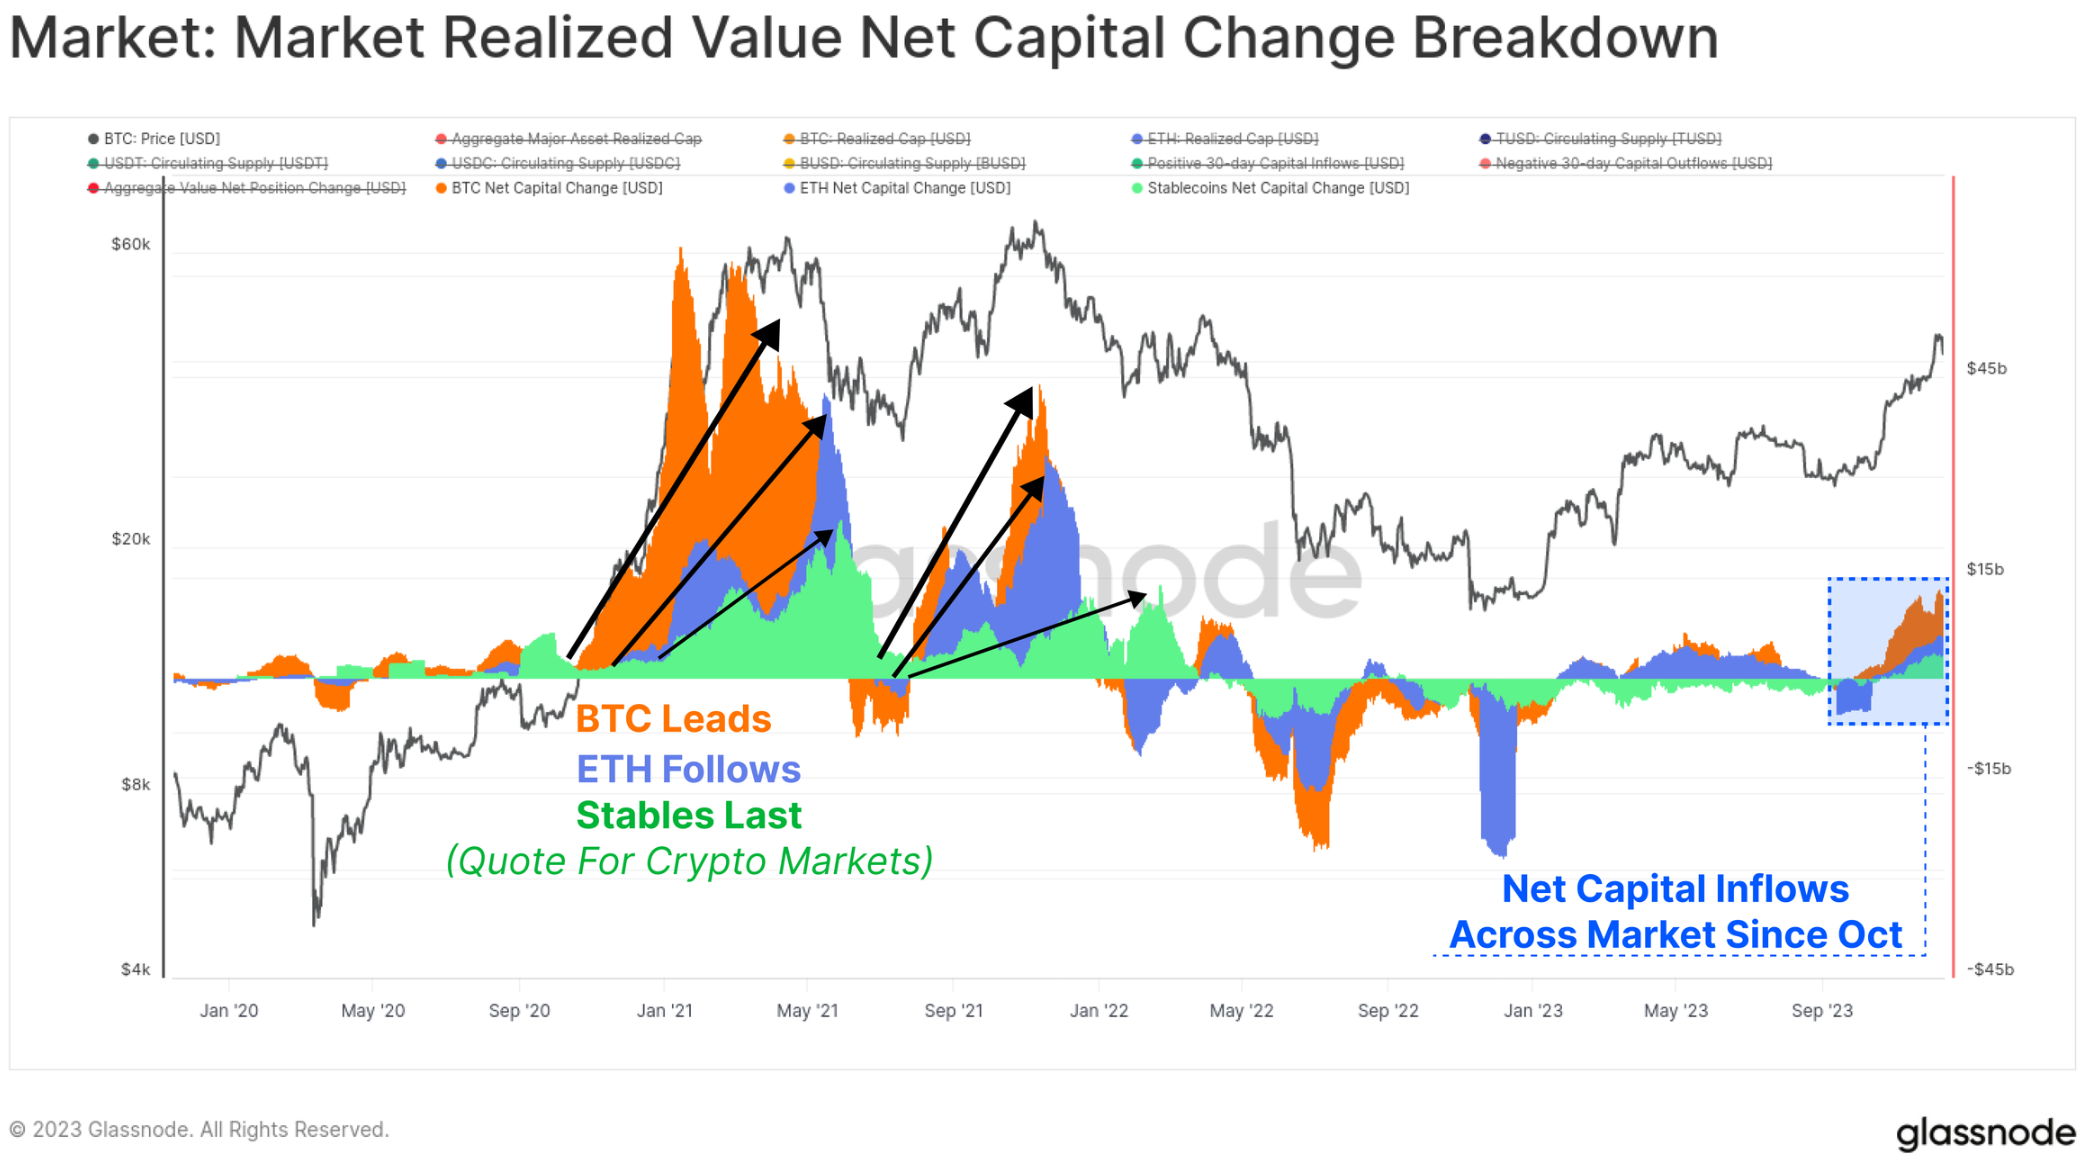
Finally, we can compare the 30-day change in the realized market cap of BTC and ETH with the change in the total stablecoin supply. These three indicators help visualize and measure relative capital flows and rotations between sectors.
October was once again a critical moment, with capital inflows across all three major assets turning positive, in line with the market breaking through the key $30,000 level, expanding institutional interest in the derivatives market, and net capital inflows across the three major digital assets.
Summary and conclusion
2023 is a very different year than 2022 with its devastating deleveraging and market declines. On the contrary, this year has seen renewed interest in digital assets perform well and see new on-chain artifacts emerge in the form of Bitcoin inscriptions.
The Bitcoin supply is currently tightly held by long-term holders, with most investors now holding profitable Bitcoins. With the launch of a US ETF in early 2024 becoming increasingly likely, and the Bitcoin halving due in April, the stage is set for an exciting year ahead.


