Unlocking a huge amount is coming soon, exploring the truth behind the data of BLUR
Original author:Original author:(Twitter: @riyuexiaochu)
according tohttps://token.unlocks.app/bluraccording to
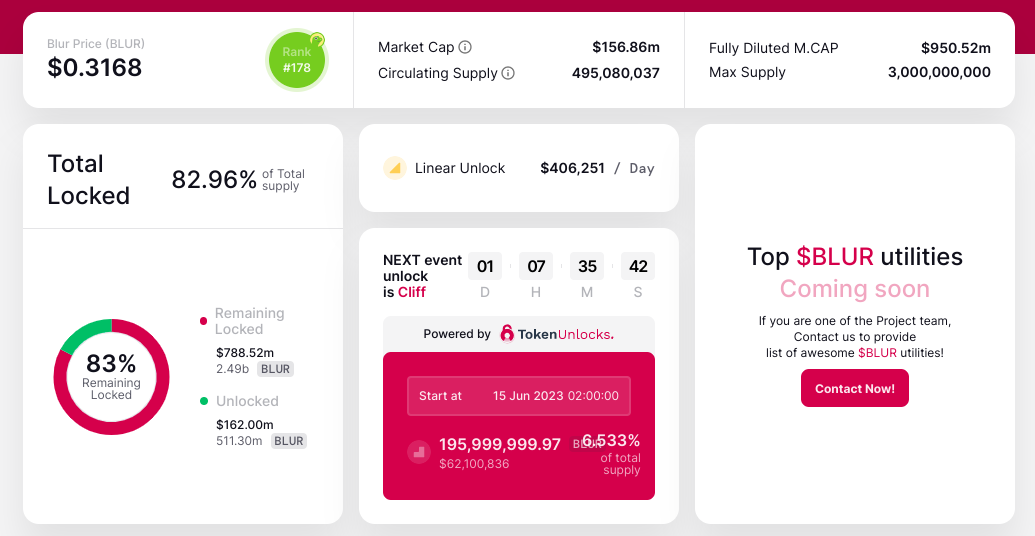
, Blur will unlock 6.5% of tokens after 1 day, with a market cap of nearly $62 M.
Concerned about Blur unlock impact? Let's look at these three dimensions together:
1. Analysis of Blur Retail Investors and Whale Holders
3. Active time of deposit and withdrawal of Blur
first level title
1. Analysis of Blur Retail Investors and Whale Holders
1. It can be seen from the figure that although the price of blur is falling, the number of users holding coins is increasing, including the number of large accounts (>100 k holdings).
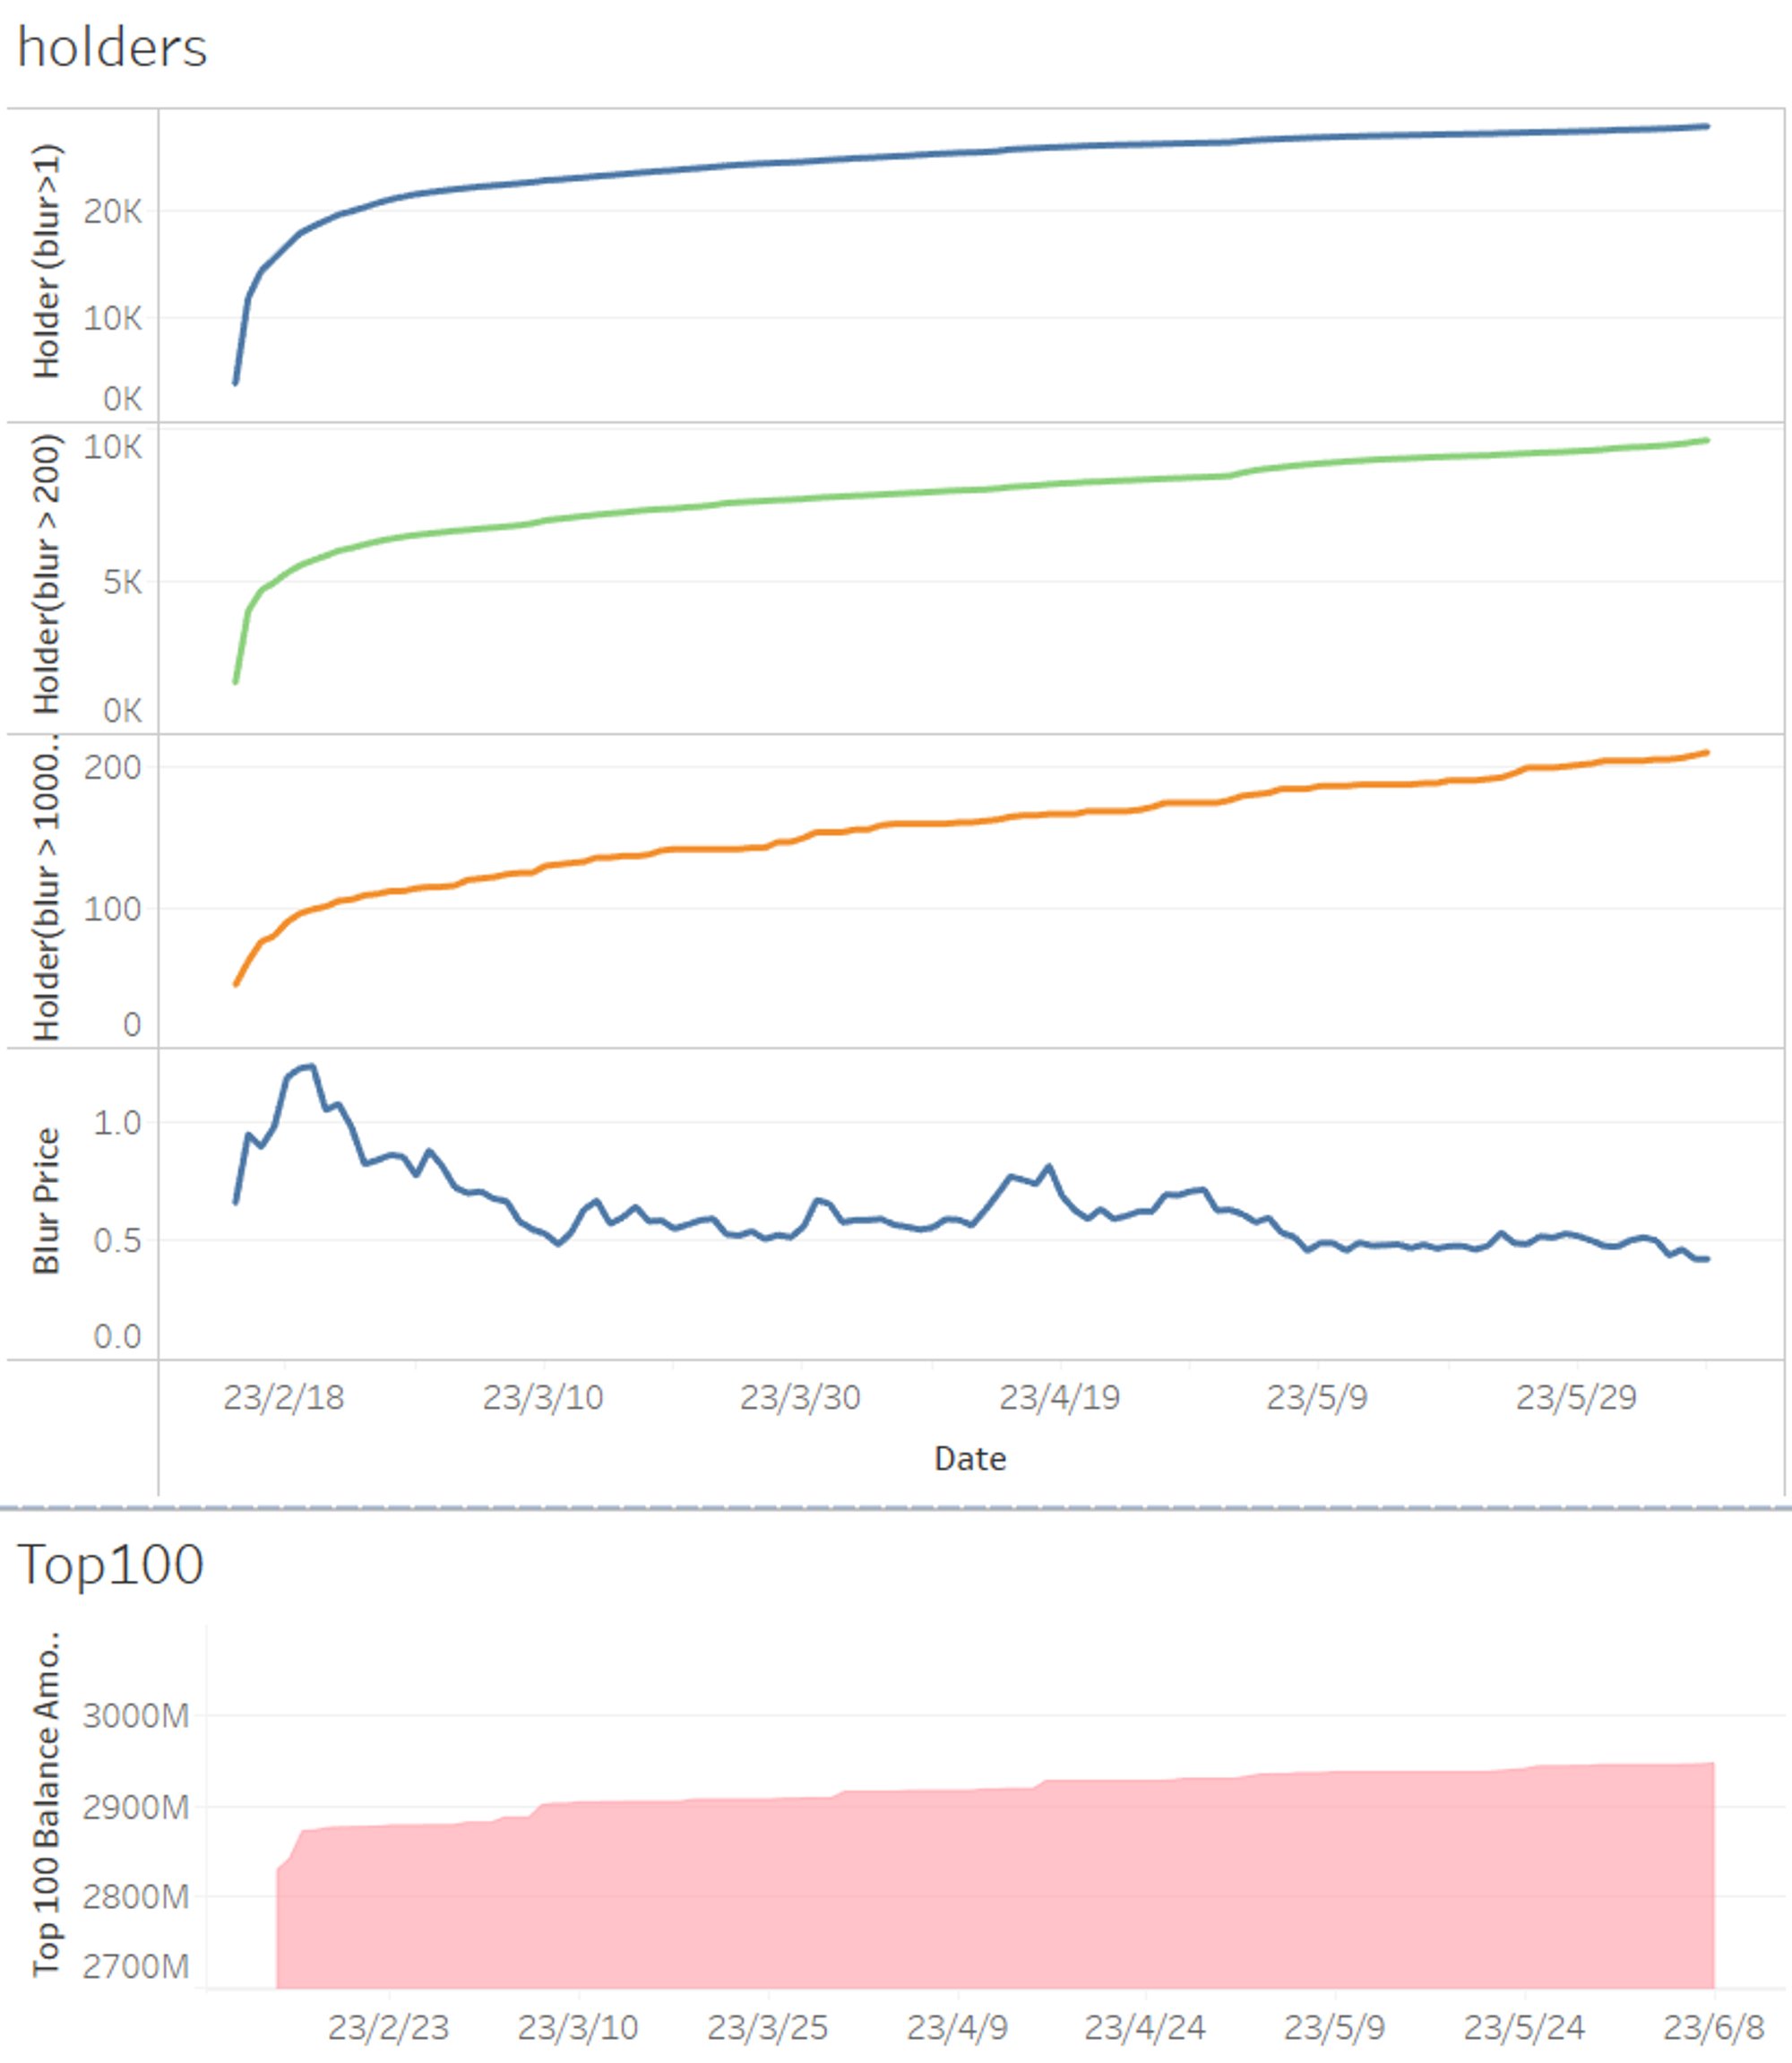
3. There are only 211 wallets holding more than 100,000 blur, excluding official wallets and exchanges. The real big players hold about 20 million blur. For the 430 million in circulation, the proportion of big players on the chain is too small. In other words, the big players in the market have not yet opened a large number of blurred positions. Summary: The price of Blur is mainly controlled by centralized exchanges and market makers. However, the big players on the chain did not form a consistent optimistic position.
first level title
2. The inflow and outflow of Blur on centralized exchanges
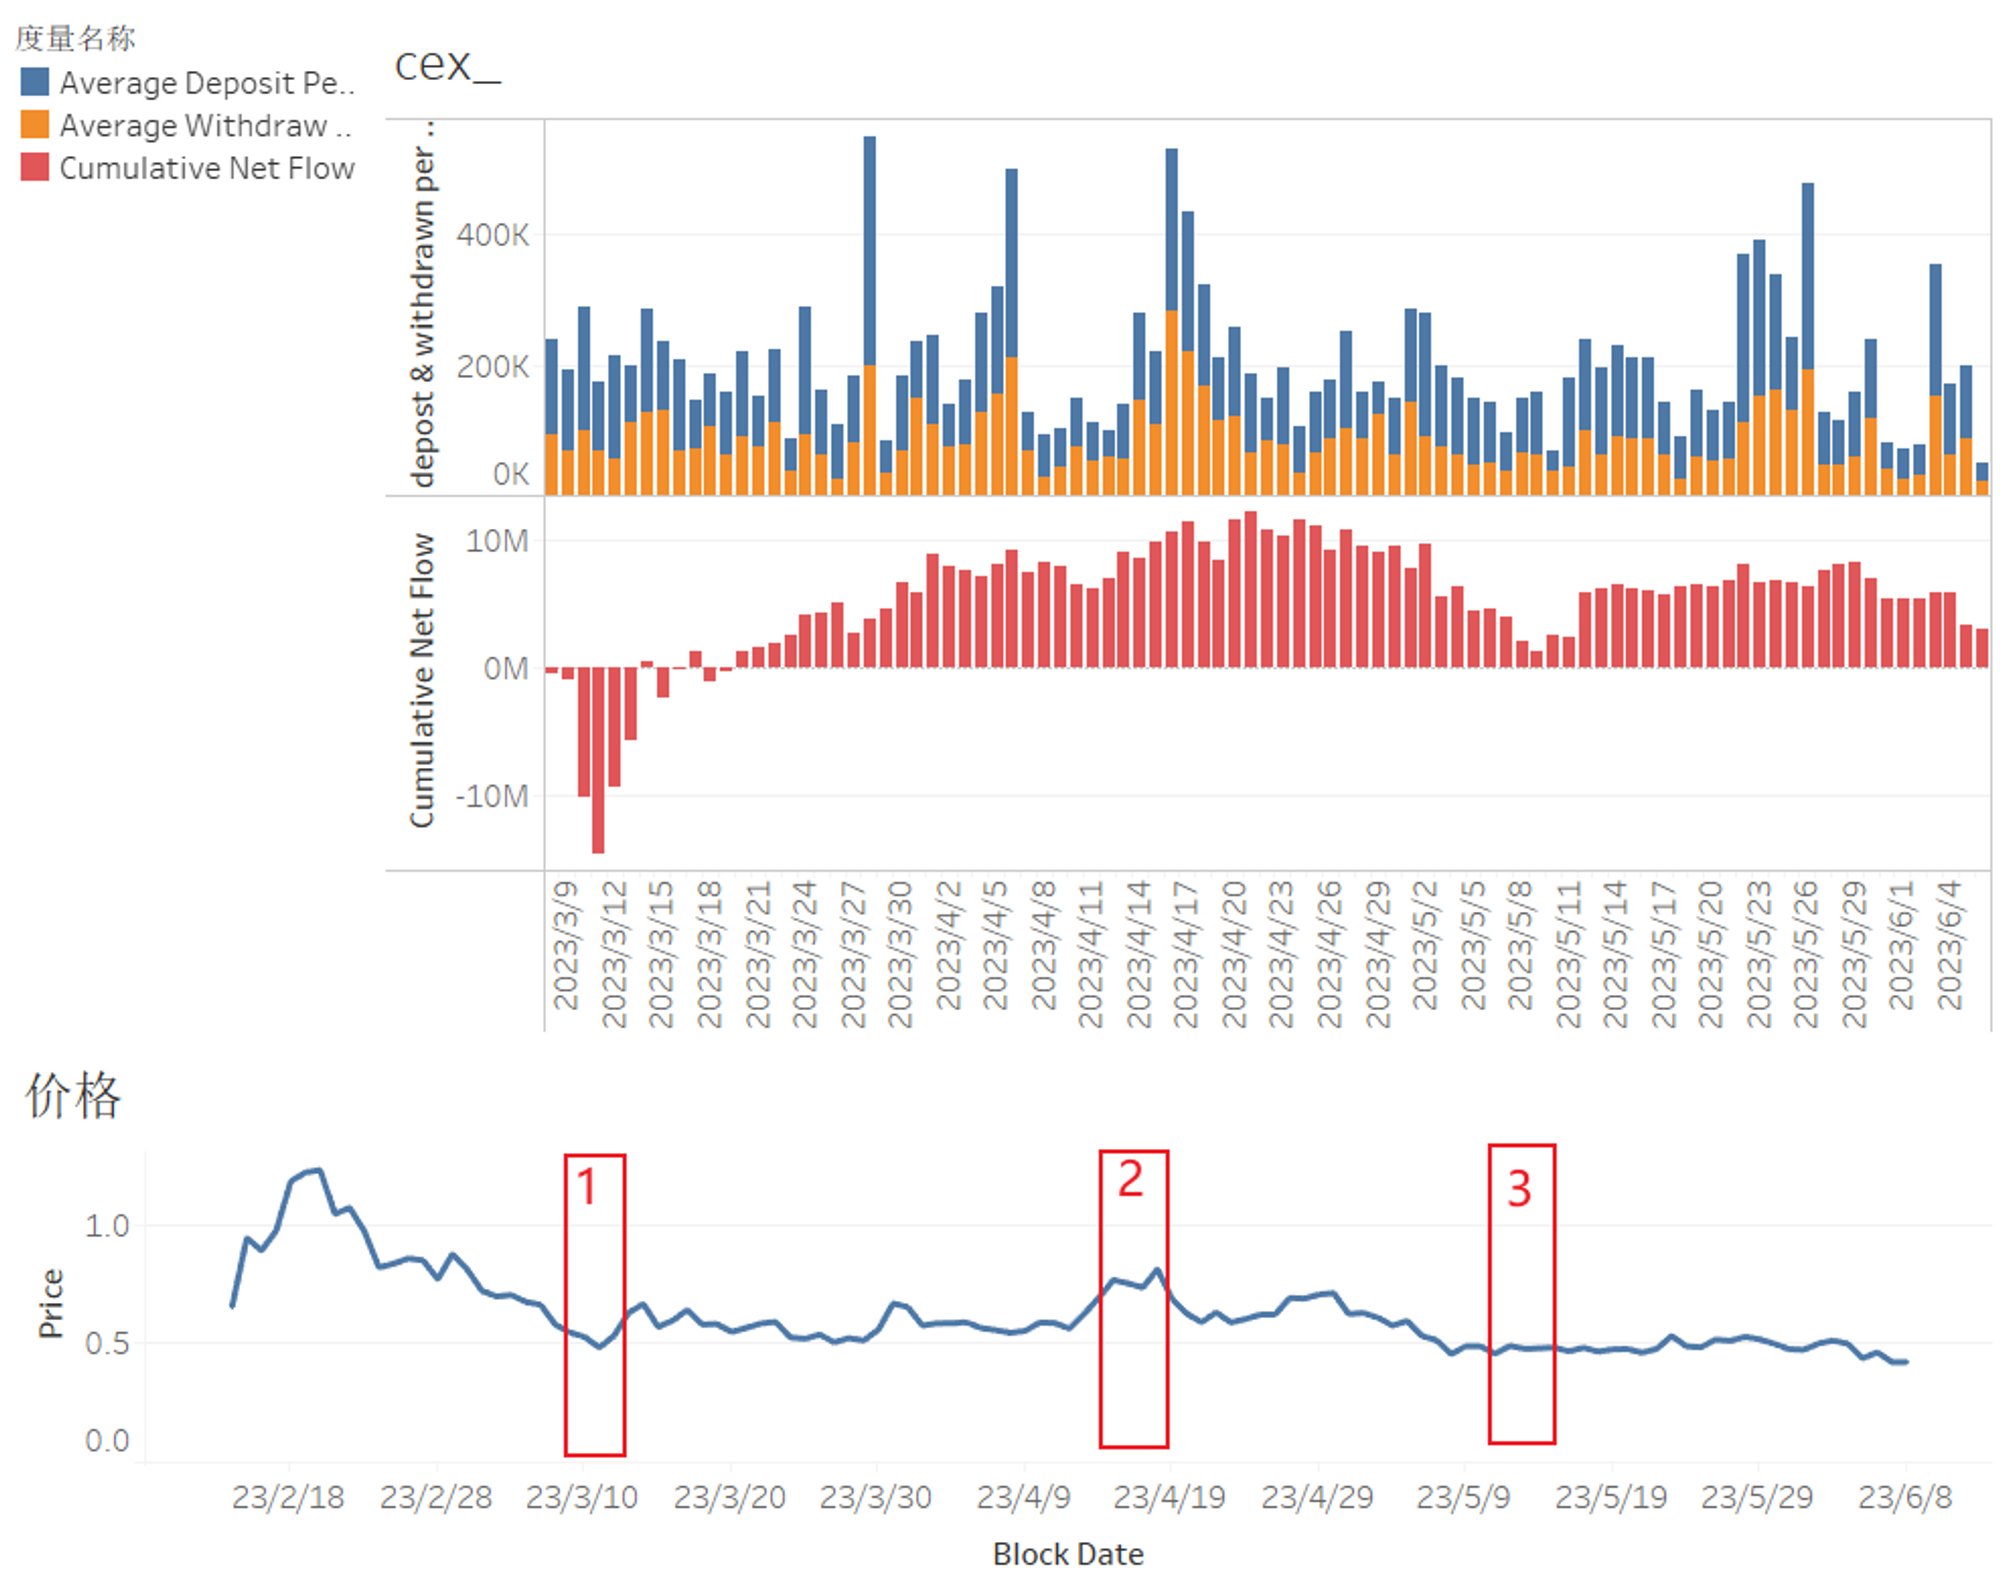
The blue and orange in the figure are the average amount of recharge and reflected blur for each address. If the value is relatively large (the column is relatively high), it means that the day is the operation behavior of a large trader. If the value is relatively small, it means that the amount of deposit and withdrawal is not large. The red graph is the amount of blur accumulated by the exchange for recharges and withdrawals. Negative values represent withdrawals, and positive values represent recharges.
It is very obvious to judge the price of Blur from the cumulative net flow of the exchange.
Red box 1: The exchange has continuous net outflows and the volume is very large. Blur rebounded after a series of sharp losses. The first blue orange data represents the average withdrawal/recharge Blur of a single address, which has a medium value. It shows that this kind of withdrawal is not the behavior of individual large accounts, but more addresses are withdrawing cash.
Red box 3: The exchange is flowing out, but it is much smaller than that on March 11. For the average address volume, it's not that big. It shows that retail investors are mainly outflowing. After that, although blur stopped falling, the rebound was not strong.
first level title
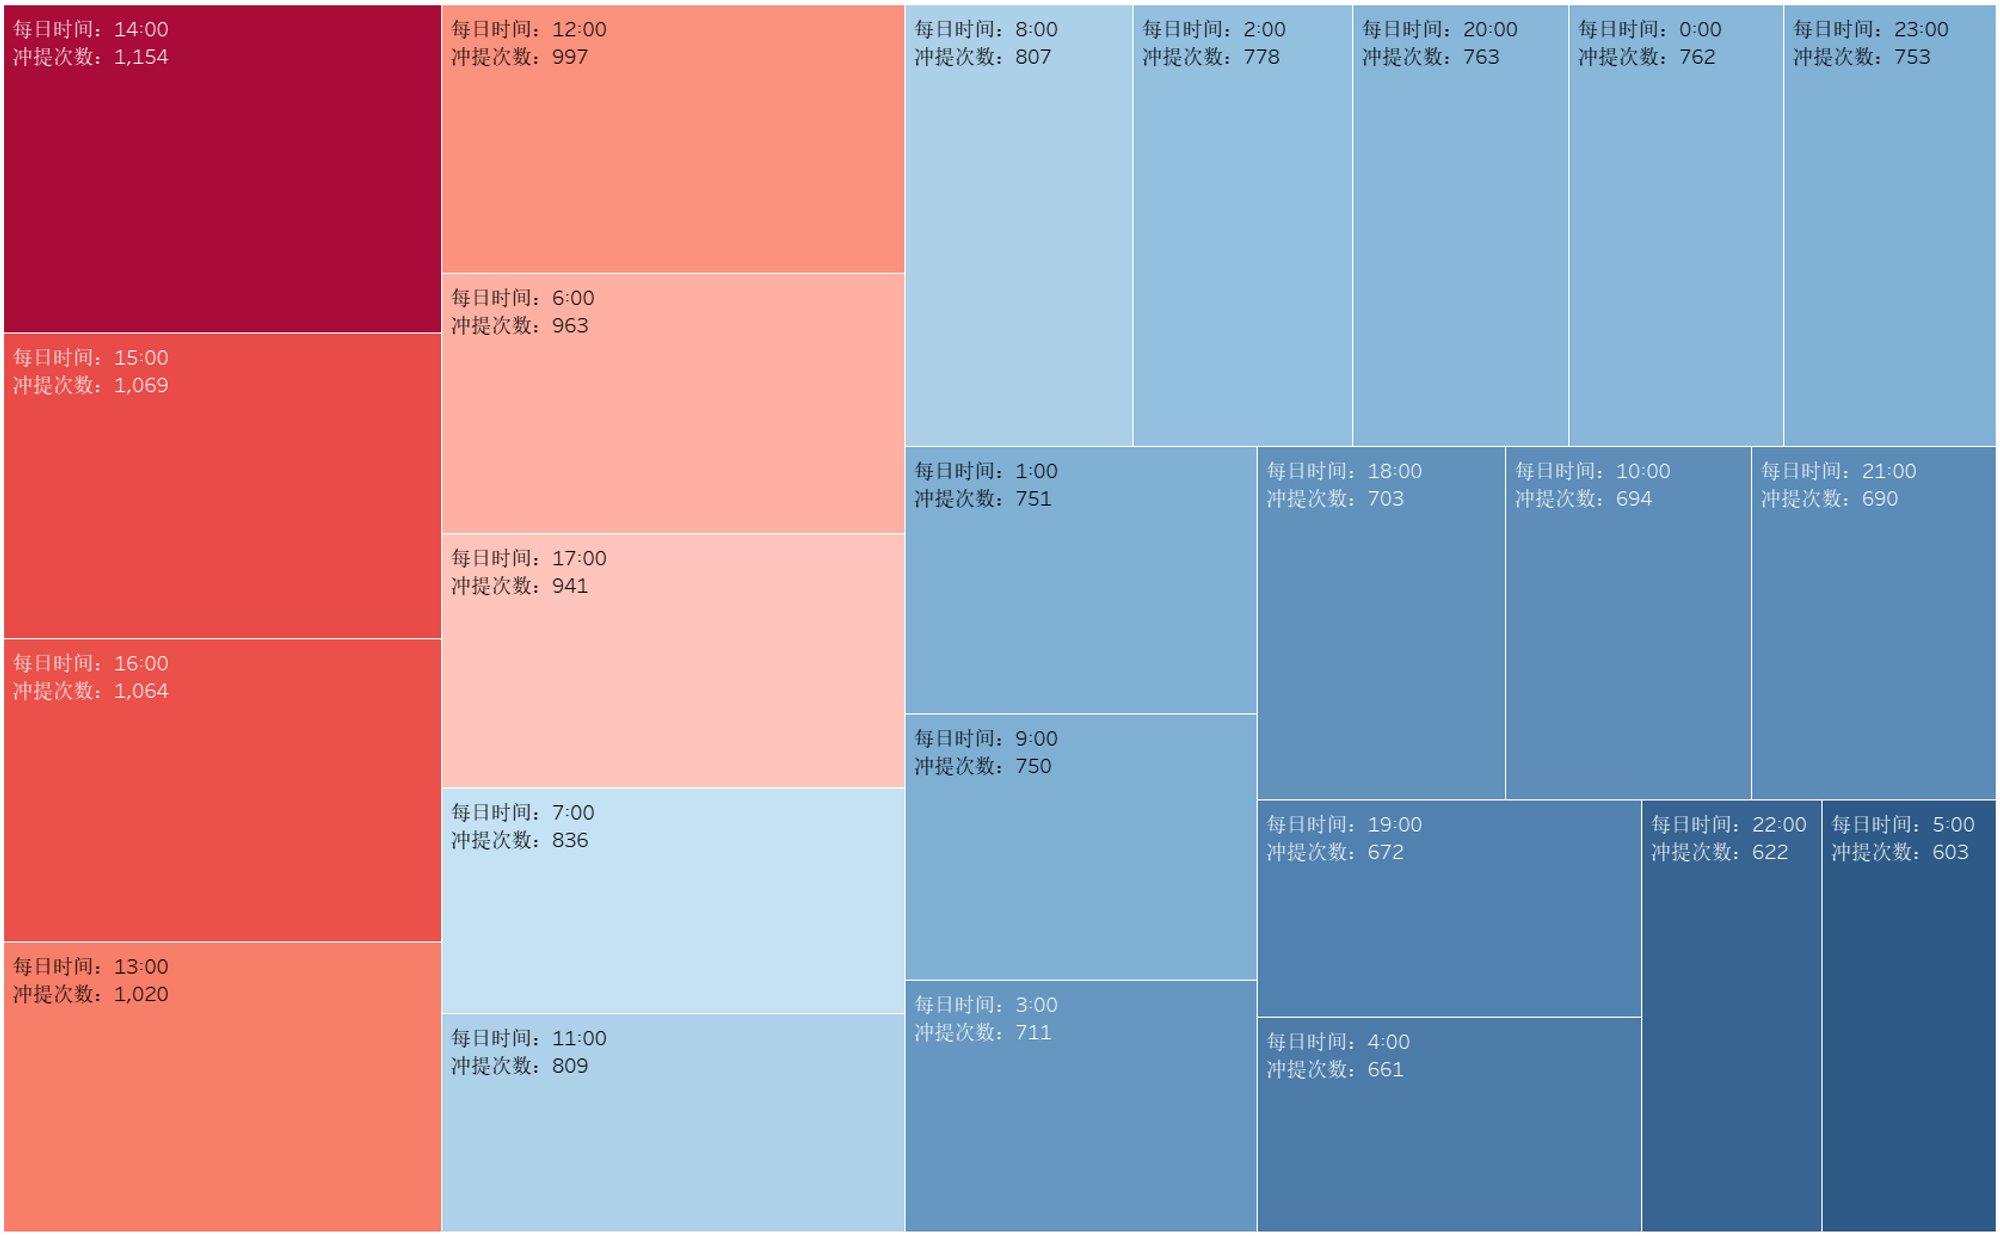
3. Active time of deposit and withdrawal of Blur
Blur's behavior on exchanges is mainly in Europe and the United States.