
LD Macro Weekly 2023/06/05: The fire of AI cannot be stopped

text
The debt ceiling crisis has been resolved, the non-agricultural data greatly exceeded expectations, bringing optimism, and the stock markets of developed countries led by the United States continued to soar;
The encryption market has also been driven by the optimism of the traditional market, but it has generally failed to recover the previous decline, which is obviously weaker than the stock market; if the AI track bubbles too quickly and falls into stagflation, this "dongfeng" may disappear ;
Stagnant nonfarm payroll growth could signal an easing of labor market tensions, with a possible lead-lag relationship between hours worked and employment;
The end of the $1.6 trillion student loan forgiveness program could have some impact on consumer spending by late summer;
The Fed is expected to pause in June, but further rate hikes could still come if Fed officials do not pay close attention to the negative impact on economic growth and credit tightening;
Equity funds saw their strongest weekly inflows in 17 weeks last week, with technology funds seeing record inflows;
Despite the market rally, the net long positions of large speculators in US stocks decreased slightly from the previous week;
The data shows that large speculators may have increased their spot positions to a relatively high level, but at the same time they have not given up their bearish protection. Although the net exposure is not high, the spot buying power may have been consumed a lot;
Since May, Ethereum has continued to perform better than Bitcoin due to weakening demand for alternative configurations, and the influence of supply and demand on prices has increased, while Ethereum is relatively deflationary;
With the debt crisis resolved, this week is relatively quiet, we will see more data on business spending, and pay attention to the impact of the launch of Coinbase's futures trading platform.
Weekly Market Review
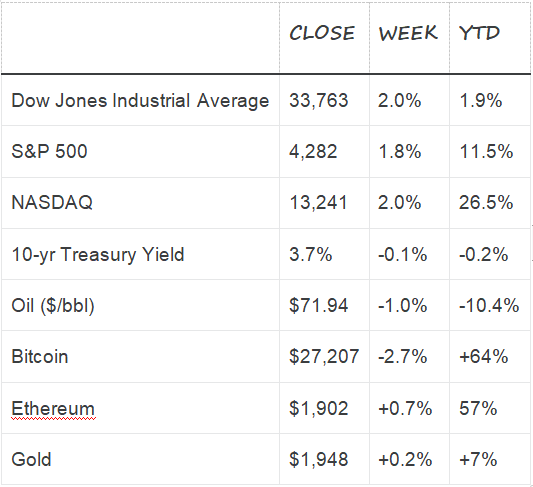
Last week, the global risk sentiment continued to heat up. The Fed’s interest rate hike was expected to be postponed for only one month, but the stock indexes of developed countries hit new highs, especially after the strong non-agricultural data on Friday, bond market yields rose sharply along with stock indexes , the VIX fell to pre-Covid levels, showing that market participants are very optimistic about the future economic outlook.
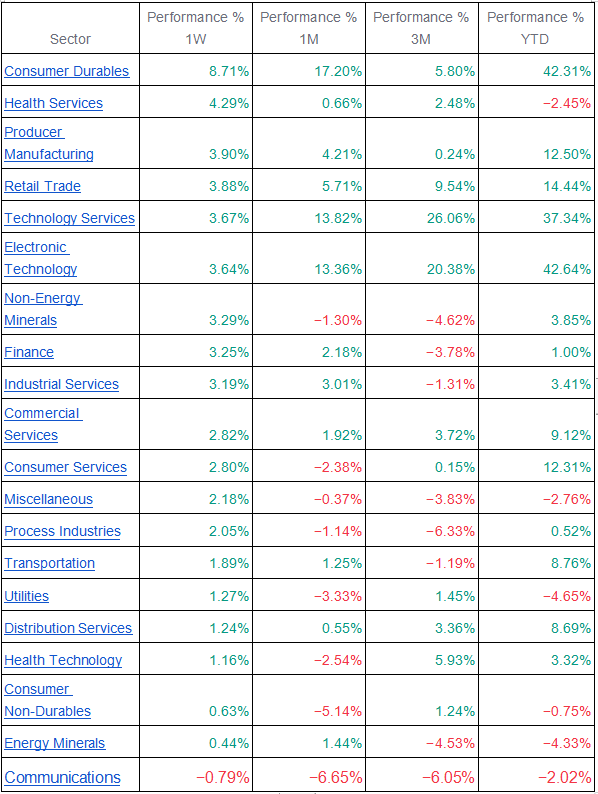
In terms of sectors, almost all sectors rose last week. The durable goods sector rose 8.7%, health services rose 4.3%, the popular electronic technology sector rose 3.6%, and defensive targets such as utilities and consumer staples sectors The increase is still relatively low, only 1.27% and 0.63%. It is worth noting that the rise of technology stocks lagged behind on Friday, and there seemed to be signs of potential sector rotation. Next week, we will pay attention to whether this rotation can continue. If it does, it is expected that the market optimism will last longer.
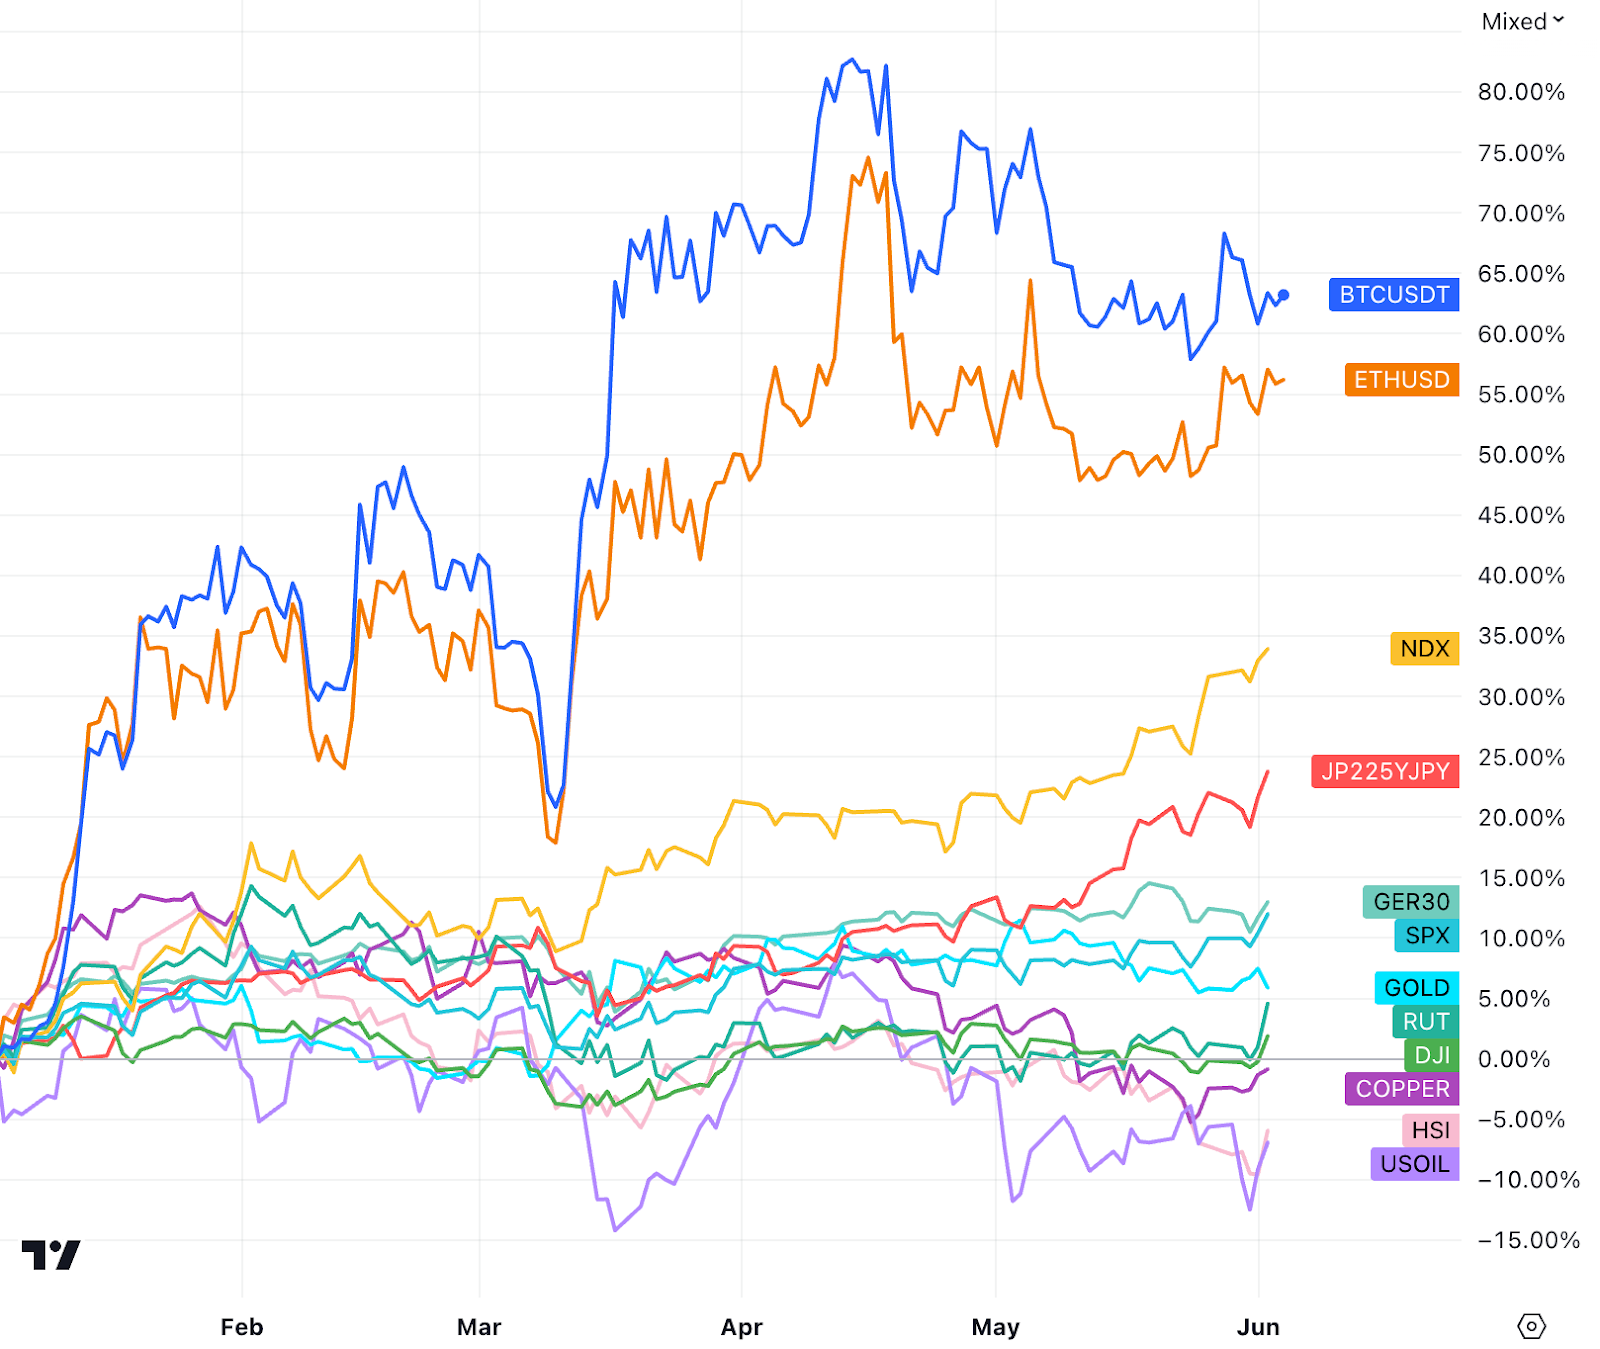
The digital currency market was also driven by the optimism of the traditional market and maintained a rebound on Friday and weekends, but overall failed to recover the previous decline, which is obviously weaker than the stock market.
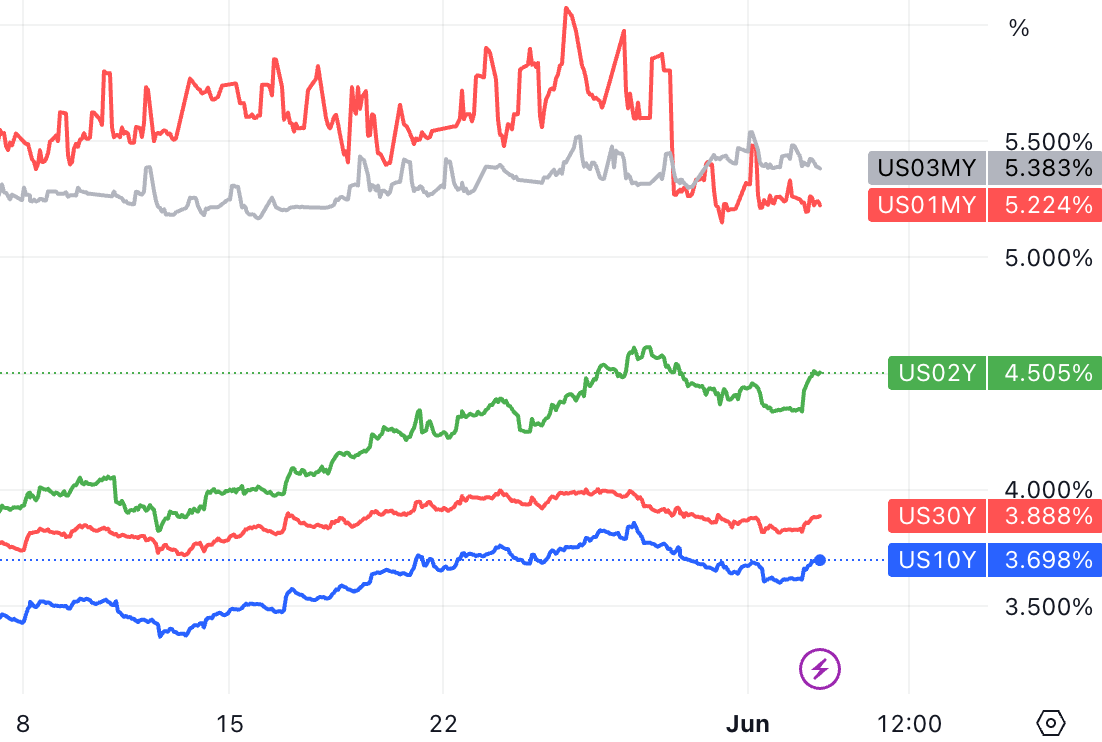
With the economic data and Fed officials’ speech on raising terminal interest rates, the yields of 2-10-year treasury bonds rebounded significantly in the second half of last week. Little changed from week to week.
Five months have passed since 2023. The U.S. stock market has been divided into three stages this year. The oversold rebound in the market from January to February, the rise in risk aversion in the banking crisis in March, the suppression of the debt ceiling crisis in April-May, and the 5 Monthly risks gradually cleared and most of the quarterly reports exceeded expectations.
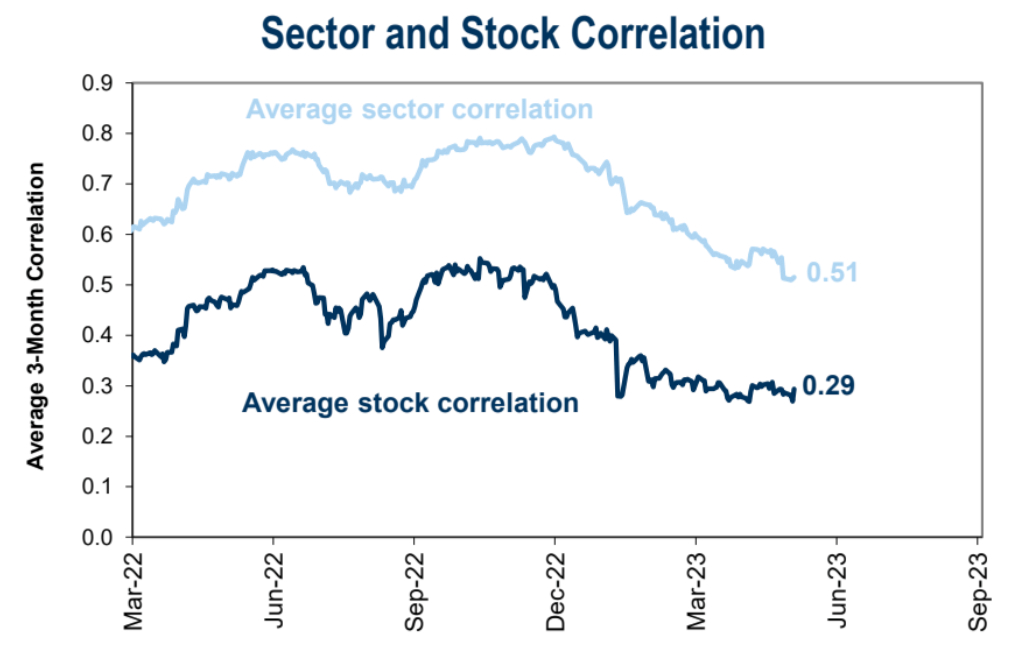
The current environment has higher requirements for Stock Picking. As of last week, the average 3-month correlation among S&P 500 constituents fell to 29%, the lowest level in more than a decade:
The progress of macro events last week:
Debt Ceiling Crisis Resolved: Both Houses of the United States successfully passed a budget agreement, avoiding the risk of hitting the debt ceiling and possible default. Compared with the 2011 crisis, this time the agreement appears to be much lighter on fiscal constraints, with federal spending reduced by only about 0.2% of GDP for the next fiscal year, which begins on October 1.
Fiscal Policy Implications: The latest budget deal could mean higher borrowing by the Treasury in the coming months. As borrowing increases, liquidity may be drawn from the banking system, which could pose some challenges for the Fed. In addition, the end of student loan forgiveness may have some impact on consumer spending later this summer.
Impact of restarting student loan repayments: Student loan debt in the U.S. surpassed $1.6 trillion in the first quarter of 2023 and is expected to face two kinds of uncertainty over the summer. First, repayments on federal student loans will resume at some point. The scheme, which began during the pandemic, has been extended eight times, including deferring payments and suspending the accrual of interest. Under the latest policy, unless extended again, the program will end on June 30 and payments will resume 60 days later. The second uncertainty is about whether the government's policy, which is seeking to forgive $10,000 to $20,000 of student loans for most borrowers, is now blocked in court.
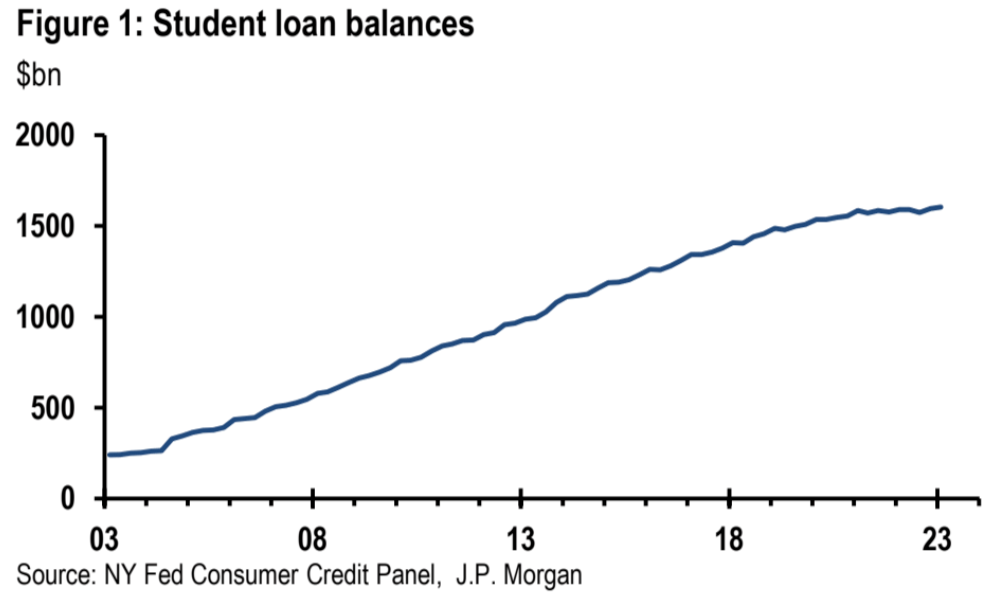
When student loan payments resume, this will reduce household savings and could be an additional drag on consumption. The program has reduced personal interest payments (a portion of personal spending) by $37.8 billion per quarter over the course of its operation, according to US BEA data. Assuming the borrower saves all of the monthly payments, this implies a possible small boost to the personal savings rate, about 0.2 percentage points, during the interest-free period. Of course, individuals may have used some of their savings to spend additionally, thus lowering their spending when payments resume. This reduction in consumption could amount to 0.1% of GDP, according to JPM estimates.
Fed likely to maintain status quo: Expectations for another Fed rate hike have been building in recent weeks, but vice chair nominee Jefferson pushed back on that notion in a speech Wednesday. He said the Fed's decision to keep its policy rate unchanged at its upcoming meeting should not be read to mean that we have reached the peak interest rate for this cycle. Instead, a rate hike that skips a meeting would give the committee more time to watch the data before making a decision on further policy tightening.
The Fed's pause in June could have a positive impact on financial markets, with the FOMC meeting on June 13-14 the next key moment, with several members expected to call for further rate hikes, which could even translate into dissenting votes.
However, we expect that in the next few weeks, if Fed officials do not pay close attention to the negative impact on economic growth and credit tightening, according to the current situation, further interest rate hikes will still come.
Important data review of last week:
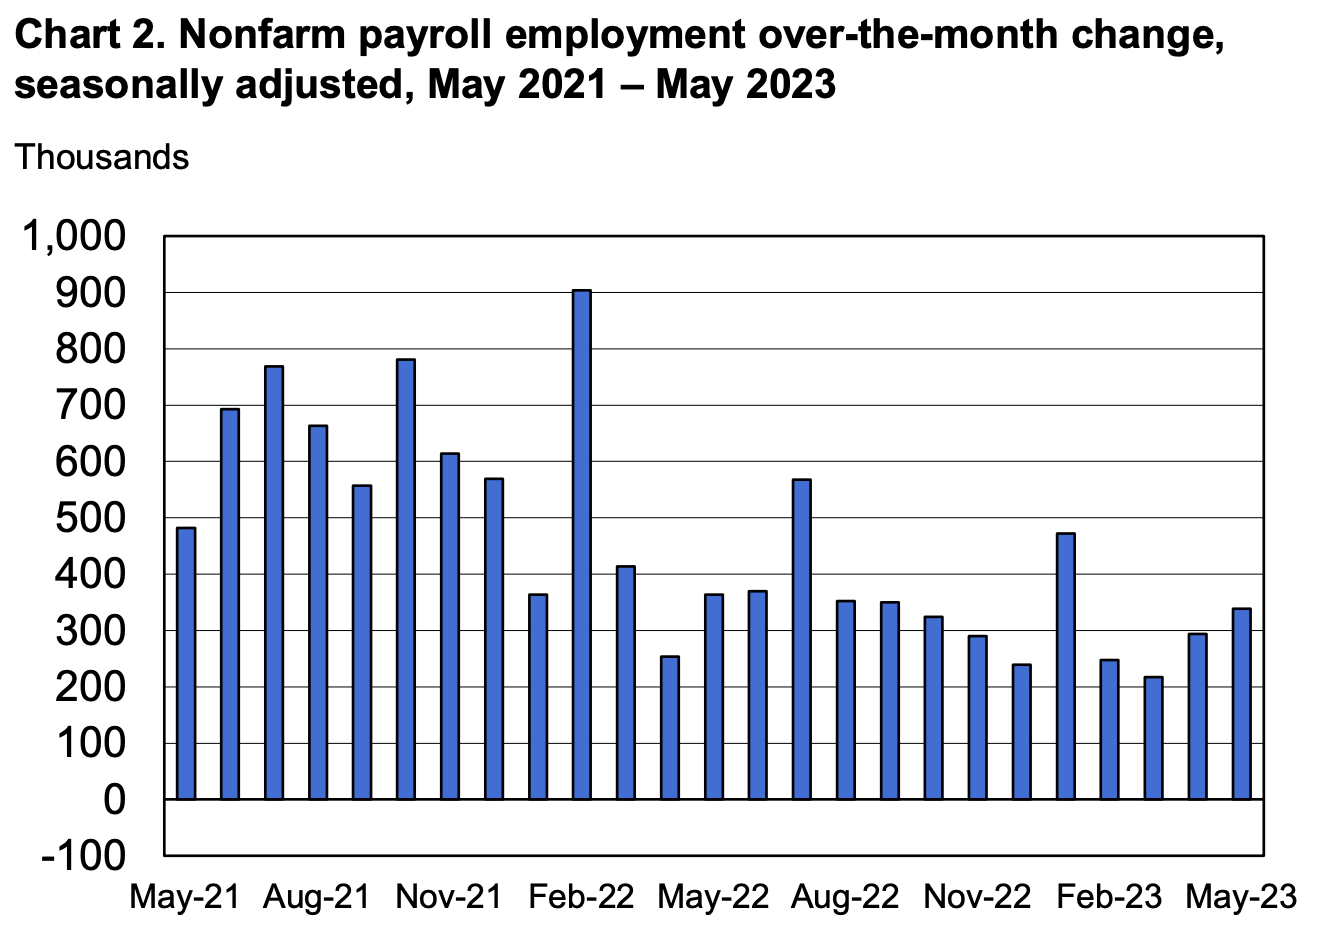
Job growth continues: The U.S. labor market remains resilient despite the Federal Reserve (FOMC) raising policy rates by 500 basis points since March 2022. Employment rose by 339K in May, compared with an average monthly gain of 314K for the year. While not as good as last year's average of 399K, it still points to a healthy labor market.
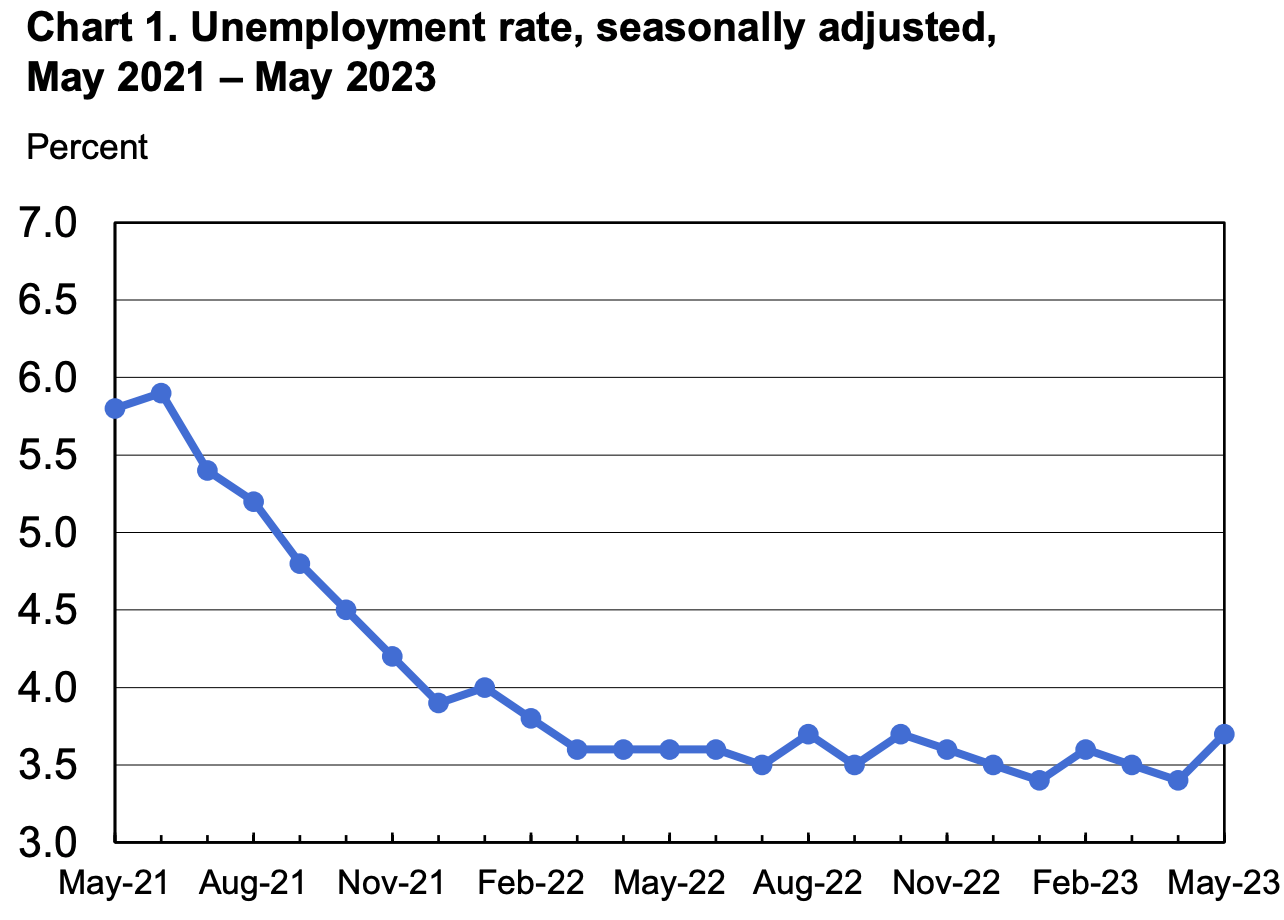
Unemployment Rising: Household survey data, on the other hand, sent a less optimistic signal, with the surveyed unemployment rate rising by 0.3 percentage points to 3.7%, which is quite rare to see an increase of this magnitude in a non-recession period, Although partly related to storms or strikes or statistical caliber, it also sent a more cautious signal.
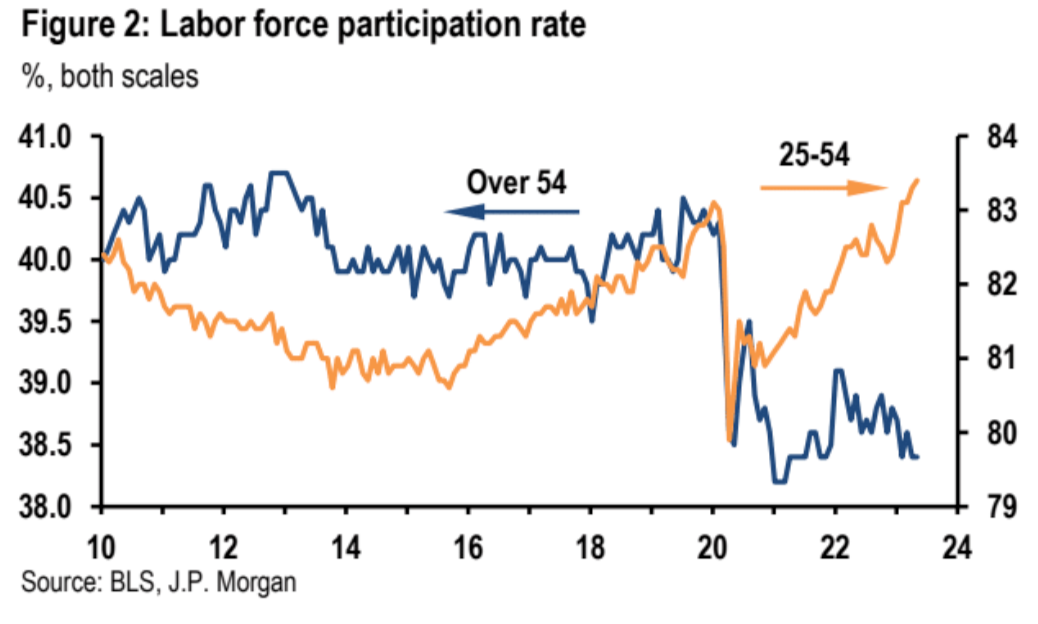
Labor Force Participation Holds Steady: The overall labor force participation rate held steady at 62.6% last month, while participation among the prime working age group 25 to 54 rose slightly to 82.4%, about the highest level in the past two decades. Those participation and job growth figures point to tightness in the labor market, which has been the Fed's main focus.
Labor Market Tightness Continues: JOLTS data from April also showed continued tightness in the labor market. The downward trend in job vacancies reversed in April, with vacancies rising to 10.103 mn from an upwardly revised 9.745 mn in March. The ratio of vacancies to unemployment (V/U ratio) rose to 1.8 from 1.7; while off the recent high of 2.0, the V/U ratio remains well above the 1.0 – 1.2 range considered consistent with labor market balance .
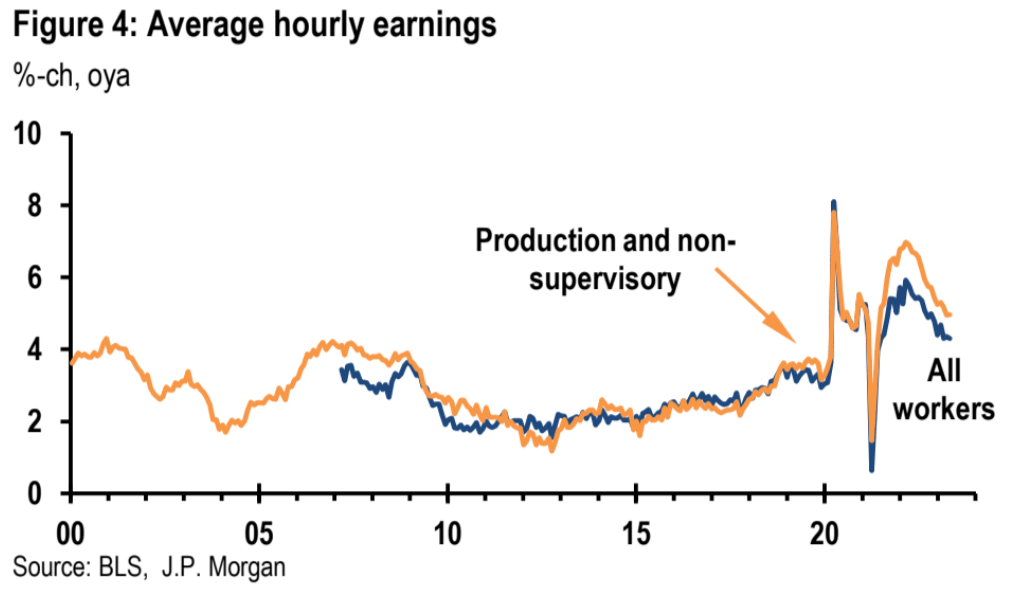
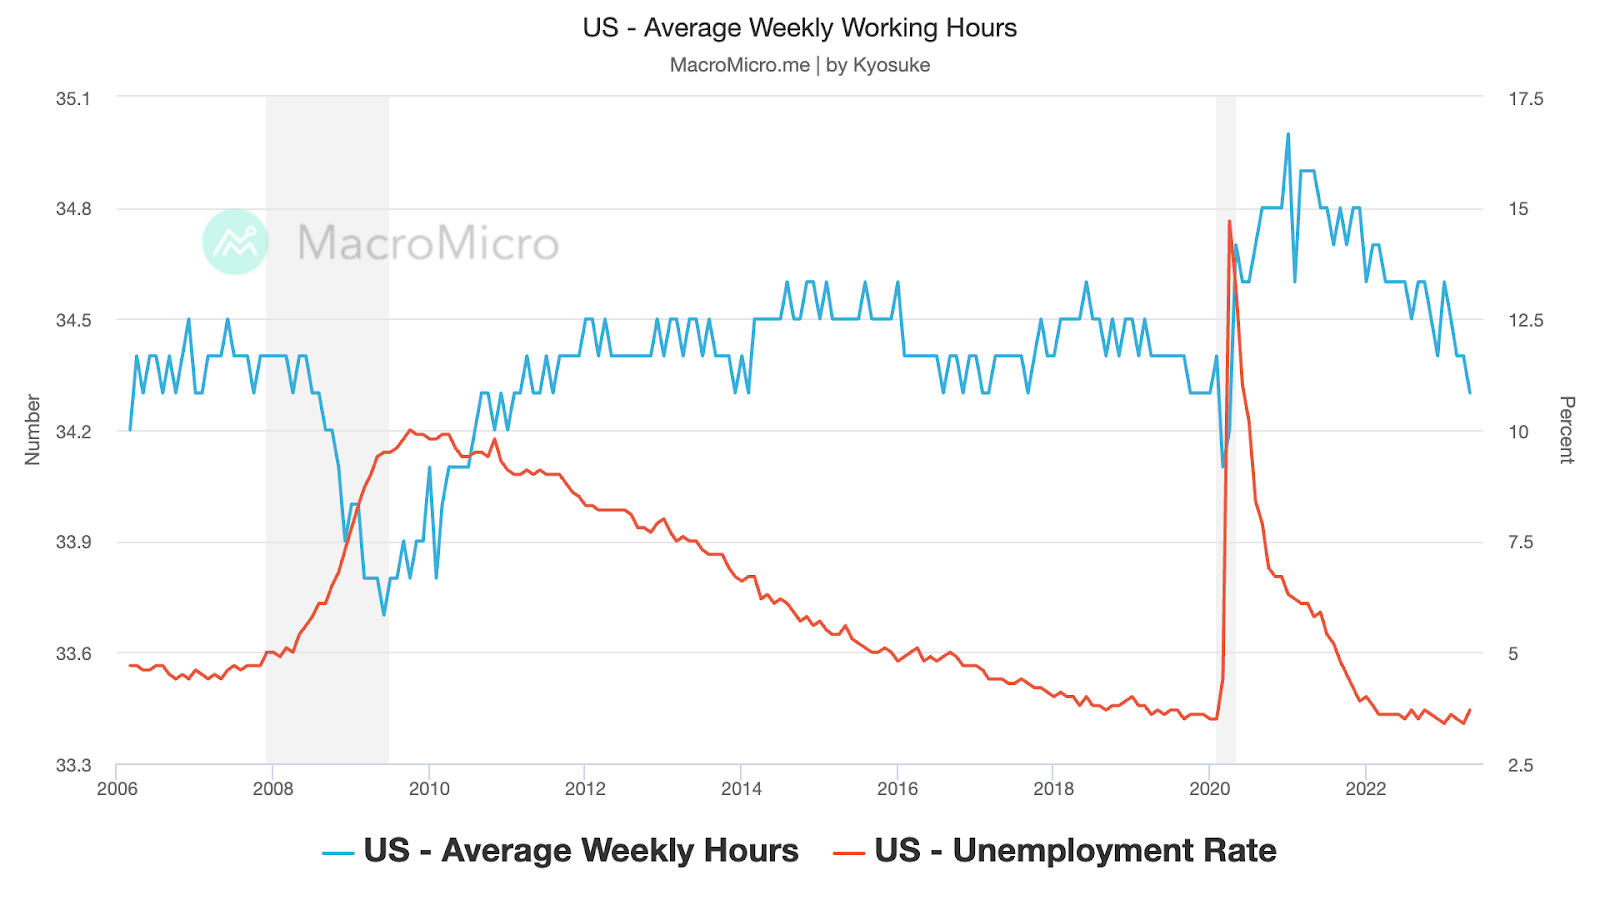
Wage growth and working hours fell: Average hourly wages increased by 0.3%, slightly lower than expected and the previous value of 0.4%, the average working week decreased to 34.3 hours, which is at the bottom of the range of the past decade, and the growth of working hours stagnated May imply an easing of labor market tensions, with a possible lead-lag relationship between hours worked and employment.
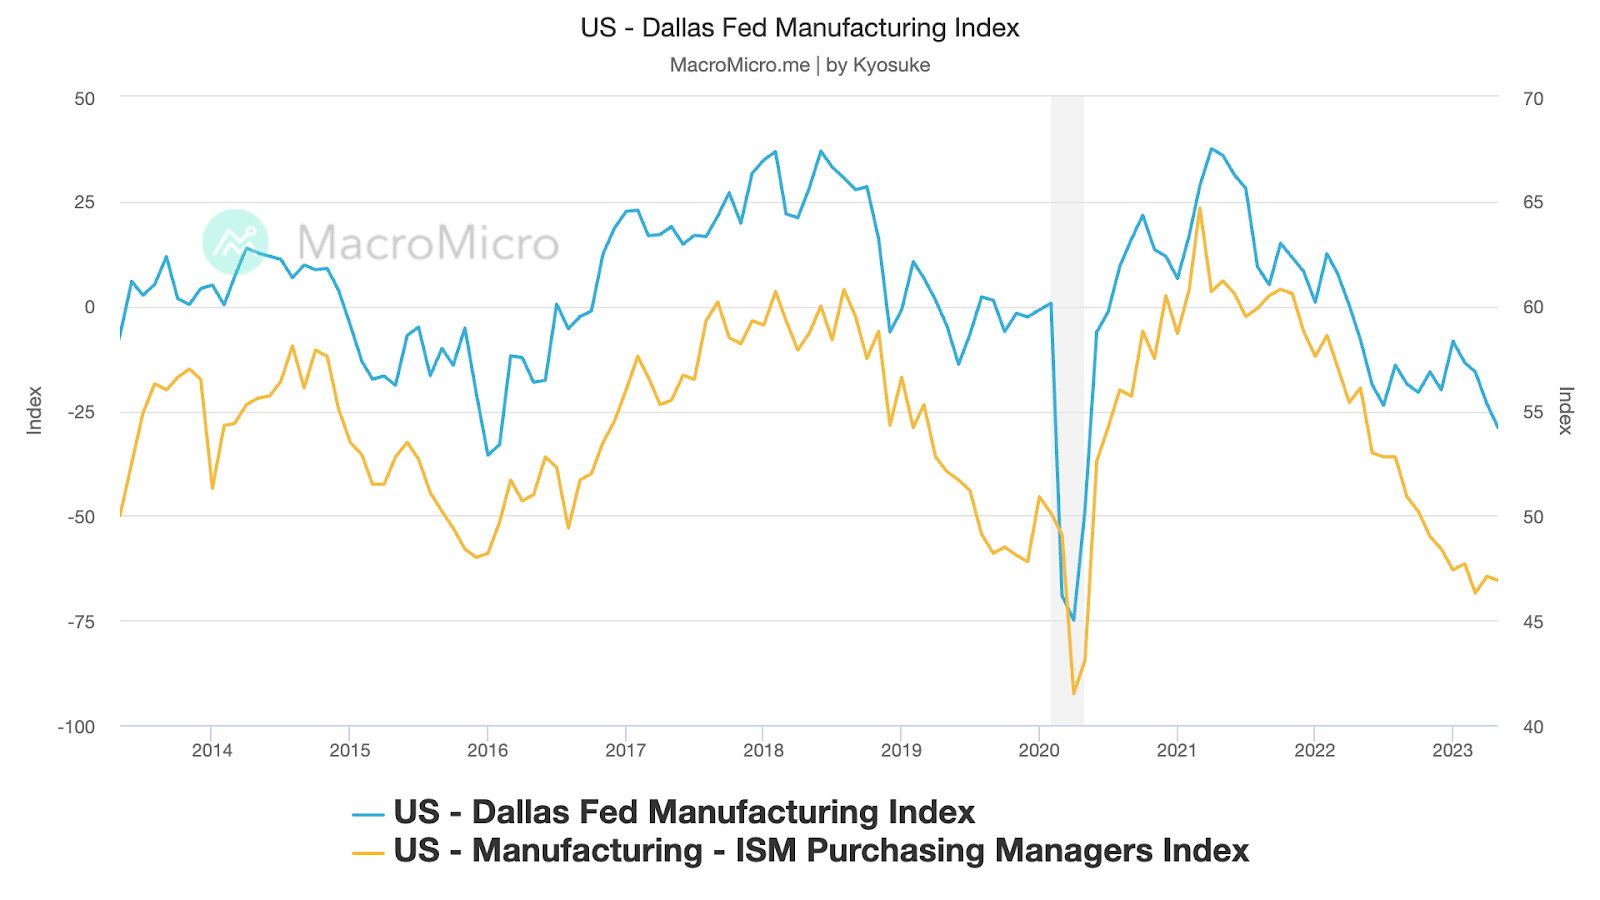
Poor Manufacturing Surveys: Recent surveys of manufacturing activity have been subdued. We saw this trend continue last week in the Dallas Fed survey and in the ISM manufacturing index for May. The Dallas Fed business activity figure fell to -29.1 last month from -23.4 in April, a new low for the cycle. Most of the sub-item data are also negative. The ISM manufacturing index fell slightly to 46.9. The number has been below 50 since October last year.
Investor position update:
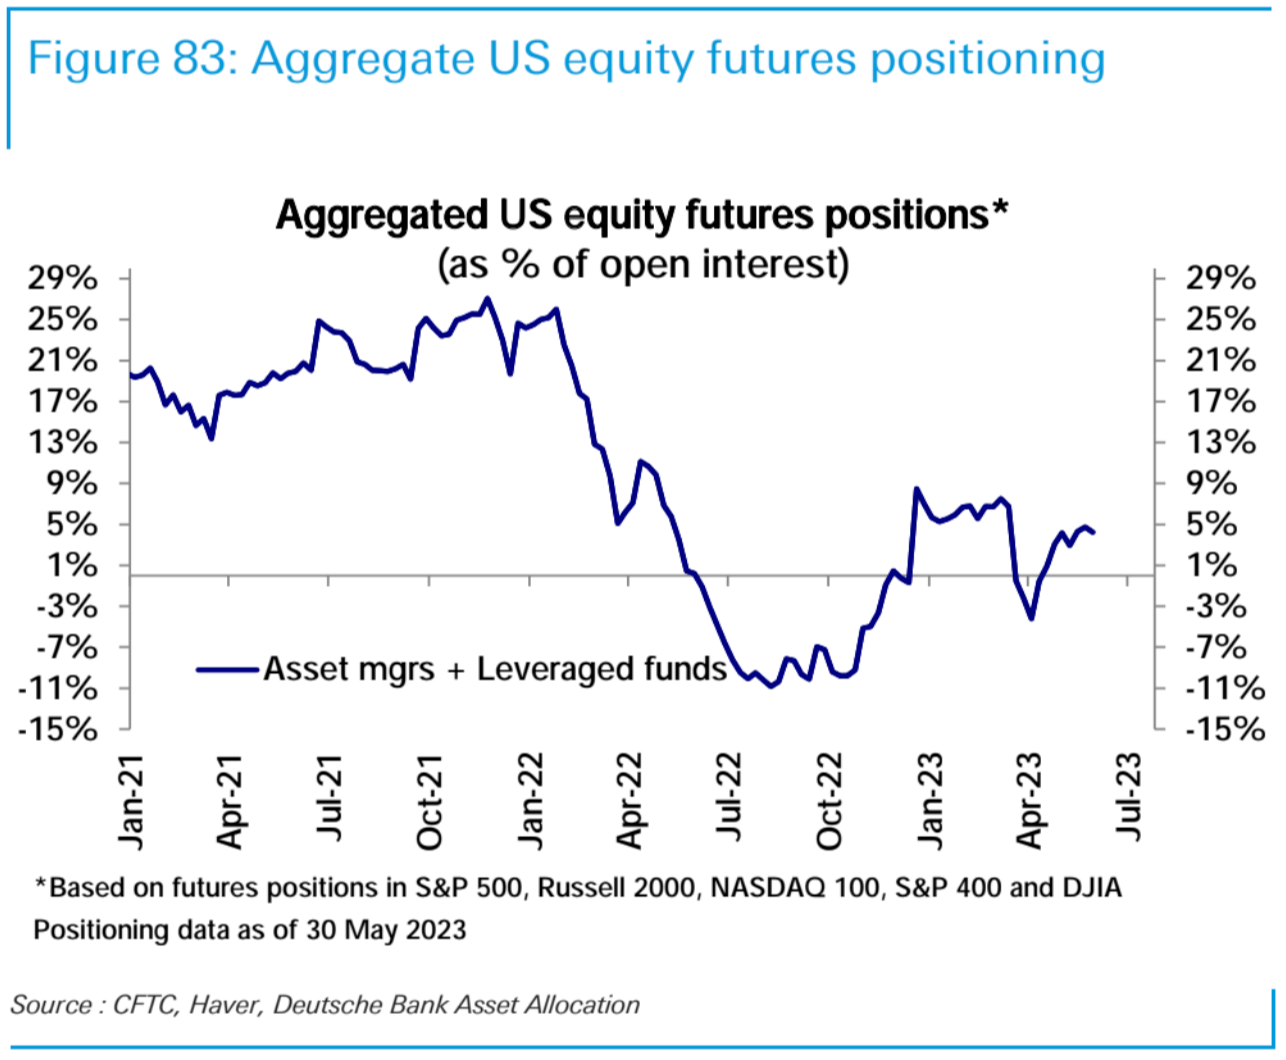
According to CFTC data, as of May 30, the net long positions of Asset manager + leveraged funds in US stocks decreased slightly compared with the previous week, but they still held net long positions on S&P 500 and Nasdaq 100 futures, while holding slightly on Russell 2000 Short position.
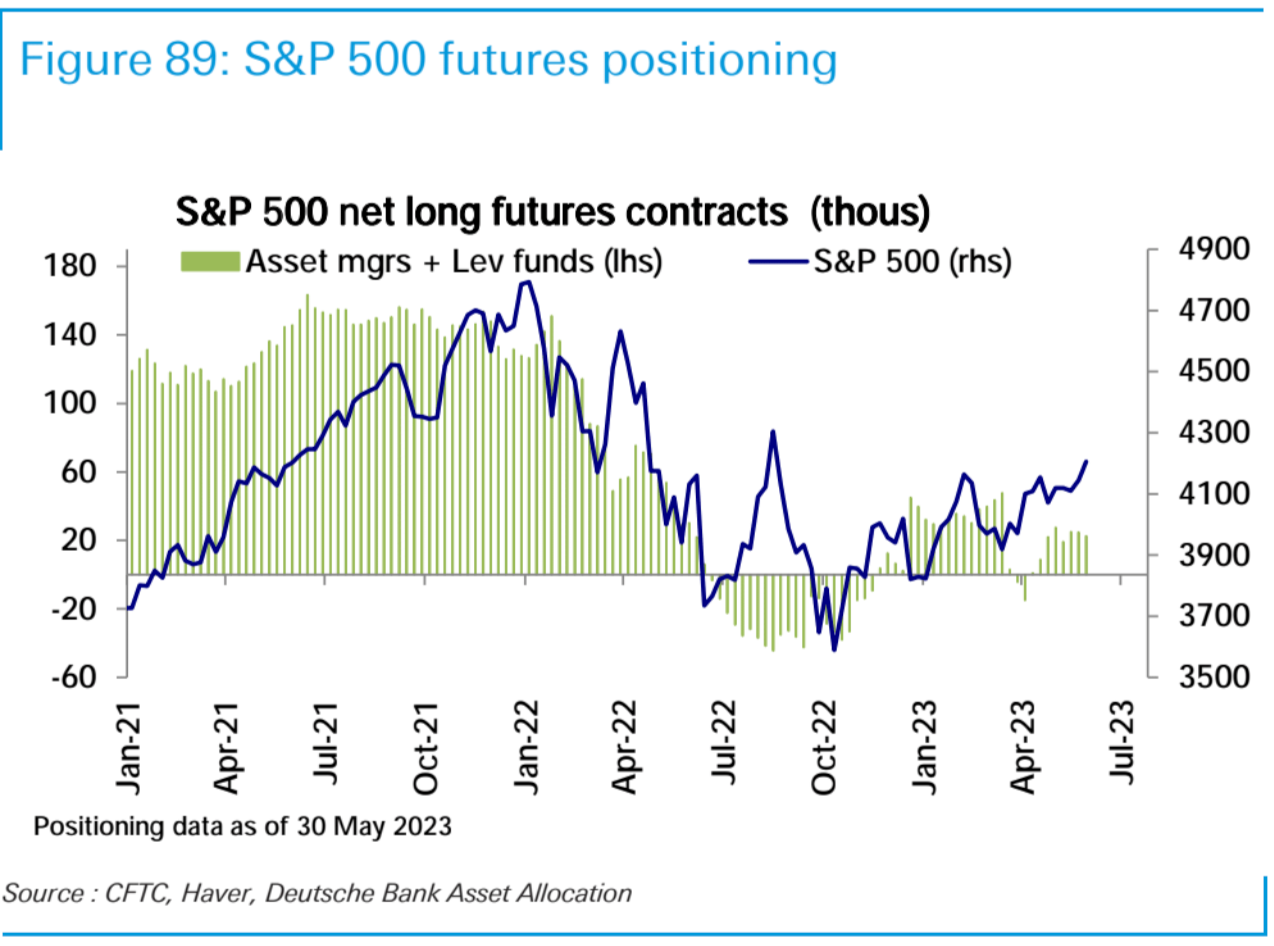
S&P 500 futures net longs fell slightly:
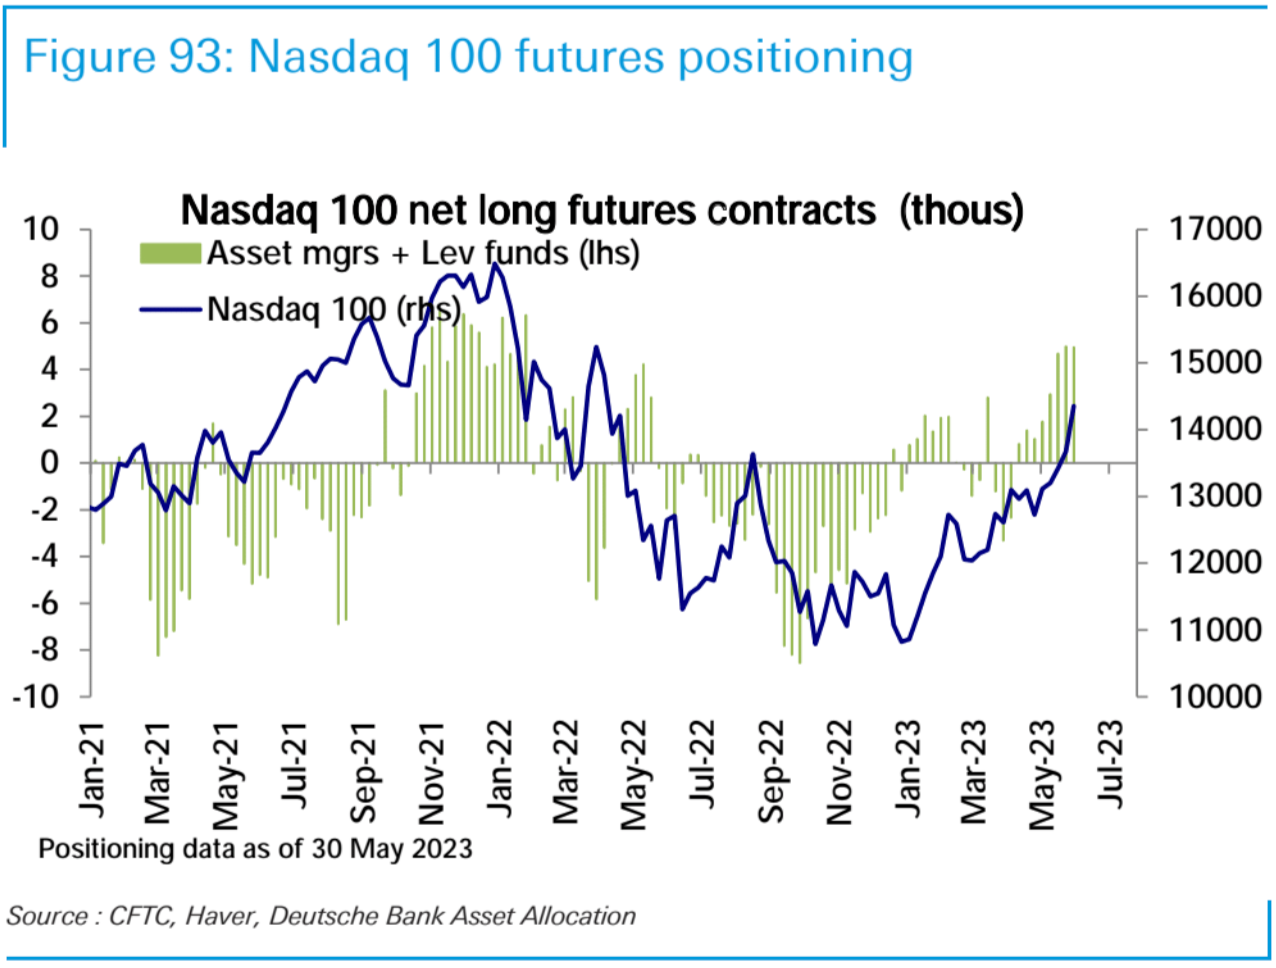
Nasdaq 100 futures net longs have been at their highest level since early 2022 for three straight weeks:
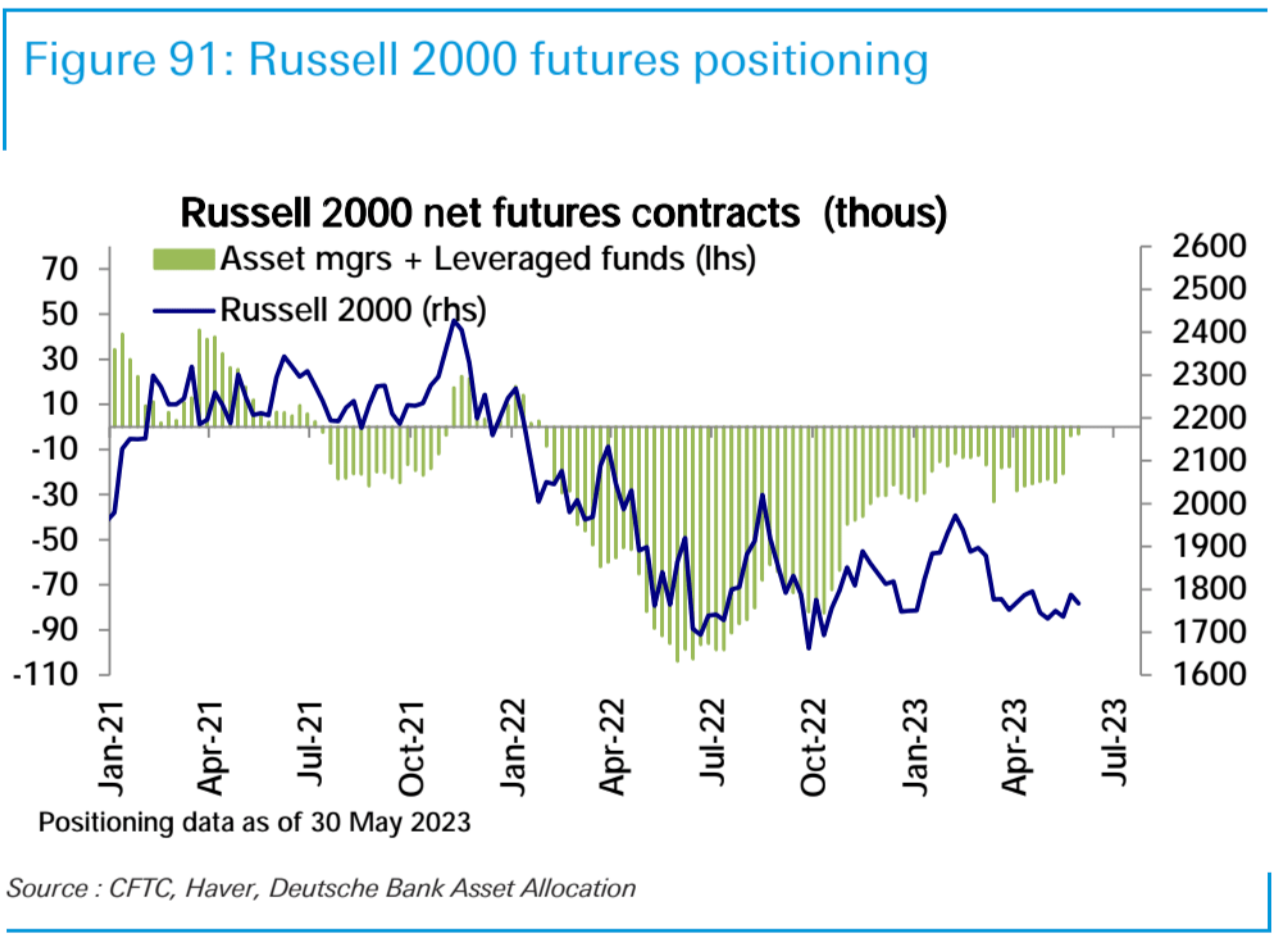
Russell 2000 futures net-shorts decreased slightly:
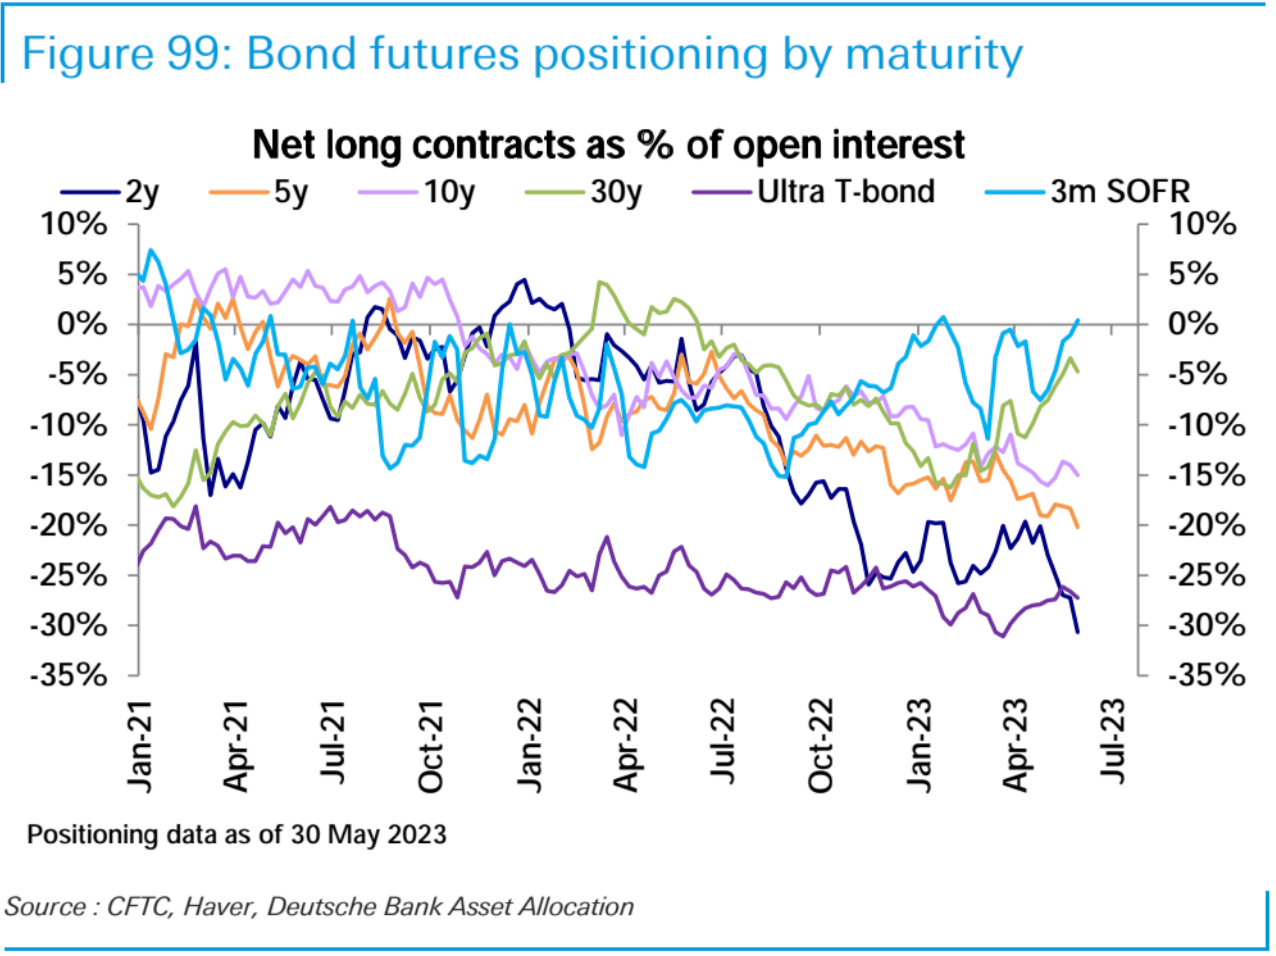
The net short position in bonds increased to a new record level this week, with net short positions increasing across all maturities, in line with expectations for the end of the recent rise in interest rates.
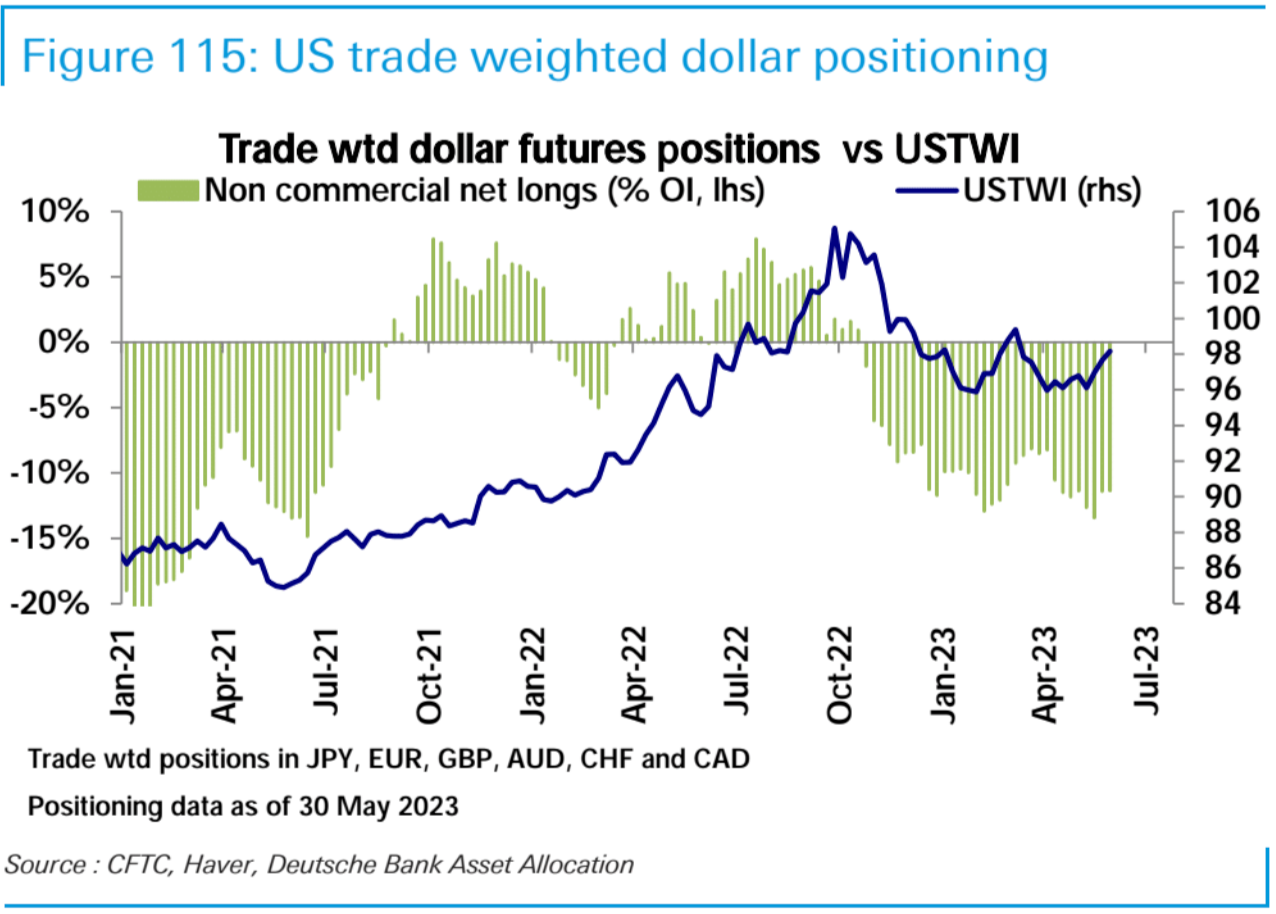
In the foreign exchange futures market, the net short position of the US dollar was flat, and the net long position of the euro decreased; the short position of the yen increased, but the short position of the Australian dollar and Canadian dollar decreased.
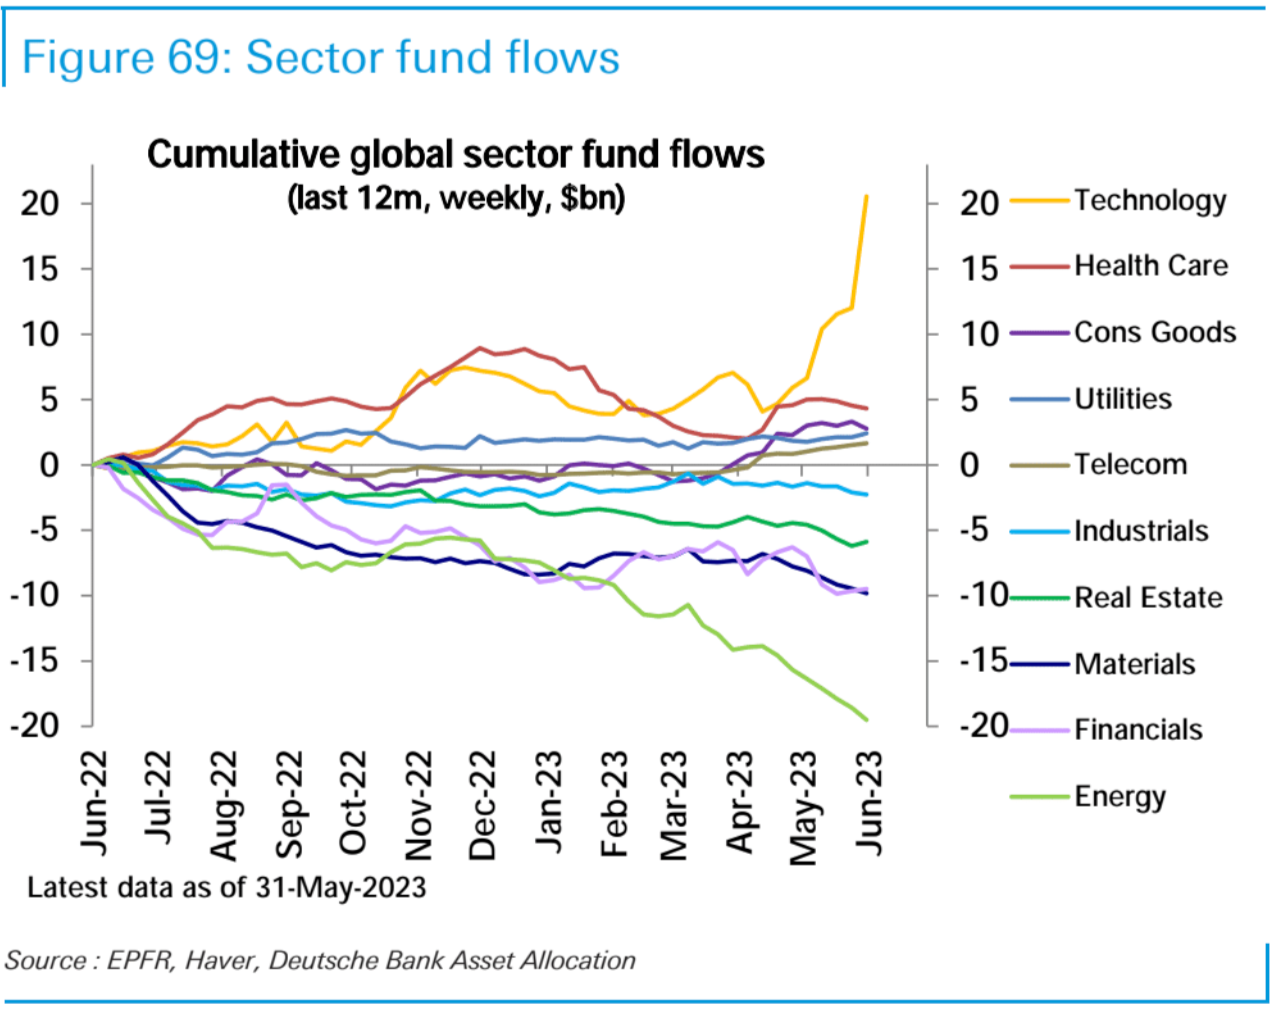
Equity funds saw their strongest weekly inflows in 17 weeks last week, totaling $14.8 billion, led by a record $8.5 billion inflows into technology funds, EPFR data showed. Energy, raw materials, and Utilities continued to see large outflows.
Regionally, the US ($13.3 billion) and emerging markets ($4.8 billion) dominated inflows, their largest weekly inflows so far this year. However, Europe (-$1.8bn) saw its 12th consecutive week of outflows, as did funds globally (-$1.1bn) and S-class funds (-$0.7bn). In terms of style, long-term growth funds ($8.3 billion) received strong inflows, while value funds (-$3.5 billion), cyclical funds (-$2.6 billion) and defensive funds (-$200 million) suffered redemption.
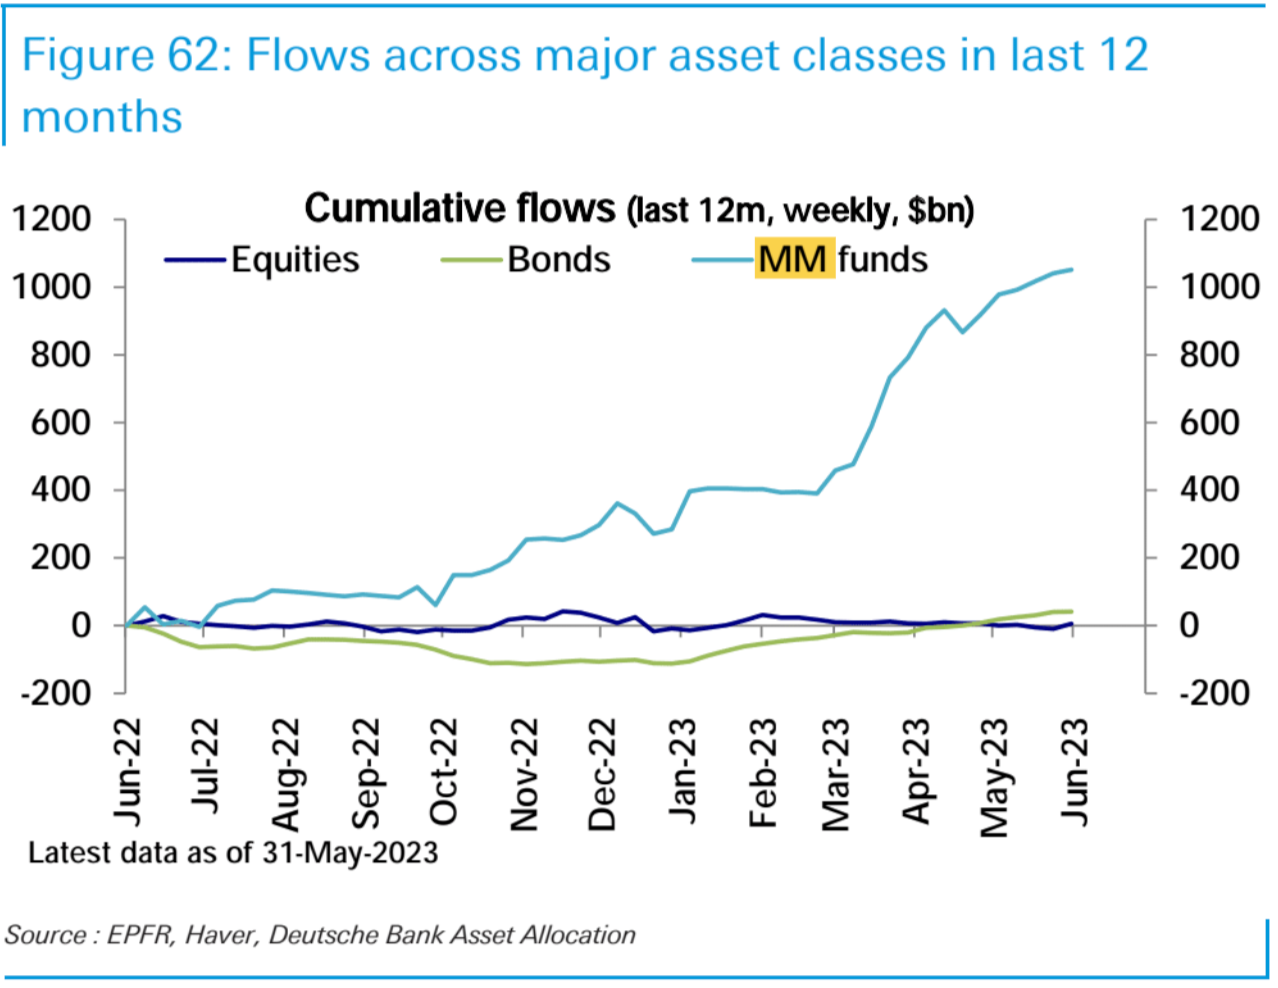
Inflows into bond funds ($1.1 billion) slowed sharply, while inflows into money market funds (MM) ($11.2 billion) increased for the sixth consecutive week, albeit at a slower pace.
The CNN Money Fear & Greed Index is currently at a neutral reading.
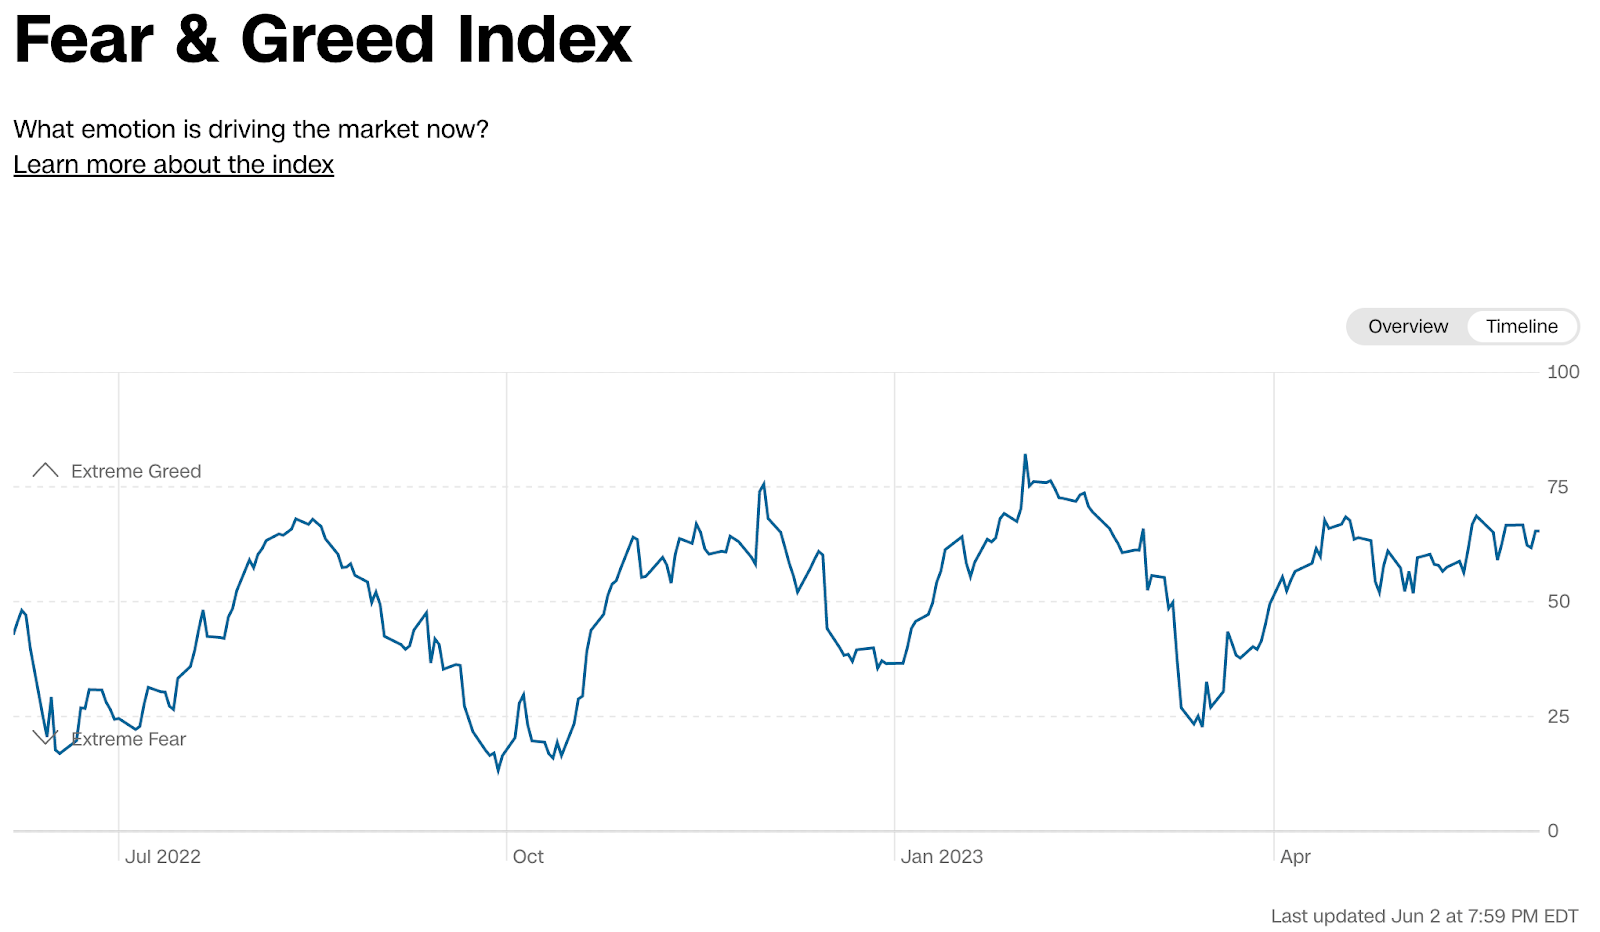
CNN Money Fear & Greed Index, currently reading neutral
AAII Fear and Greed Index, currently reading neutral.
Our other reviews:
There are broad expectations that the U.S. could experience a recession in the second half of 2023 to the first half of 2024. That’s despite recent macroeconomic data and a stock market rally that has dented that view: The job market is hot, the U.S. economy is growing steadily, with second-quarter GDP forecasts raised to 2.2%, while U.S. stocks have rallied to their highest levels in a year.
Despite the fair performance of big tech stocks, other hallmark signals within the market, such as the interest rate curve, commodities, and the deep divergence within the stock market, still point to recession fears. Meanwhile, interest rate futures have priced in another rate hike in July, which was not expected by the vast majority a month ago.
The artificial intelligence (AI) industry has become the only driving force in the market. However, in terms of large technology companies, only a few companies such as Nvidia can directly benefit from revenue, and Apple, Amazon and META are still waiting for their AI "breakout" time. It should be noted that the recent surge in many stocks is more due to their cost control than revenue growth. The current hype needs higher quality figures to support it.
In Japan, stocks have rallied again this week, gaining 21% so far this year. On the other hand, the issue of the US debt ceiling is a thing of the past, but the withdrawal of liquidity from the market is starting to gain attention again, especially with the flood of Treasuries entering the market and the rebuilding of the Treasury Cash Account (TGA).
Although the current market has risen, the internal differentiation of the market has not been significantly improved. Historical experience tells us that we should remain vigilant when the leading bids in the market are so limited.
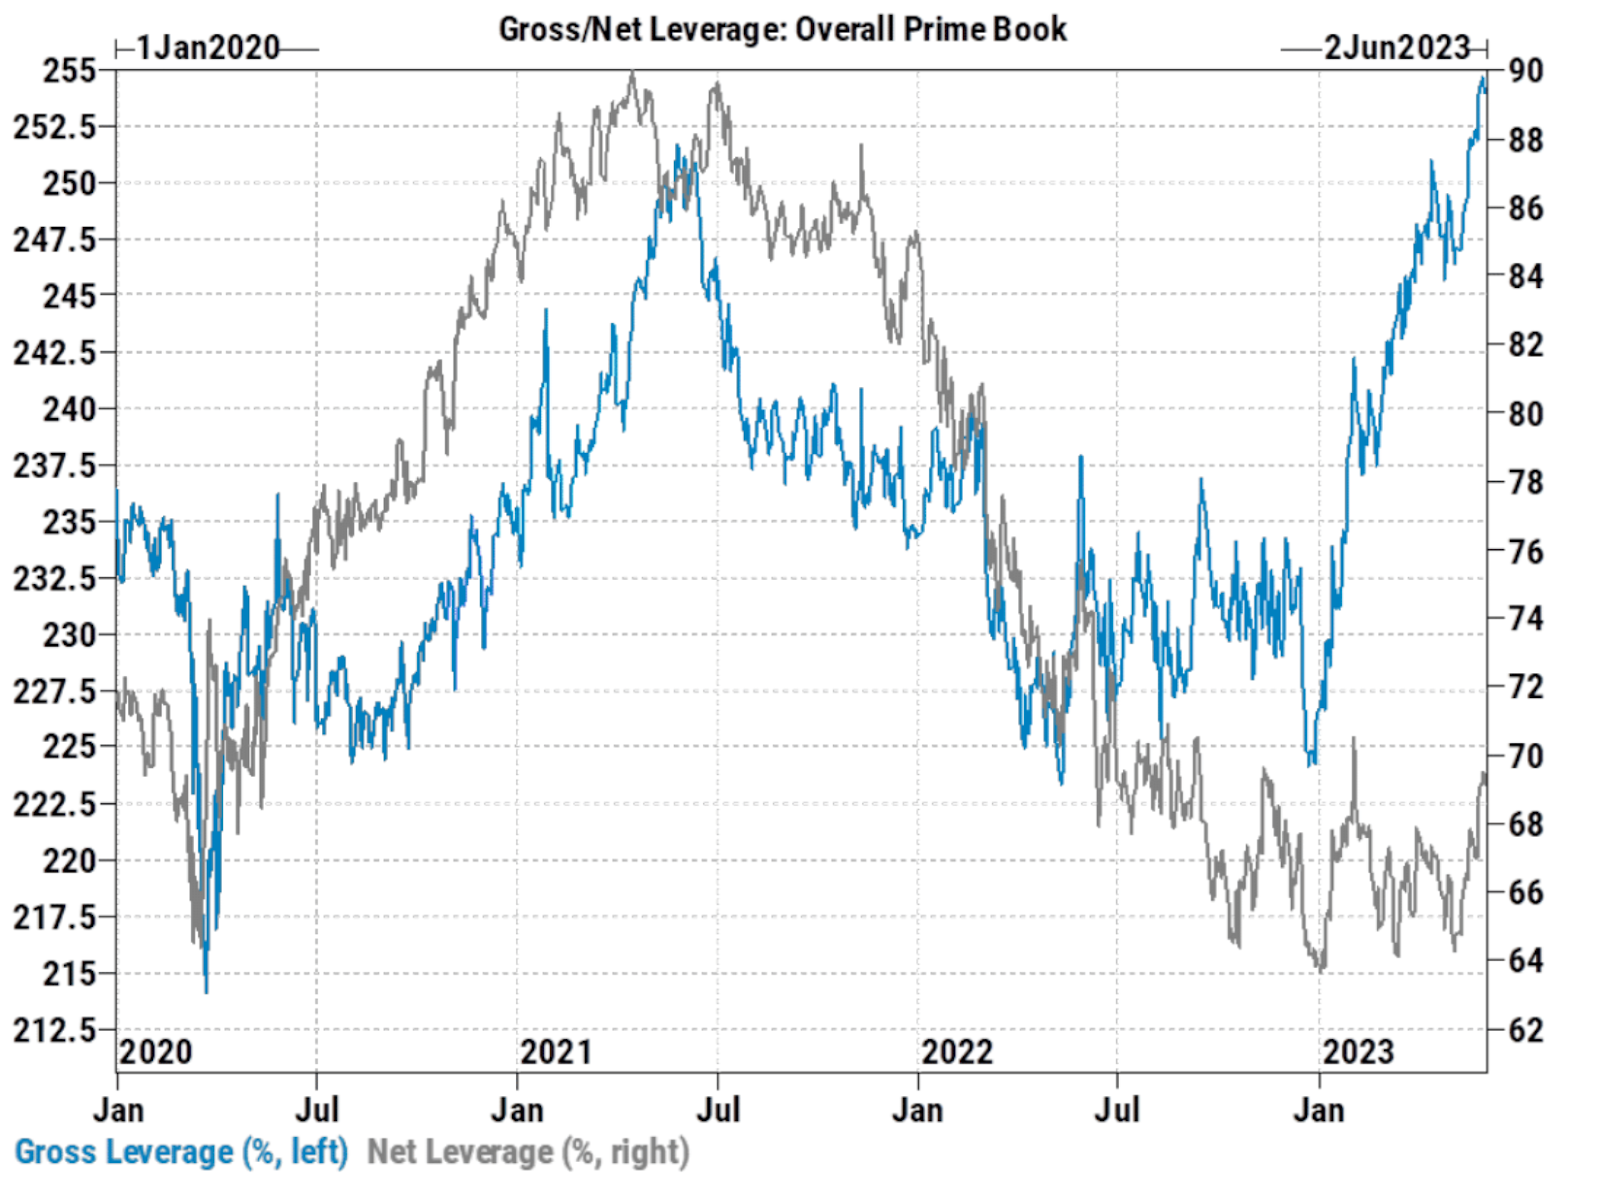
Large speculators may find fewer investment opportunities in the second half of 2023 as tech stocks become more expensive. According to Goldman Sachs PrimeBook statistics, since mid-March this year, the net risk exposure of hedge funds has risen to a limited extent, but their total exposure is extremely high, reaching a record high:
This shows that large speculators may have increased their spot positions to a relatively high level, but at the same time did not give up their bearish protection (there are still a large number of short positions in US stock futures), so although the net exposure is not high, a lot of spot buying power has been consumed .
In contrast, the inflow/outflow of public funds that are purely long stocks is relatively flat, which means that retail investors neither buy nor sell on a large scale, and everyone tends to invest in high-yield money market funds and Look for investment opportunities on some popular stocks.
Against the backdrop of a still very strong US labor market and the report cards from big US tech companies, the current market structure may constitute an ongoing pain trade. Here are some possible signs that can help determine if the pain trade is nearing its end:
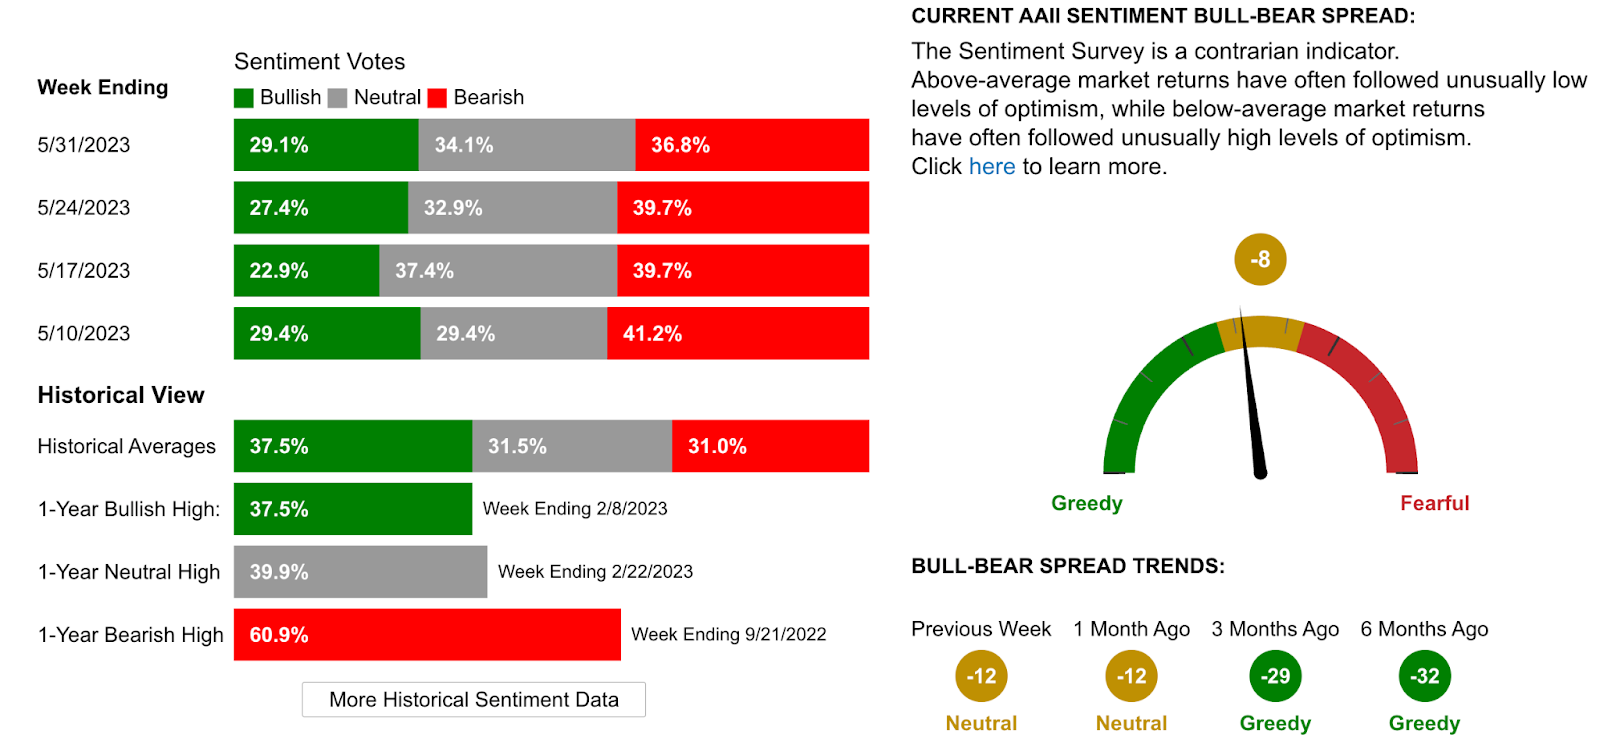
Changes in Sentiment Indicators: Market sentiment can be an important signal. For example, if a fear or greed index in the market (such as CNN or AAII's Fear and Greed Index) starts to change significantly, the market may peak when extreme greed occurs.
Adjustment of positions: A large number of bearish trades being liquidated, or a large amount of money flowing into or out of certain markets or assets, may signal that investors are beginning to adjust their positions.
Changes in market trends: If market trends start to reverse, such as hot tech stocks start to stagflate, fail to support the broader market, and broad markets start to pull back, this could be a sign that the pain trade may be nearing its end.
Changes in economic and fundamental data: If economic data or corporate fundamental data fails to consistently beat expectations, this could affect market sentiment and could lead to the end of the pain trade.
Changes in market volatility: If the volatility of the market starts to increase or decrease, this may indicate a change in market sentiment, which may herald the end of the pain trade.
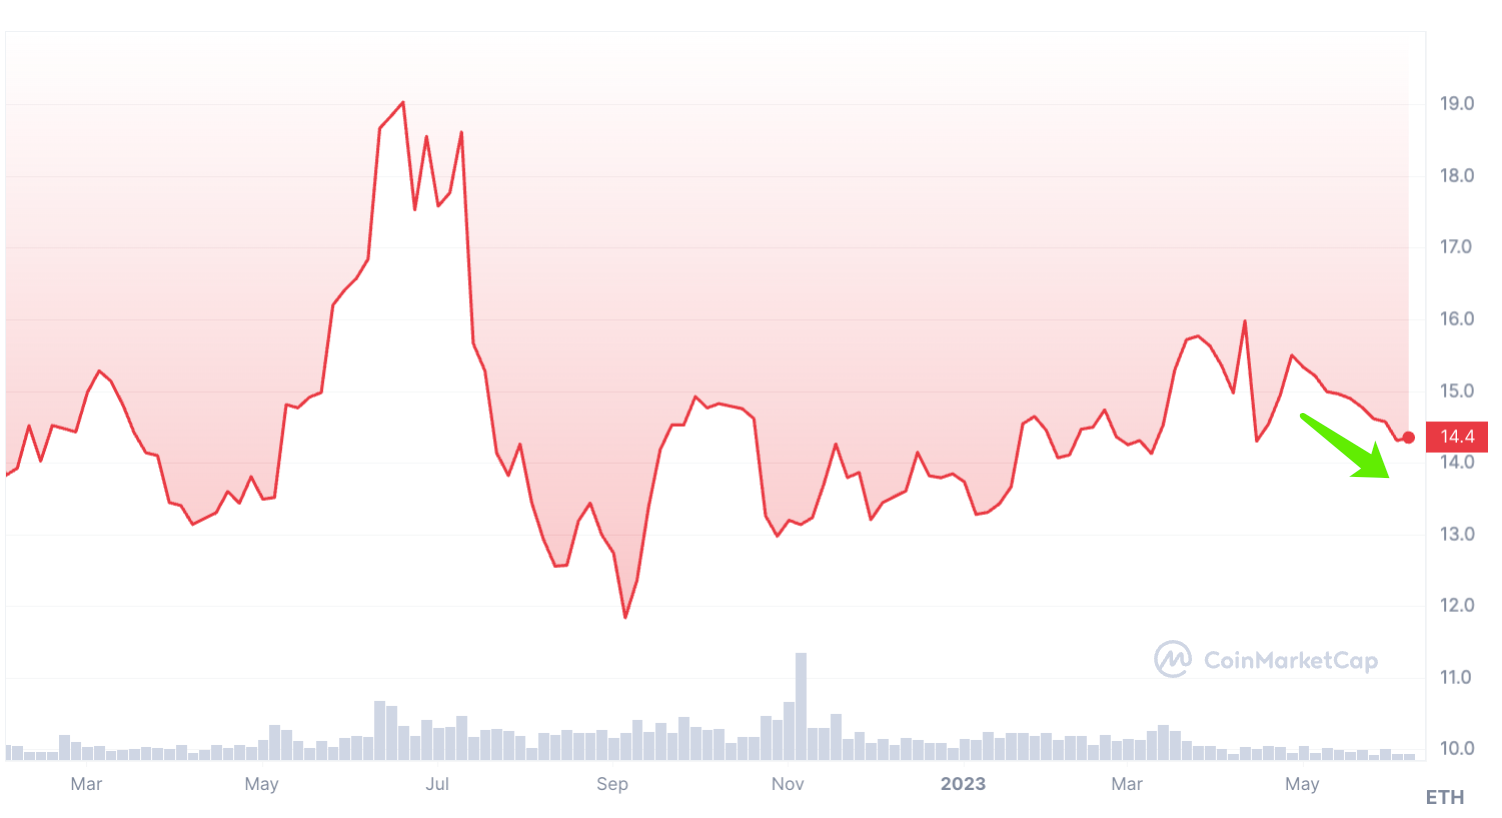
In terms of the digital currency market, Ethereum has continued to outperform Bitcoin since May, BTC/ETH:
This is mainly due to the rapid recovery of the banking crisis in March, the continuous narrowing of credit spreads, the AI concept leading the direction of funds, the weakening of demand for alternative allocations, and the increased influence of supply and demand on prices. However, Ethereum is relatively deflationary (for example, about 550 K ETH has been burned in 2023) and after the Shapella upgrade, the 2.0 pledge volume has increased (for example, most days in May 2023 saw net inflows, and a total of About 2.67 million net ETH deposits), so before the outbreak of new alternative allocation demand, ETH is expected to be stronger than BTC, but generally speaking, due to the current lack of hot spots in the Crypto circle, although it can partly benefit from the optimism of the traditional market "Dongfeng", but it is not expected that incremental funds will flow in. If the AI track bubbles too quickly and falls into stagflation, this "east wind" may disappear.
Focus this week on:
This week should be quieter as the debt ceiling issue is resolved. We will see more data on business spending, including factory orders data as well as ISM services and April trade data. In addition, Coinbase's futures trading platform will be launched on June 5. Since more than 80% of the revenue of most crypto exchanges comes from leveraged derivatives transactions, pay attention to the impact of the futures platform of the largest crypto exchange in the United States on its own revenue and the crypto market structure , Generally speaking, the initial stage of going online will be emotionally positive, but it will also cause a pumping of funds in the spot market.
Monday, June 5
US Factory Orders in April: Consensus expects factory orders to rise 0.8% MoM, sharply outpacing the 0.4% increase reported in March.
US ISM Services Data: The market expects the ISM services index to come in at 52.4 in May, up from 51.9 in April.
l Coinbase's futures trading platform was launched.
Tuesday, June 6
Australia RBA meeting: Markets expect RBA to keep rates on hold at 3.85%, but maintain a tightening bias.
German Manufacturing Orders: We expect manufacturing orders to rise by 0.7%.
Wednesday, June 7
US Trade Balance: Markets expect the trade balance to hit a deficit of -$75.3 billion in April, up from -$64.2 billion in March.
China's trade data: The market is expected to be dragged down by factors such as sluggish external demand and a high base in the previous year. China's imports and exports may continue to weaken in May. In US dollars, exports may fall by 1.6% year-on-year, and imports may fall by 8% year-on-year.
German Industrial Production: The market expects industrial output to rise by 0.5% MoM, better than the previous value of -3.4%.
Bank of Canada Rate Decision: The Bank of Canada is expected to keep interest rates unchanged at 4.50%.
Thursday, June 8
US Wholesale Inventories: Consensus expects wholesale inventories to be -0.2% in April, unchanged from March.
The final value of Japan’s GDP in the first quarter: the market predicts that the nominal and real GDP will grow at a year-on-year rate of 1.8% and 1.9% respectively from January to March 2023, and business investment will increase by 1.1%.
Friday, June 9


