
Analysis of NFT short-term arbitrageurs
author:Blockin.ai、NFTin.ai
1. The significance of studying NFT short-term arbitrageurs
Arbitrage traders are those who buy an asset in one market and sell it in another market for a higher price - taking advantage of the price difference in the two markets. Typically, this is done for highly liquid assets such as stocks or cryptocurrencies, which can be traded simultaneously.
Arbitrage occurs when NFT traders take advantage of the price difference between two markets to buy an item in one market and sell it at a higher price in the other. Transactions may be completed simultaneously or at intervals. There are endless short-term arbitrage behaviors in the NFT market. The challenge of NFT arbitrage is that the market is illiquid, buying an NFT may take days or weeks to sell. This means that arbitrageurs may know they are buying NFTs cheaper in one market and sell them at a higher price in another—but don't know if the NFTs can actually be sold, making arbitrage a risky operation. the behavior of.
Therefore, studying the formation of NFT short-term arbitrage transactions and clarifying the NFT market arbitrage transaction model and transmission mechanism can provide short-term traders with trading guidance and advice on buying and selling prices, and help them understand NFT market risks, which has important practical significance.In order to make the research of this paper have certain value, six representative blue-chip project transactions were selected for analysis ("Bored-Ape-Yacht-Club", "CryptoPunks", "Doodles", "Mutant-Ape-Yacht-Club", " Cool-Cats-NFT", "Bored-Ape-Kennel-Club").
The main content of this article is as follows:
1. Verify the ubiquity of short-term arbitrage in the NFT market by tracking the frequently traded holders addresses;
2. Starting from the Collection level, statistically observe the profitability of different holders buying and selling NFT in different time dimensions of 6 blue-chip projects, to illustrate the trading habits of traders in the NFT market and the profitability of transactions in different cycles;
3. Select a few "representative" short-term arbitrage addresses from a large number of NFT short-term arbitrage addresses, and record each transaction within a certain period of time, including the specific transaction time interval, each transaction income and transaction winning rate Condition. Combining micro and macro market indicators to analyze its specific arbitrage behavior, and give some suggestions and opinions on how holders can conduct short-term arbitrage in the NFT market;
4. combineNFTin.aiThe discount rate indicator developed and designed provides specific price traction schemes and trading ideas for holders trading operations, so that short-term traders can maximize trading profits.
2. Analysis of the ubiquity of NFT short-term arbitrage
In order to observe the short-term trading habits of NFT buyers and sellers (that is, the interval between buying and selling the same NFT each time), we counted 6 blue-chip projects buying and selling NFT with the same token_id in different time periods ( 1 day, 3day, 5 day, 7 day , 15 day, 30 day), the rate of profit from trading with the same address and the number and proportion of these addresses in all trading addresses. The profit-rate formula for buying and selling NFTs with the same token_id is as follows:
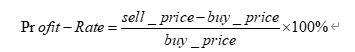
The transaction was unstable for a period of time at the beginning of the project release. Therefore, we removed the transaction records of 6 blue chips in the previous month, and selected the end time as 2022/11/22. Among them, the CryptoPunks project was released in 2017, which is relatively old and has no research significance. We only analyze the transaction data of CryptoPunks in the time period of 2022/1/1 ~ 2022/11/22. It should be pointed out that we only list the profit rate of 6 blue-chip projects bought and sold by the same address within 1 day of the buying and selling time interval (excluding the larger value of Profit-Rate). As shown in Figure 1.
It can be seen from Figure 1 that in the transactions of buying and selling within 1 day, the buying and selling yields of the 6 blue-chip projects are mostly between 5% and 20%. It can be seen that most holders are making money when they change hands within a day Yes, and considerable. Among them, for Bored-Ape-Yacht-Club (BAYC), there are about 220 addresses with a return rate of 10% to 15% within 1 day. For different Collections, the same address within 1 day has a return rate of Negative addresses have fewer addresses. From the perspective of a single Collection, such as Cool-Cats-NFT, there are only 140 addresses with negative yield, accounting for 16.24% of the total number (862) of the same address for buying and selling within 1 day. a small part.
Figure 2 shows the total number of addresses of different collections that changed hands in different time periods and the ratio to the number of addresses in all transaction periods (all statistics have been deduplicated). The left side of each picture in Figure 2 is the statistics of the number of trading addresses, and the right side is the statistics of the proportion of the number of addresses. Mutant-Ape-Yacht-Club contains 19,426 items, and the other 5 blue-chip projects have approximately the same number of items, about 10,000. Overall, the proportion of addresses that trade within 1 day is 6% to 11%. The proportion of the number of addresses that trade within 3 days ranges from 10% to 17%. As the time period increases, the proportion of the number of addresses that trade in each Collection increases. Bored-Ape-Kennel-Club The growth rate of address ratio is the fastest. For each additional time dimension, its proportion increases by 6.5 points. Considering that it has the most items, it shows that this project has a good market liquidity and turnover rate. Holders who conduct short-term trading behavior are especially obvious in this project. Every cycle In horizontal comparison, its address ratio is higher than that of other collections. For example, the ratio of addresses that have changed hands within 7 days is 17.8%, and the number of addresses is as high as 2244.
image description
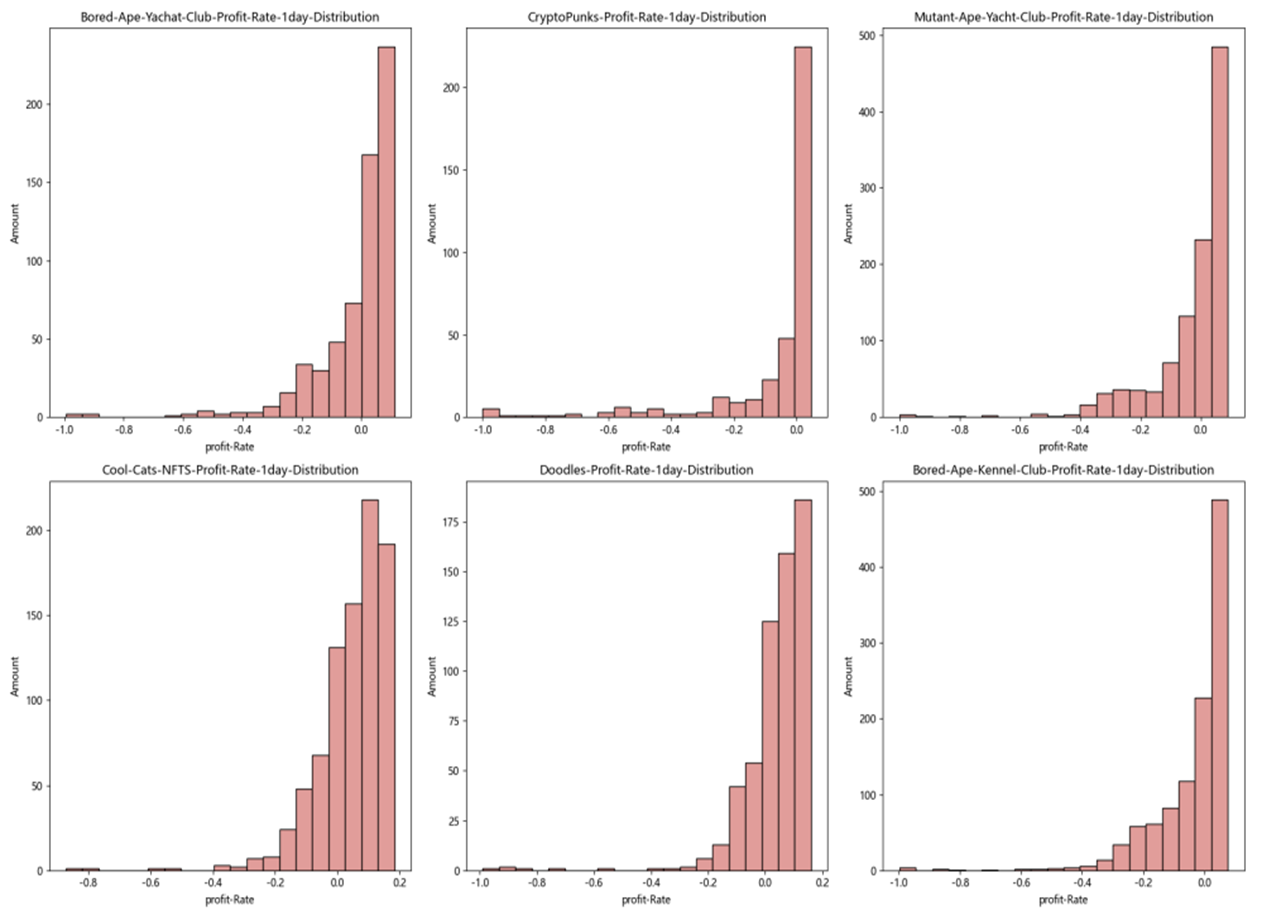
image description
Figure 2 The number and proportion of buying and selling addresses in different cycles of 6 blue-chip projects
3. Analysis of collection layer holders buying and selling transactions
In the previous part, we proved that short-term trading behaviors are common in the NFT market through transaction data analysis. Therefore, in this part we will further analyze the short-term trading behavior and trading income of holders in detail.
The observation time is 2022/11/22. We select 7 time dimensions: 1 day, 7 days, 15 days, 30 days, 90 days, 180 days, and 365 days from the observation time to analyze the holders on 6 blue-chip projects The number statistics and transaction profit and loss situation.
The statistics on the number of holders of the six blue-chip projects are shown in Figure 3. It should be noted that we count the holders who have both buy and sell actions in different cycles. As the time dimension increases, the number of holders of different Collections also increases to varying degrees, and the number of holders of different Collections in the same cycle is quite different. In the past 7 days from the observation time, the number of active holders of BAYC has reached 49, an increase of 2.26 times compared with the number of active addresses in 3 days, and the growth multiple is higher than that of other Collectionholders, indicating that in the last 7 days During the day, BAYC traded frequently, as shown in Figure 4. (Follow the NFTin.ai official website, the website link is as followshttps://www.nftin.ai/ethereum/collection/boredapeyachtclub/activity), which may be related to the crazily falling floor price of BAYC, and the holders of BAYC want to sell to cash out, as shown in Figure 5. URL link is (https://www.nftin.ai/ethereum/collection/boredapeyachtclub/overview), the average transaction price of BAYC on November 15, 2022 was the lowest in the past 7 days, at 57.61 ETH. The number of transactions and the transaction amount are the highest in the past 7 days, 49 and 2822.94 ETH respectively.
image description
image description
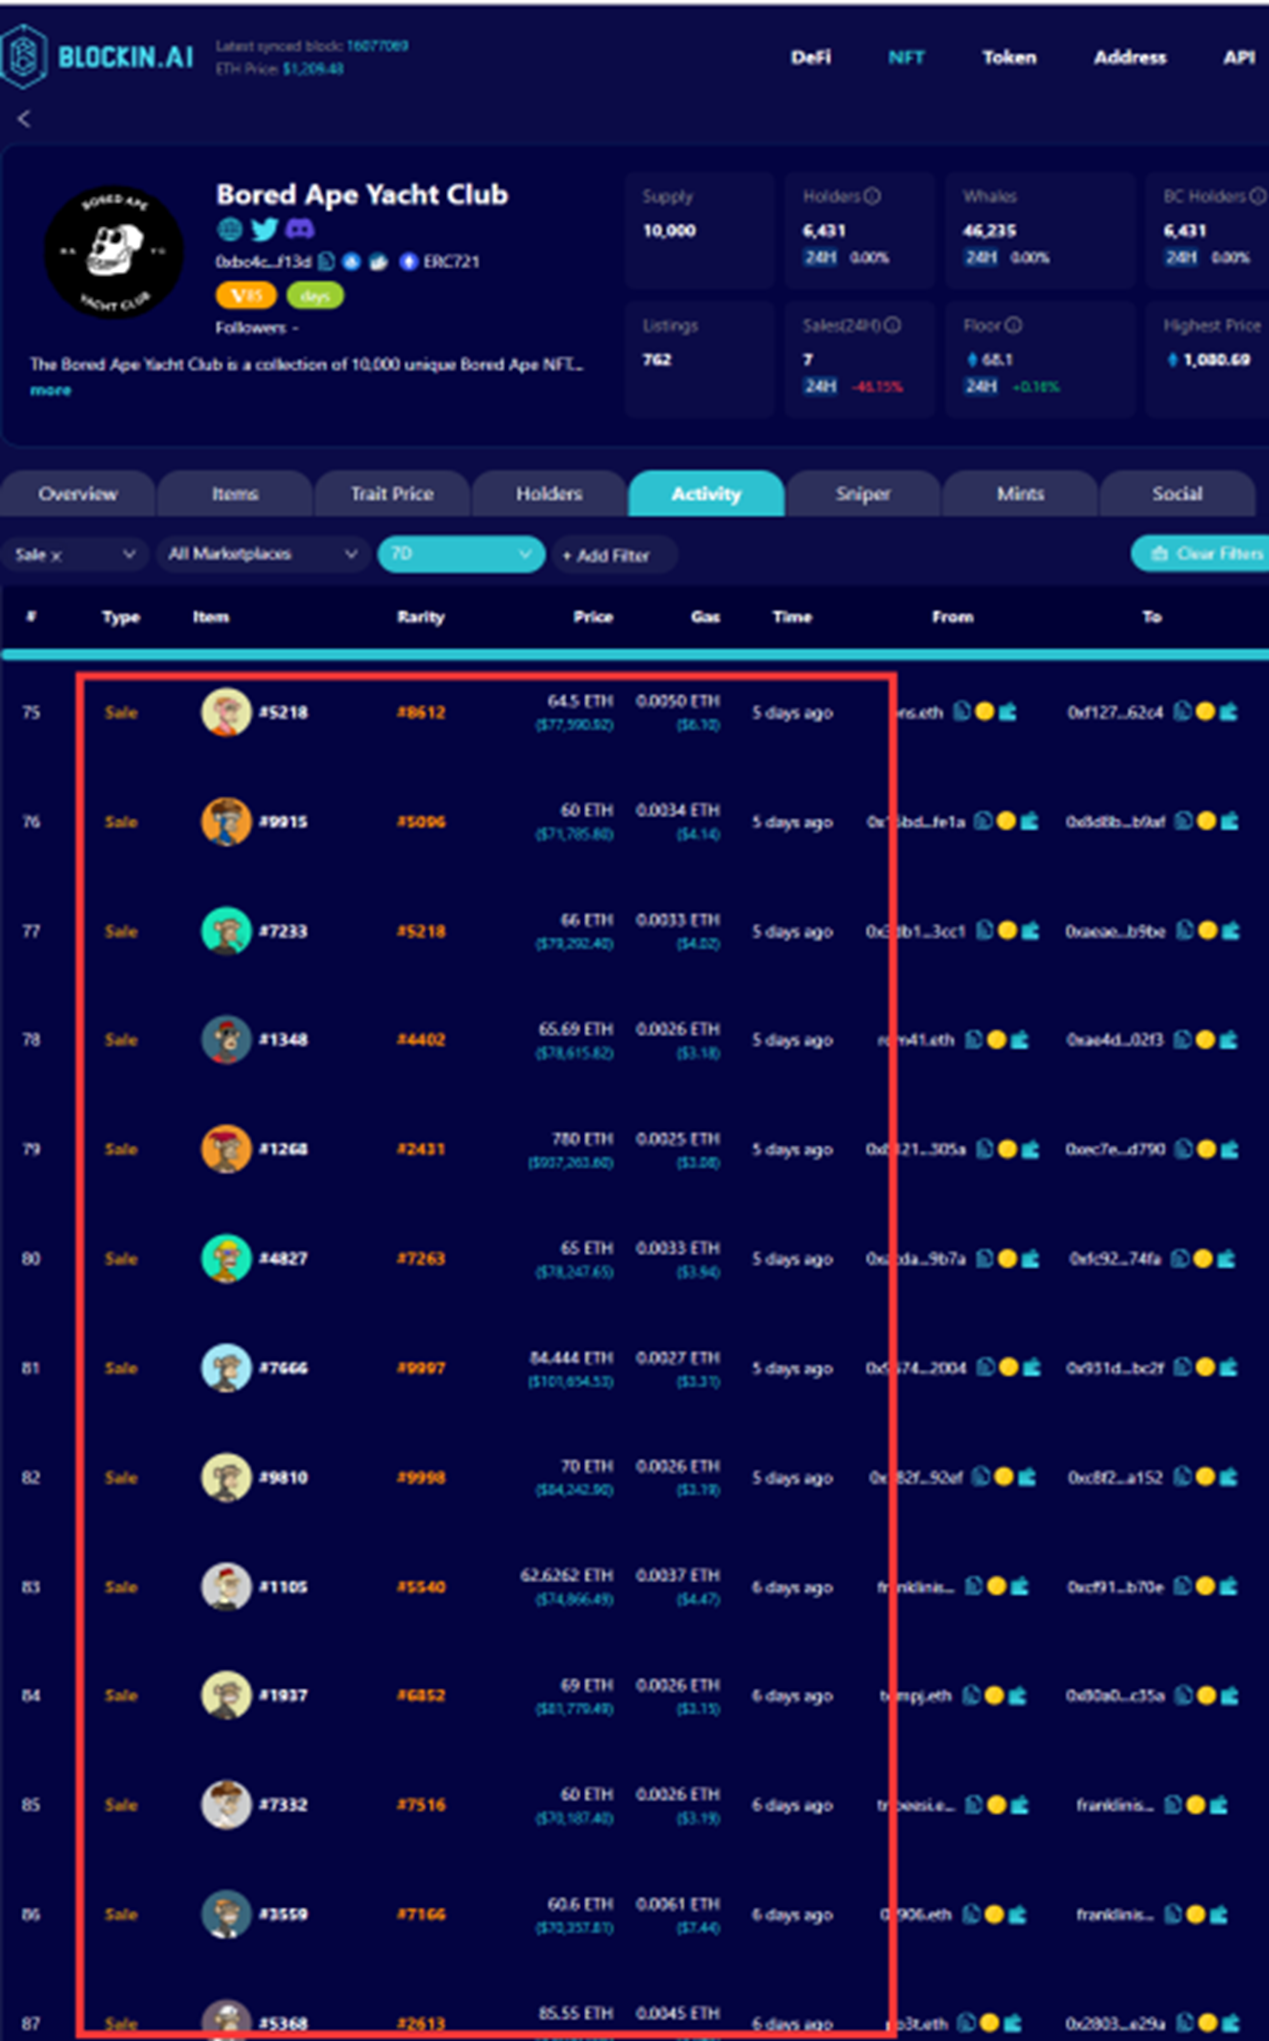
image description
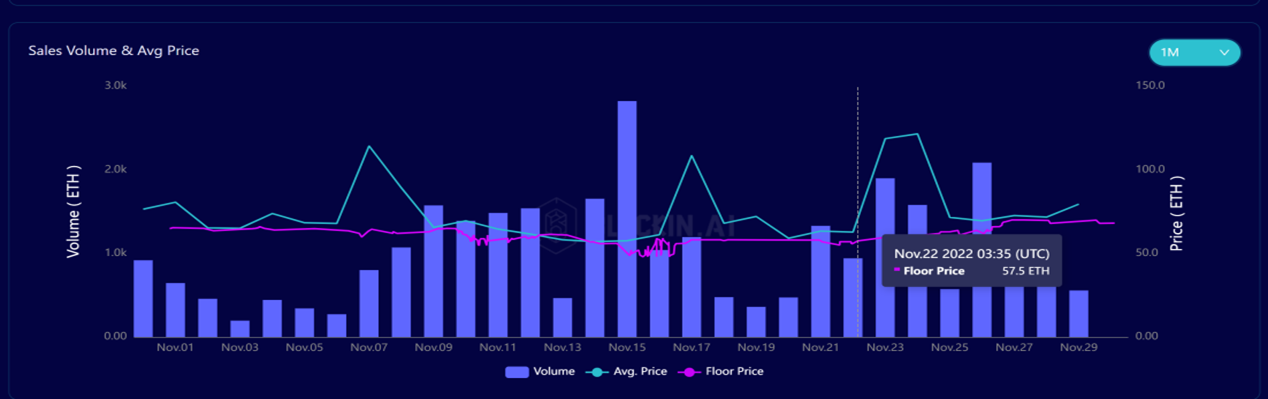
Figure 5 Changes in floor price, average price and trading volume of BAYC in the past 7 days in the past 7 days
We also plotted the proportion of holders whose income is greater than zero in different time dimensions of 6 blue-chip projects, as shown in Figure 6. The income (pnl) is defined as the difference between the reward (revenue) obtained by a certain holder for selling such a Collection in a certain period minus the cost of purchasing such a Collection (spent) (both denominated in ETH).
The specific formula is as follows:

In general, except for the past 1 day, in most time dimensions, the number of holders whose pnl is positive accounts for almost more than 50% of the transaction holders, indicating that most holders buy and sell these blue-chip projects in different time dimensions They are all profitable, and most holders are "smart" and can obtain positive returns from trading in the complex NFT market. In BAYC, the proportion of holders who have made money in trading in the past 7 days is as high as 66.7%, which shows that BAYC has a high probability of making money in the 7-day cycle. We also found that as the time dimension increases, the proportion of holders with positive pnl in different Collections does not increase linearly. Almost in the two time dimensions of 7 day and 15 day, the proportion of holders with positive pnl reaches the highest value. For example, the holders with positive pnl of Mutant-Ape-Yacht-Club and Bored-Ape-Kennel-Club have the highest ratios in the past 15 days, which are 56.48% and 65.38% respectively. The statistical results show that it is easier for holders to make money when trading in the two periods of 7 day and 15 day, and these two time periods are more suitable for short-term trading.
image description
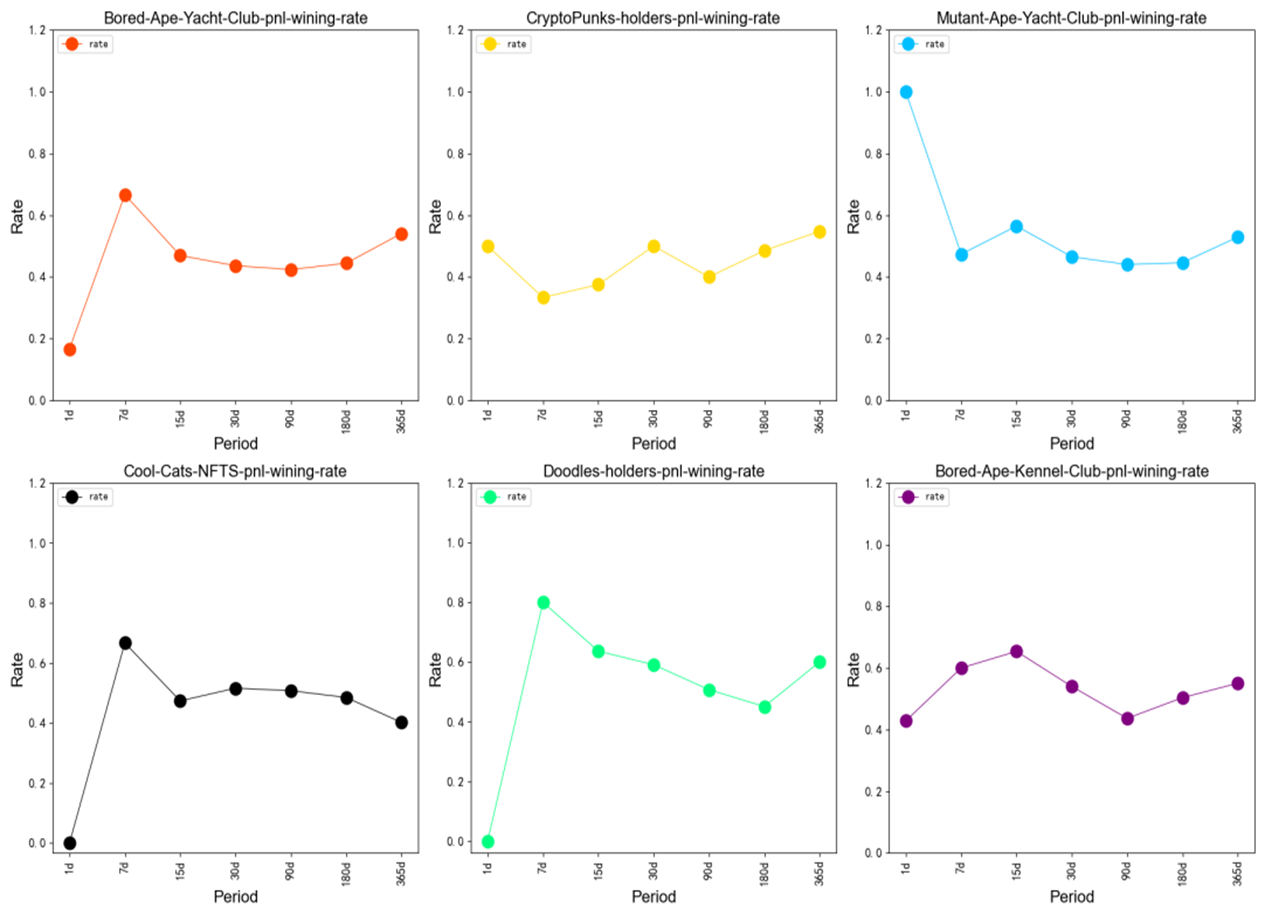
Figure 6 Proportion of holders whose pnl is positive in different time periods of 6 blue-chip projects
4. Transaction analysis at the holders level
How to define a short-term arbitrageur? Our definition of short-term arbitrageurs is as follows: a holder frequently buys and sells NFTs in a certain period, and the total number of purchases and sales is greater than 10.
On the basis of the above definitions, we found several short-term arbitrageur addresses to analyze their specific buying and selling operations, income, and winning rate in a certain Collection.
( 1) *Holders Address: 0x8ad52c3 ab 4233341 f 7 a 5 b 25 dd 0 ebc 4 dcc 26 c 53 ee
*Collection Name:Doodles
* 30 days Pnl: 51.62 ETH
*Doodles Amount: 13
* 30 days Total Transactions Number : 40
The holding quantity and pnl of Doodles bought and sold by this address in the past month are shown above. Figure 7 shows the pnl of this address buying and selling Doodles over all periods. During the period from 2022/10 to 202211/22, this address holds as many as 14 Doodles, as shown in Figure 8. The pnl income of buying and selling Doodles is as high as 51.62 ETH, and the number of times of buying and selling Dooldes in a month is as many as 40 times, which meets the definition of a short-term arbitrageur.
Figure 9 shows the specific cost of buying and selling Doodles with the same token_id at this address within a month, the transaction time and the pnl of each transaction. It can be seen that the address frequently buys and sells the same Doodles within a month (the number of times the same token_id is bought and sold is as high as 9 times), although the winning rate reached 56% (the winning rate is defined as the ratio of the number of profitable transactions to the total number of transactions), the total pnl is negative, which is -4.68 ETH, and the short-term arbitrage has been in a loss state in the past month.
The transaction with the largest loss was buying Doodles with a token_id of 992 on 2022/10/10. The buying price was 9 ETH, and the selling price was 6.55 ETH. The loss reached 2.45 ETH; the most profitable A transaction is 2022/10/12 10.25 ETH to buy doodles with token_id 5359, and 2022/10/25 to sell for 12 ETH. The Doodles project belongs to the scope of NFT 10 (detailed definition can be found atNFTin.aiimage description
image description
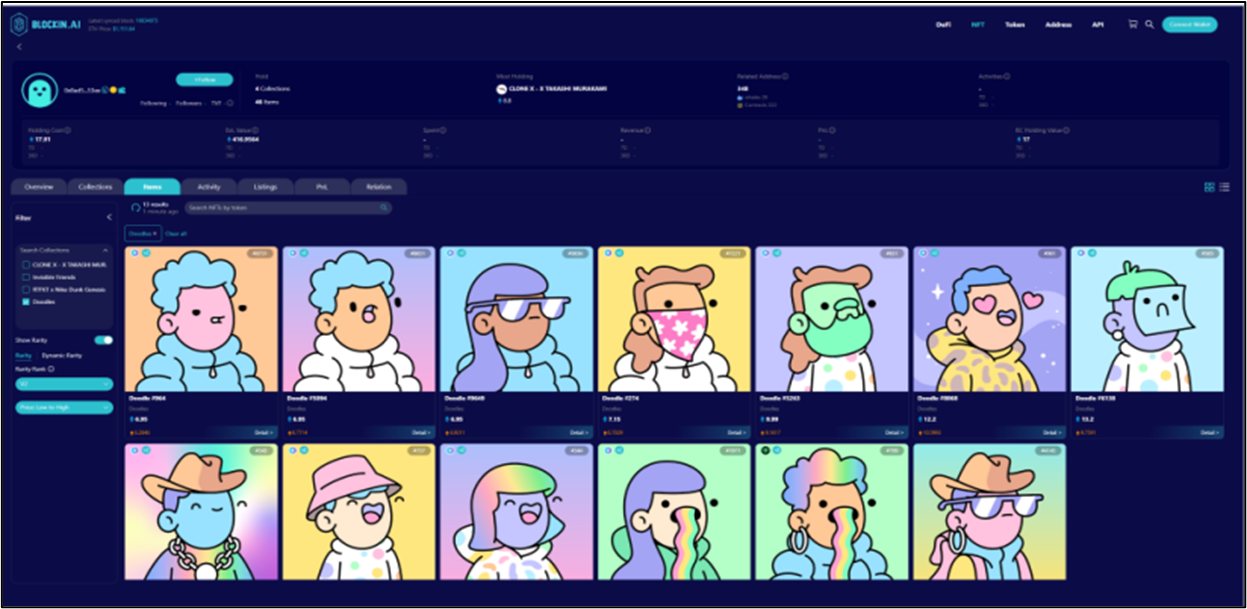
image description
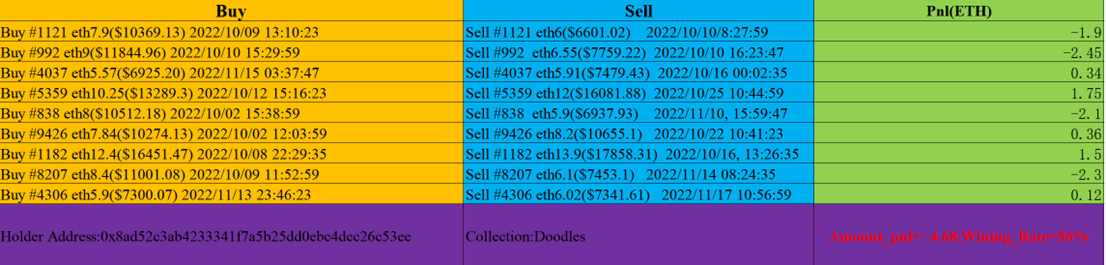
image description
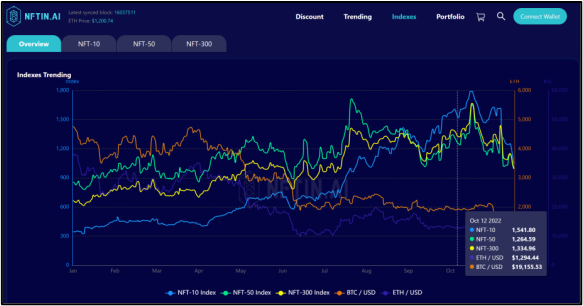
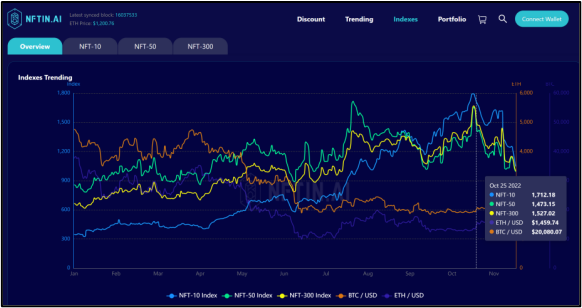
Figure 10 10/12 and 10/25 NFT index, ETH price
( 2) *Holders Address: 0 xed 2 ab 4948 bA 6 A 909 a 7751 DEc 4 F 34 f 303 eB 8 c 7236
*Collection Name:Bored-Ape-Yacht-Club
* 30 days Pnl:-115.16 ETH
*Bored-Ape-Yacht-Club Amount: 9
* 30 days Total Transactions Number : 18
The address has traded pnl and the number of transactions in Bored-Ape-Yacht-Club in the past month as shown above. The total number of transactions in the past month is 18, pnl is -115.16 ETH, and the transaction in one month is in a loss state. This address holds 12 NFTs and has 3 different Collections, but its trading operations are all in the BAYC project, and most of them are short-term trading operations, which is an out-and-out short-term trader. Because the floor price of BAYC has dropped sharply in the past month, the number of BAYC purchases at this address is much higher than the number of sales.
image description
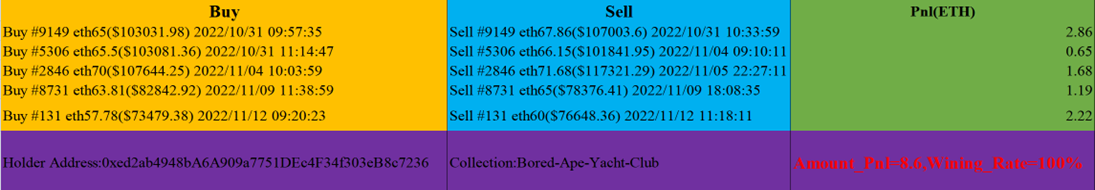
image description
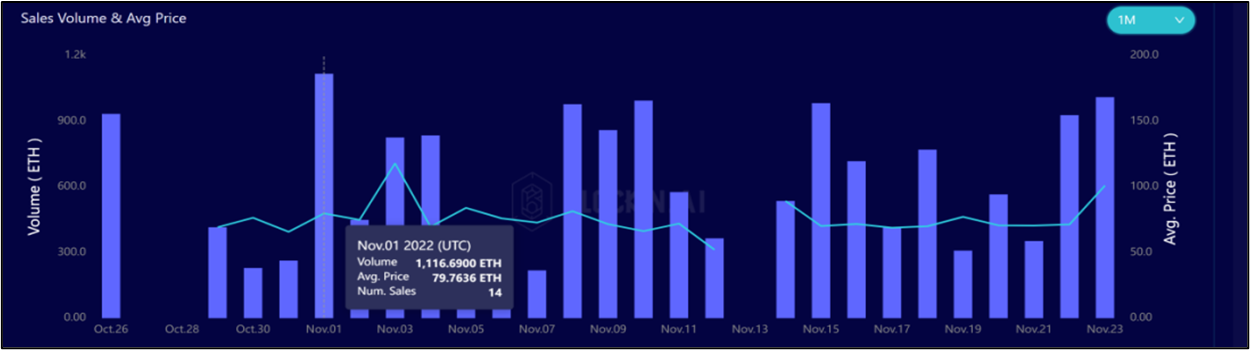
Figure 12 BAYC 2022/11/1 transaction volume, average price and total transaction value
( 3) *Holders Address: 0 x 300 d 65 b 8 2c39 ca 315 cbd 8 c 26 c 9 e 20 d 2267 f 8 edee
*Collection Name:Bored-ape-kennel-club
* 30 days Pnl: 1.17 ETH
*Bored-ape-kennel-club Amount: 15
* 30 days Total Transaction Number: 28
image description
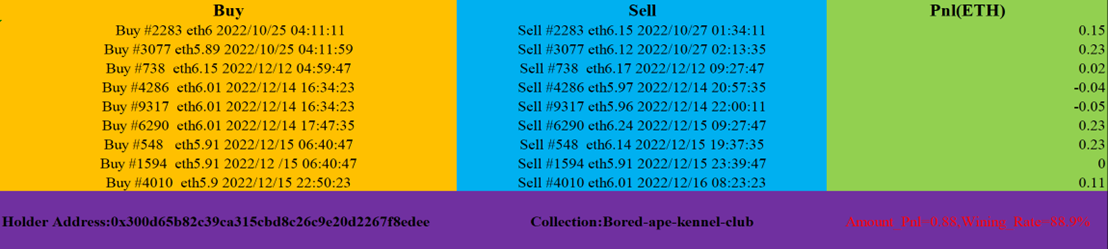
Figure 13 0 x** 8 edee buying and selling Bored-ape-kennel-club in the past 30 days
image descriptionhttps://www.nftin.ai/ethereum/0 xba 30 e 5 f 9 bb 24 caa 003 e 9 f 2 f 0497 ad 287 fdf 95623/548 )

Figure 14 The item whose token_id is 548NFTin.ai12//15 given the valuation
( 4) *Holders Address: 0 x 41963 e 09247348110 f 9 b 25300 b 0 b 6652 f 67 a 4 bee
*Collection Name:Mutant -Ape-Yacht-Clubin
* 30 days Pnl: 5.44 ETH
*Mutant-Ape-Yacht-Club Amount: 13
* 30 days Total Transaction Number: 26
The pnl of buying and selling Mutant -Ape-Yacht-Club of the address in the past 7 days is 5.44 ETH, the number of transactions is 26, and the selling time is all on 12/10, and the selling price is 14.3 ETH, which is a batch sale Out of the operation, and every transaction is a positive return. The address chooses to sell on 12/10, as shown in Figure (15) is close to the floor price. Figure 16 shows the changes in the floor price of Mutant-Ape-Yacht-Club in the past 7 days. On 12/10 The floor price of NFT is higher than the purchase price. Every transaction is profitable, and the winning rate of the transaction is as high as 100%. time, it is easier to obtain positive returns.
image description
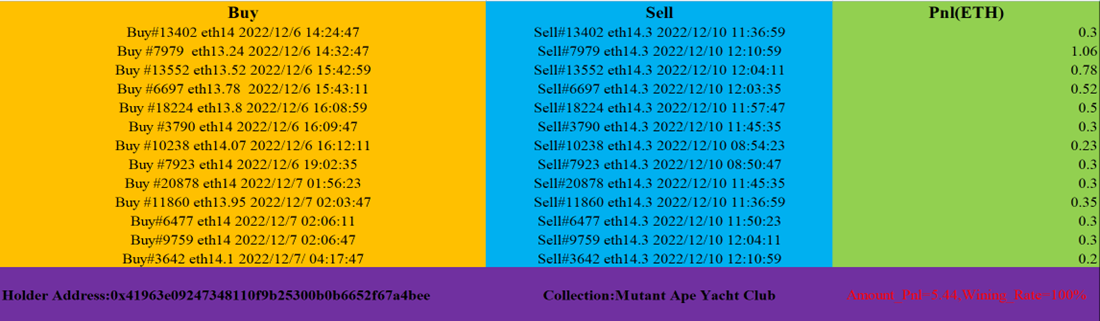
image description
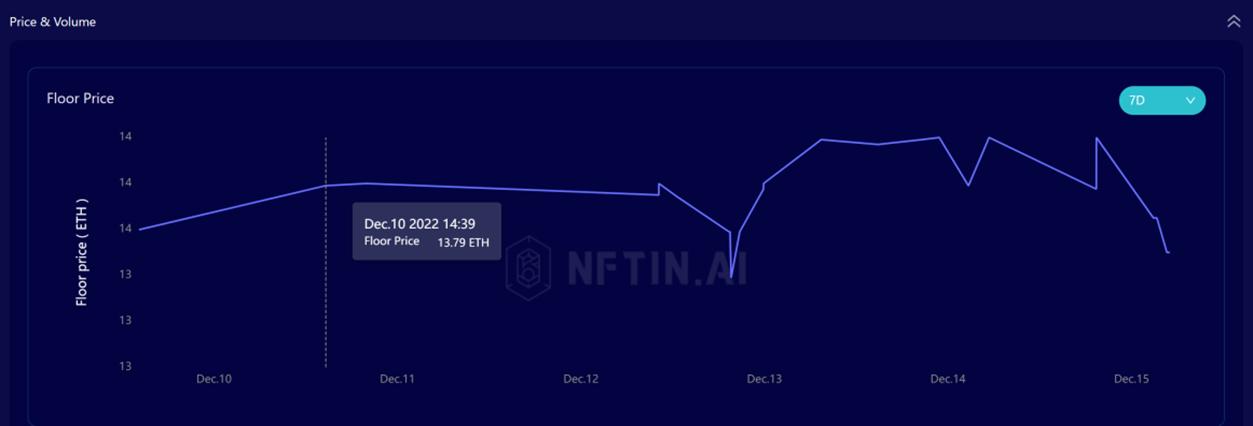
Figure 16 Changes in the floor price of Mutant-Ape-Yacht-Clubs in the past 7 days
5. Analysis of buying and selling transactions based on discount rate
The discount rate (shown in Figure 18) isNFTin.aiThe development and design are designed to help users find the most valuable NFT below their pending order price (the specific page explanation URL is as follows:https://www.nftin.ai/discount), which can provide certain ideas and guidance for users to buy a suitable NFT and obtain the maximum benefit.
The definition of the discount rate is the ratio of the real-time valuation price of NFT minus the pending order price to its valuation price (both denominated in ETH). The formula is as follows:

We selected the discount rate indicator of the MAYC project for the past six months (2022/7 ~ 2022/12) and its specific trading pending order operations to analyze the specific profitability of holders. As shown in Figure 17. (Note: Since there may be multiple pending orders in the same transaction, we only study the relationship between the price of the lowest pending order and the transaction price and valuation), among them, the number of pending orders and final transactions is 180, and the discount rate is greater than 0. There are pending orders and The number of transactions is 49. Through statistics, it is found that in the total transactions with transactions and pending orders, the average profit (avg_profit) is 3.24 ETH, while the avg_profit of transactions with pending orders and completed transactions with a discount rate greater than zero is 14.21 ETH. It is higher than the average income of the total transaction, which is 4.38 times of the average income of all transactions with pending orders and transactions. Among them, the statistical positive transaction return rate (that is, the ratio of transactions with income greater than zero to the total transaction) is 67.35%, which is also greater than the positive transaction rate of all transactions. To the transaction rate of return. This is very favorable evidenceNFTin.aiimage description
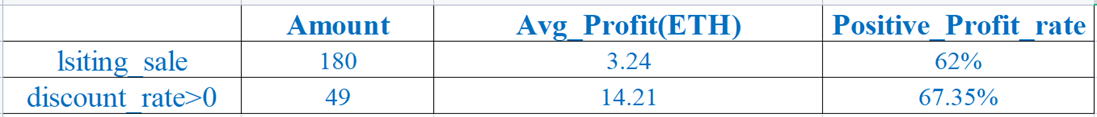
Figure 17 MAYC’s Pending Orders-Sale Proceeds in the Past Half Year
We also draw a scatter diagram of the distribution of discount rate and income when the discount rate is greater than zero, as shown in Figure 19 (excluding the maximum point of income and the maximum point of discount rate). It can be seen from the figure that the discount rate is mostly distributed between 0 and 10%. At this time, avg_profit is 17.13 ETH, which is greater than 14.21 ETH. In order to obtain greater profits, MAYC holds can choose to buy and sell within its range. In the range of % ~ 20% discount rate, the avg_profit of holders is only 5.3 ETH, and the discount rate is greater than 20%, and the income of holders for trading is negative.
Through the analysis of the MAYC project discount rate and pending order transaction data, short-term arbitrageurs can refer toNFTin.aiimage description
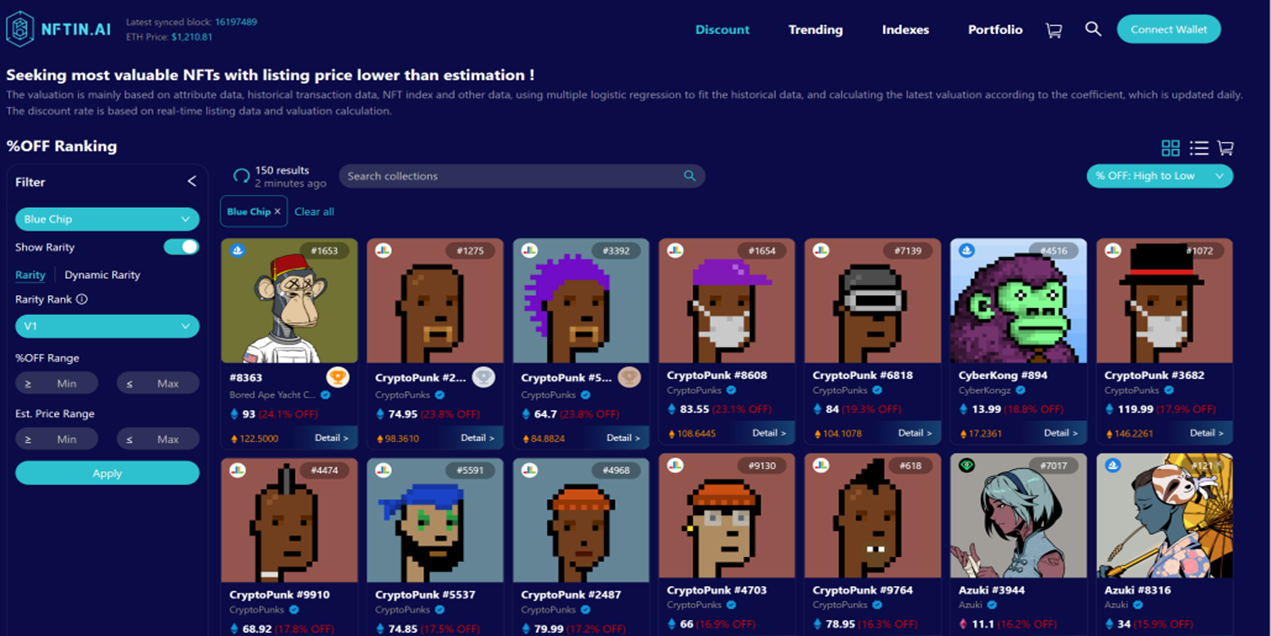
Figure 18NFTin.aiimage description
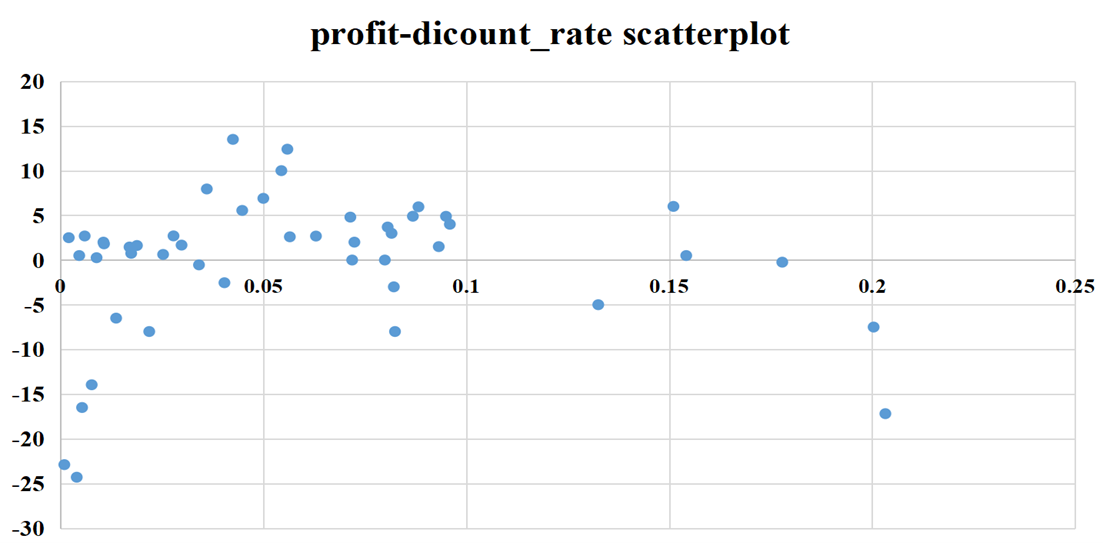
Figure 19 Scatter diagram of discount rate and income when MAYC discount rate is greater than zero
6. Summary
The success rate of short-term arbitrage depends largely on opportunities. Due to the periodic hype of liquidity, market and projects, the NFT market will not be in a long "cold period". For a long time, short-term arbitrageurs have been profitable. Our summary of the research on short-term arbitrageurs is as follows:
1. Short-term buying and selling behaviors in the NFT market are ubiquitous, and short-term trading profits are objective and account for a large part of all transactions;
2. The holders of different Collections have different trading returns in different periods, and choosing an appropriate period for short-term operations can maximize returns;
3. For short-term arbitrageurs, it is relatively low-frequency, and it is easier to obtain higher returns in a short period of time, and it is necessary to pay attention to the macro dynamic changes of the NFT market while trading.
4. For short-term traders, you can pay attentionNFTin.aiOfficial website discount rate indicator, discover the most valuable NFT, and provide certain reference and ideas for actual transactions.


