
In-depth comparison of Dex market-making algorithms, and detailed explanation of the efficiency improvement brought about by centralized liquidity
introduction
introduction
In the development of DEX, the iteration of the algorithm and the change of the market-making form are the main lines. From constant price and constant product market making to various centralized liquidity algorithms, the efficiency of DEX's underlying market making algorithms is getting higher and higher. Under the big waves, the performance of DEX that adopts centralized liquidity solutions is at the forefront of the market. Uni V 3, Curve V 2, and DODO are among the best. The three adopted different methods to achieve the concentration of liquidity, improve the capital efficiency of LP, and achieved great success in the market. This article will analyze the underlying market-making algorithms from multiple dimensions, compare the data performance of the underlying algorithms of the three exchanges in depth, and compare the overall market performance of the three exchanges.
first level title
concentrated liquidity
The constant product market-making formula: x*y=k is regarded as a breakthrough innovation in the DeFi field. It created the transaction form of the capital pool model to realize on-chain transactions, but the constant product AMM market-making curve also has unavoidable efficiency problems.
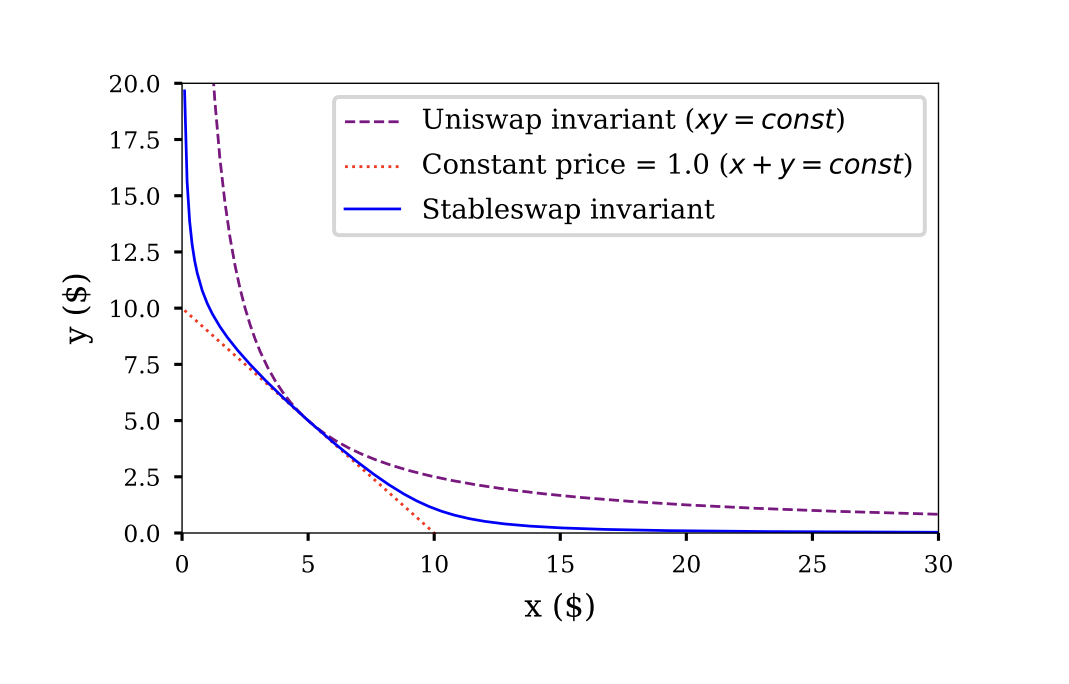
The early version of Uniswap (Uni) adopted the constant product market-making formula. It can be seen from the figure that its liquidity is evenly distributed on the curve, and the theoretical fluctuation range of the token price is from 0 to infinity, while the fluctuation range of the token price in the market is concentrated in a small range. Therefore, liquidity outside of price fluctuations is not really provided to the market, which causes efficiency losses. In this case, slippage, market depth, and impermanent losses are all negatively affected.
image descriptionConcentrating liquidity is to change the liquidity distribution on the market-making curve in some way, concentrate liquidity in the most frequently traded range in the market, and improve the efficiency of market-making funds. In a broad sense, any attempt to adjust the market-making curve to change the liquidity distribution of the fund pool can be called concentrated liquidity. Uni V 3, Curve V 2, and DODO are all typical DEXs with concentrated liquidity, but the obvious differences in the underlying algorithms also make each of them have different differences.
image description
Uni V 3, Curve V 2, DODO —— three kinds of market-making curves with concentrated liquidity
Uni V 3
first level title
Range pending orders and leveraged liquidity
The Range Order proposed by Uni V 3 allows users to provide liquidity in a specific price range, that is, to concentrate market-making funds in a specific price range, and the liquidity distribution of the entire pool is the sum of all curves. LP provides leveraged liquidity, because LP funds only work within its selected price range. If it is within the range, the efficiency of market-making funds to earn handling fees will be doubled; if it is outside the range, the market-making funds will become invalid.
image descriptionSchematic diagram of pending orders in multiple ranges (Source: "Uniswap V 3: Liquidity providing 101" by MellowProtocol)The way Uni V 3 concentrates liquidity is to provide a mechanism for leveraged liquidity, which concentrates liquidity around the market price through the subjective behavior of LPs
image description
USDC / ETH 0.3% Pool liquidity distribution (source: Uniswap official website)
Design Analysis and Strengths and Weaknesses
Advantage
The design purpose of Uni V 3 is to improve the capital efficiency of LP. LP can freely choose the range of liquidity provided according to its own judgment, and conduct customized market making. Although this design improves the market-making efficiency of LPs as a whole, the benefits of LPs are unbalanced and additional decision-making costs are added. LPs are more proactive in making markets, but to some extent, this is contrary to the original intention of DEX to make markets inertly. Most retail investors do not have the ability to predict the market, but instead face higher risks of impermanent losses due to leveraged liquidity. This design also gave birth to the phenomenon of JIT (Just In Time) attacks, making market-making operations more complicated.
Advantage
High flexibility, you can customize the price range of market making, and control the efficiency of funds by yourself.
Market liquidity distribution is formed by pending orders of all LPs, which is subjective and closer to market behavior.
The upper limit of capital efficiency is high.
disadvantage
Curve V 2
LP income depends on LP's ability to judge the market, which increases LP's decision-making cost, leads to uneven income of LP, and there are cases of JIT attacks.
While improving efficiency, risks are increased, and highly leveraged liquidity will face higher impermanent losses.
Automatically adjust the price curveCurve V 2 is designed by Curve for unstable assets. The core idea is the same as Curve's StableSwap. Let us review the StableSwap proposed by Curve.This makes the curvature of the curve smaller near the fixed price, and realizes the concentration of liquidity at the fixed price.
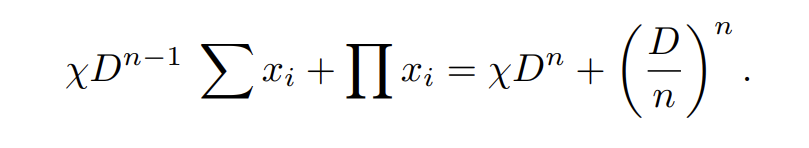

image description
Source: Curve WhitepapertextAnd this generation of algorithms will dynamically adjust the price and the degree of centralized liquidity according to the internal oracle
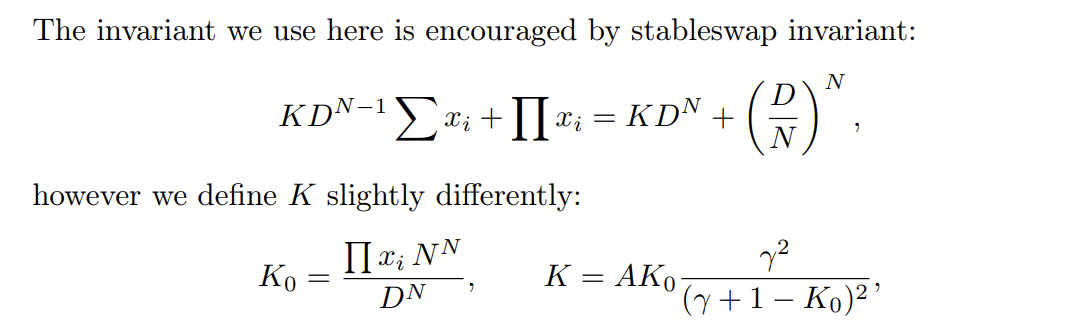
. Curve V 2 defines the K value, which is a dynamically adjusted parameter, which determines the shape of the curve. The larger the K value, the smaller the curvature, the closer the curve is to the constant price curve, and the more concentrated the liquidity.
image descriptionCurve V 2 will calculate the D value based on the internal oracle, and this parameter will determine the anchor price, that is, the price at which liquidity is concentrated.
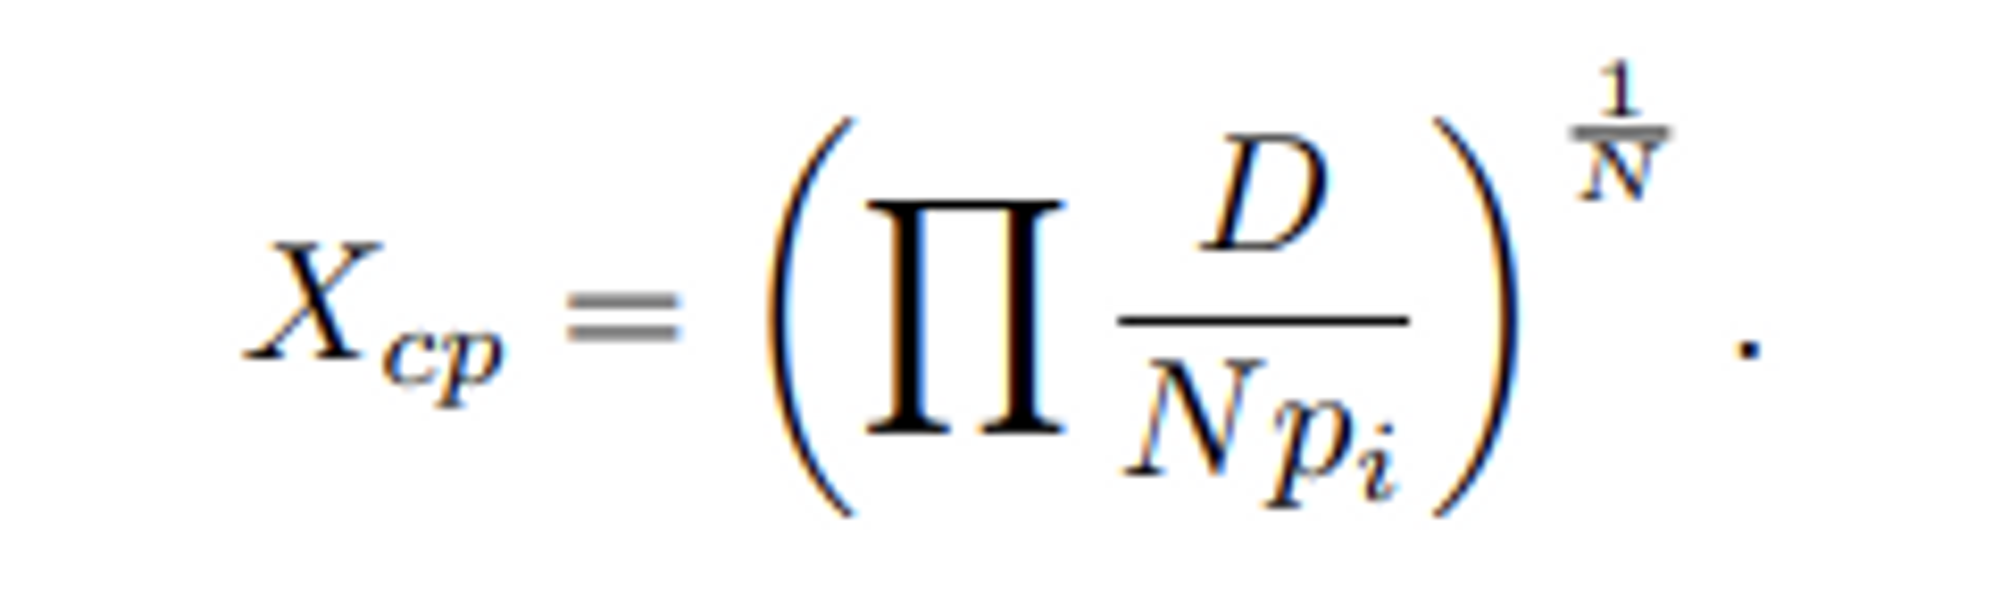
image description
Source: Curve Whitepaper
Design Analysis and Strengths and Weaknesses
Advantage
The design of Curve V 2 is relatively simple. It concentrates liquidity by mixing constant product and constant price curves, and the internal oracle determines the anchor price. In this design mode of Curve V2, the price change of the internal oracle machine is realized through the user's trading behavior. When a large number of trading behaviors make the price deviate to a large extent, the internal oracle machine updates the price and the liquidity distribution changes happened.
Advantage
Reduce the slippage near the transaction price through the original market-making curve to ensure market depth, and the market-making function is applicable to various tokens.
The internal oracle dynamically adjusts the anchor price to ensure transactions near the market price.
Dynamically adjust the transaction fee, the farther away from the price equilibrium point, the higher the fee, so as to provide a better price near the market price.
disadvantage
DODO
The price adjustment of the internal oracle machine depends on the user's transaction behavior, which has a certain lag and cannot adjust the liquidity distribution in advance.
Market Maker Quotation Adjustment Curve
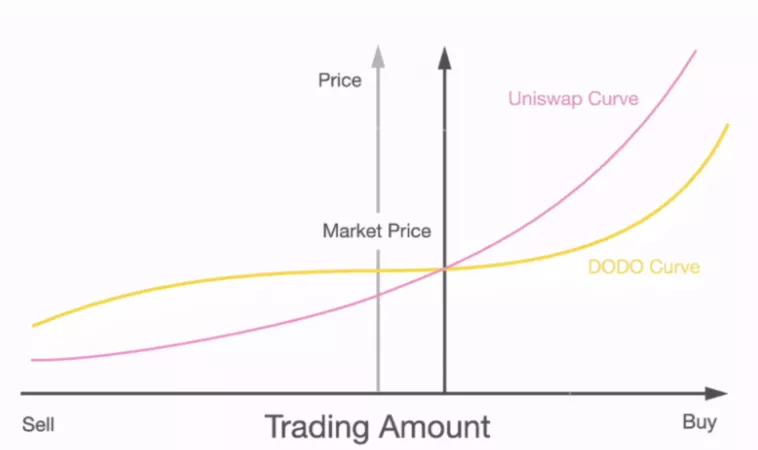
DODO provides liquidity through the original PMM algorithm. The PMM algorithm introduces a reference price, and market makers concentrate liquidity around the market price through independent quotations. Different from the AMM-based market-making algorithm, the price calculation of the PMM algorithm is based on two factors: external price and inventory. When the external price changes, the conversion ratio of tokens will directly change. When users trade with the pool, the inventory will change and the price will also change. Therefore, the token price determined by the PMM algorithm depends on the external price and user trading behavior, so that DODO can adjust the liquidity distribution in advance and always keep the liquidity near the external price.
text
The specific form of the PMM algorithm is as follows, where the parameter i is the external price, which is provided by the market maker’s quotation, k is the parameter controlling the degree of liquidity concentration, the smaller k is, the more concentrated the liquidity is, B and Q are the inventory of tokens, This formula describes the relationship of marginal price with changes in inventory and changes in external prices.
Design Analysis and Strengths and Weaknesses
Advantage
From a design point of view, DODO actually refers to the liquidity distribution of CEX. The external price is provided by the quotation of the market maker, and the external price provided by the oracle machine is actually the market price formed by the user's transaction in CEX. At present, the liquidity of CEX still dominates the market, and adjusting liquidity according to external prices has greatly improved market-making efficiency.
Advantage
Through the original PMM algorithm market making, external prices are introduced, the liquidity is anchored near the market price, and the transaction price with low slippage is provided.
The capital efficiency is high, and it can support a larger transaction volume under the same capital.
The liquidity distribution is adjusted quickly, so that DODO's liquidity can quickly synchronize with the market.
Relying on external prices, there is a risk of deviation from market maker quotes, and external prices represent high liquidity in the market, not DODO's internal liquidity.
first level title
Comparison of Market Making Curves——Taking ETH Trading Pool as an Example
first level title
data processing
Comparing the trading pools of different DEXs is very difficult due to the different market-making algorithms, such as data source issues, comparative analysis issues, and how to determine a comparison standard.
Based on this, the data analysis in this paper is processed as follows:
Select the USDC/WETH 0.05% pool of the Uni V 3 Ethereum main network, the USDT/WBTC/WETH 3 crypto pool of the Curve Ethereum main network, and the USDC/WETH market maker pool on DODO Polygon as samples. These three sample pools are WETH is a trading pair for stablecoins. Directly query the smart contract data to obtain the underlying parameters, and calculate the liquidity distribution according to the market-making curve of each exchange.
The range of liquidity data is from January 1, 2022 to August 16, 2022, and the data interval is one hour.
Transaction volume and TVL data range from June 16, 2022, to August 16, 2022.
All data samples are synchronized with timestamps and block heights.
All data visualization parts are normalized for the unification of visual effects.
For the needs of calculation and processing, the total liquidity distribution adopts the liquidity in the range of ETH price from 100 to 10000.
Uni V 3
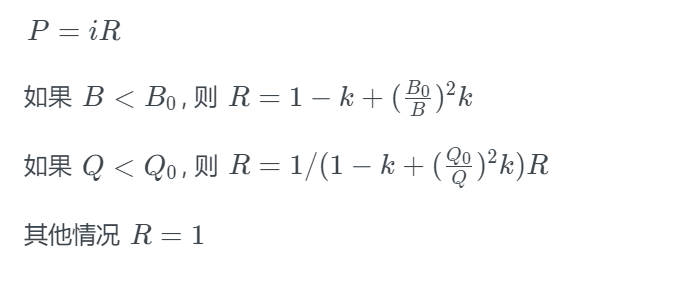
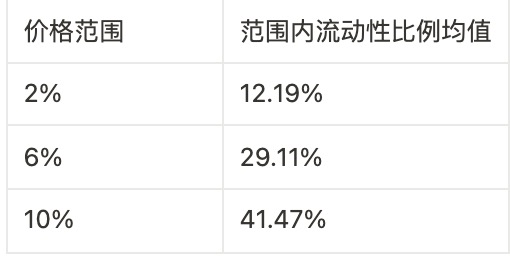
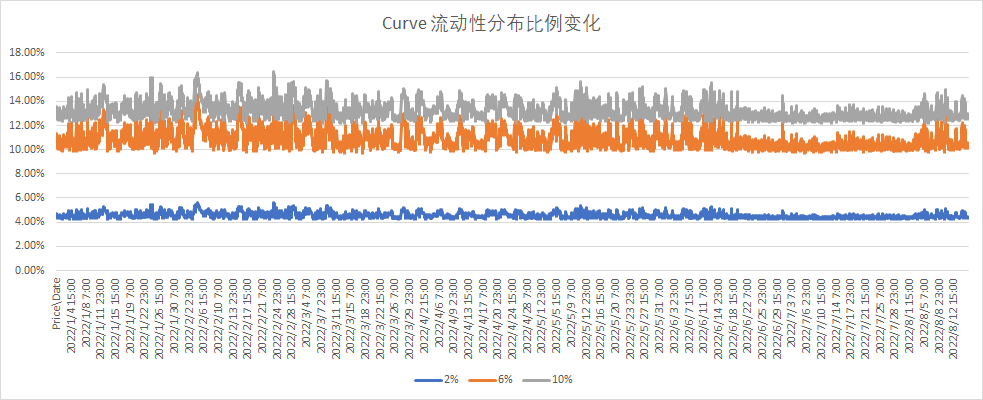
Changes in liquidity distribution within the selected time span, 2% represents the proportion of liquidity in the price range of plus or minus 2% of the market price to the total liquidity, 6% and 10% are the same.
💡For the USDC/WETH 0.05% pool of Uni V 3, the overall concentration of liquidity is relatively high, the volatility is large, and it is different in different market environments. In some cases, the market price and the highest There will be a large deviation between the prices of liquidity.
Uni V 3 USDC/WETH 0.05% Pool liquidity distribution changes over time (data source: Ethereum)
texttextThe liquidity of Uni V 3's 0.05% WETH/USDC pool has a relatively high concentration of liquidity most of the time, and the liquidity within 10% accounts for as high as 40% of the total liquidity on average, basically achieving concentrated liquidity.
Overall, the concentration of liquidity in the WETH 0.05% pool of Uni V 3 has maintained a relatively high level over a long period of time, realizing the design purpose of V 3.
image descriptionChanges in liquidity distribution ratio of Uni V 3 USDC/WETH 0.05% Pool (data source: Ethereum)When the market fluctuates greatly, the liquidity distribution of the pool will change greatly, and the concentration of liquidity near the market price will decrease rapidly
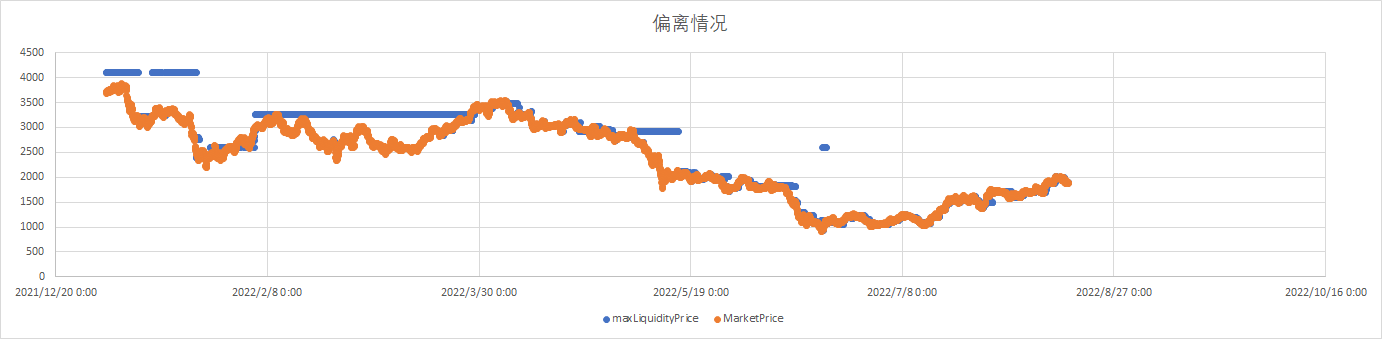
. For example, from May 6th to May 13th, and from June 10th to June 19th, with the sharp drop in the price of ETH, the liquidity distribution of the pool was adjusted rapidly, and a large number of user behaviors led to liquidity around the market price The degree of concentration has dropped significantly, and users have adjusted the market-making scope beyond the market price, and the liquidity within 10% has been reduced to below 10%. Therefore, when the market price fluctuates violently, due to the mechanism design of Uni V 3, users will predict the market and withdraw liquidity in advance, reducing the concentration of liquidity.
image description
Curve V 2
The deviation between Uni V 3 USDC/WETH 0.05% Pool market price and the highest liquidity price (data source: Ethereum)
💡 The USDT/WBTC/WETH pool of Curve V 2, that is, the 3 crypto pool has a higher concentration of liquidity distribution and lower volatility. There will be a certain deviation between the market price and the price with the highest liquidity most of the time, but the maximum will not exceed 1%. User transaction behavior itself will lead to internal oracle price adjustments, and the dynamic simulation of Curve V 2 changes is more complicated, and there are differences between off-chain and on-chain computing environments, so this article does not consider the dynamic changes of Curve V 2, low price The liquidity distribution of the scope is more informative.
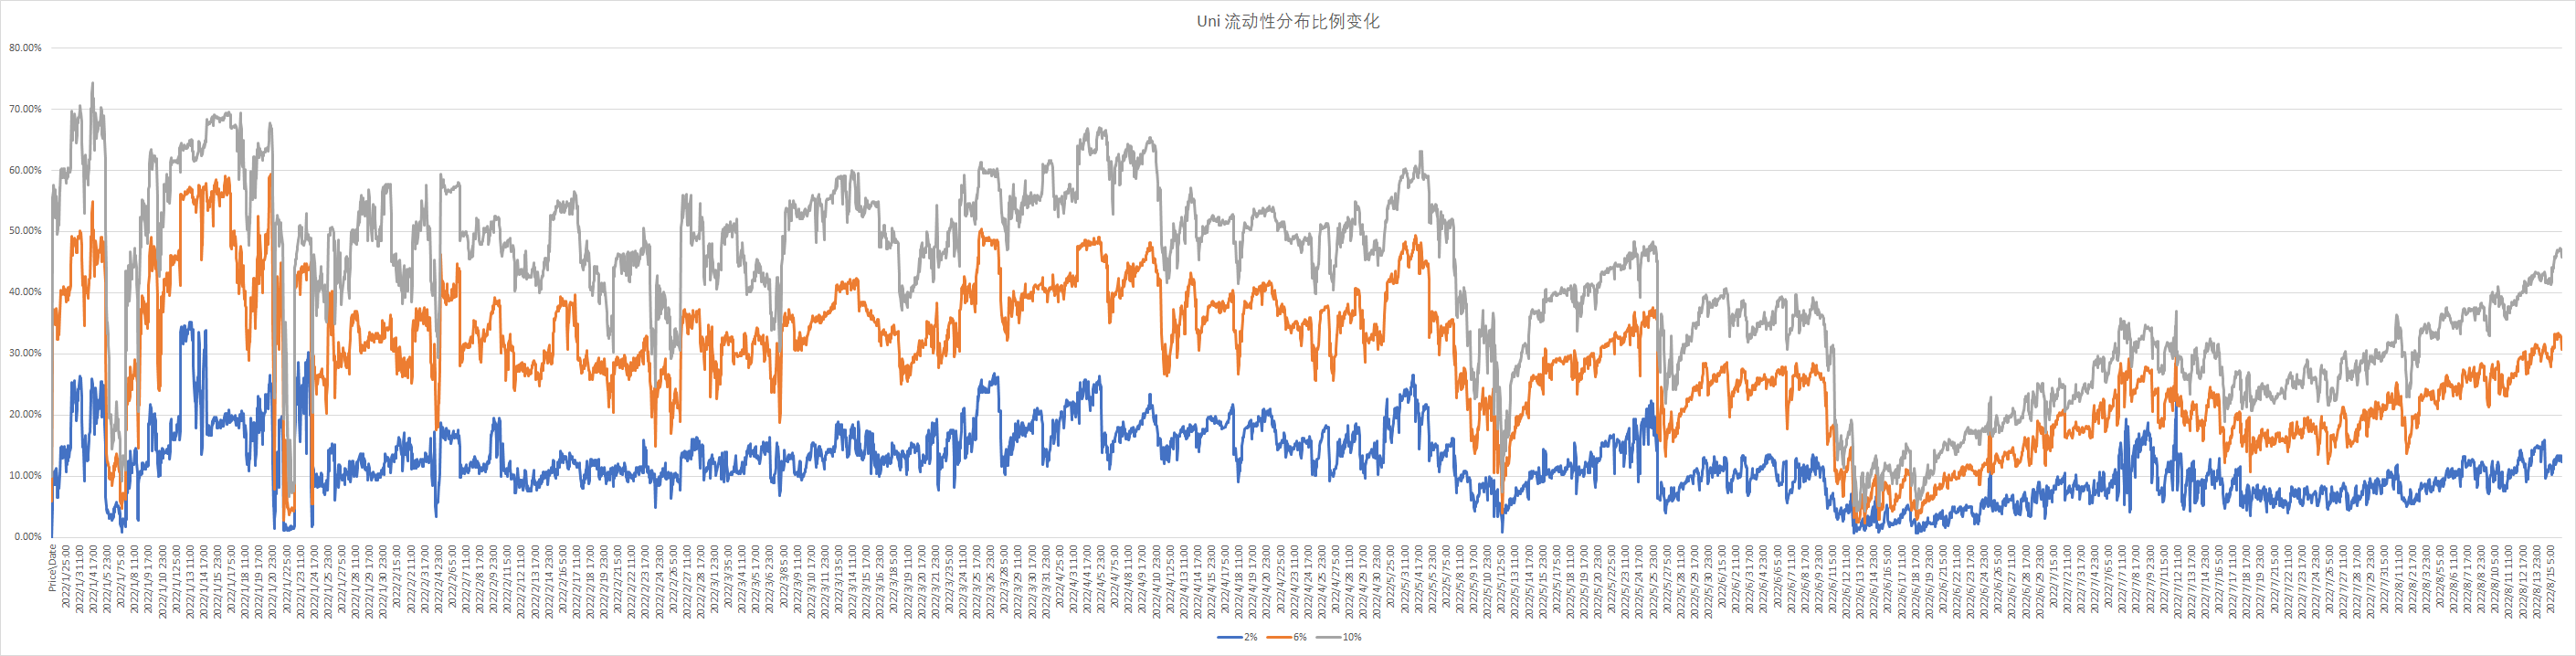
Liquidity distribution mean
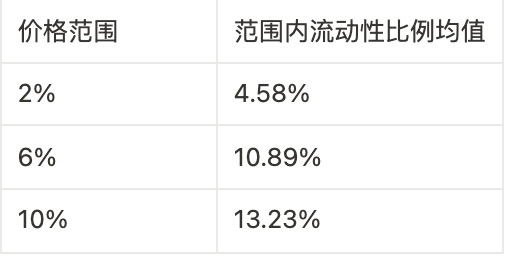
image descriptionCurve 3 crypto Pool liquidity distribution changes over time (data source: Ethereum)The liquidity distribution of Curve V 2’s USDT/WBTC/WETH pool fluctuates less, and it presents the characteristics that the larger the price range, the higher the volatility, and the liquidity is concentrated near the market price.
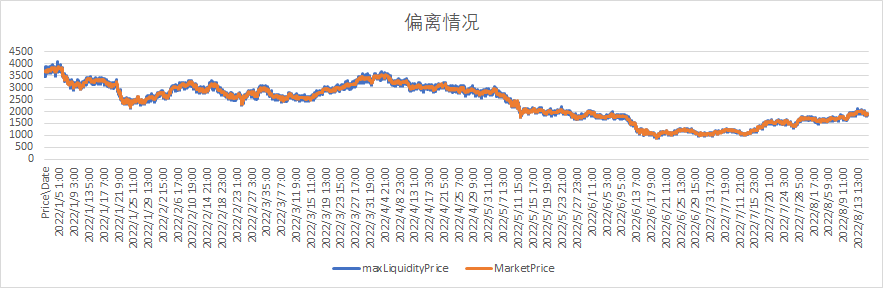
image description
As can be seen,The deviation between the market price of Curve 3 crypto Pool and the highest liquidity price (data source: Ethereum). This is caused by the characteristics of the algorithm itself. Since Curve will update the oracle price when the user's transaction makes the price deviate from a certain critical value, there will be a certain time lag, but the price deviation of Curve is relatively small.
DODO
secondary title
💡 DODO's USDC/WETH pool has the highest concentration of liquidity distribution, because DODO market makers generally set the K value very small, and update the reference price at high frequency, thus concentrating liquidity. Due to the high quotation frequency of DODO market makers, a high degree of anchoring is maintained between the market price and the price with the highest liquidity.
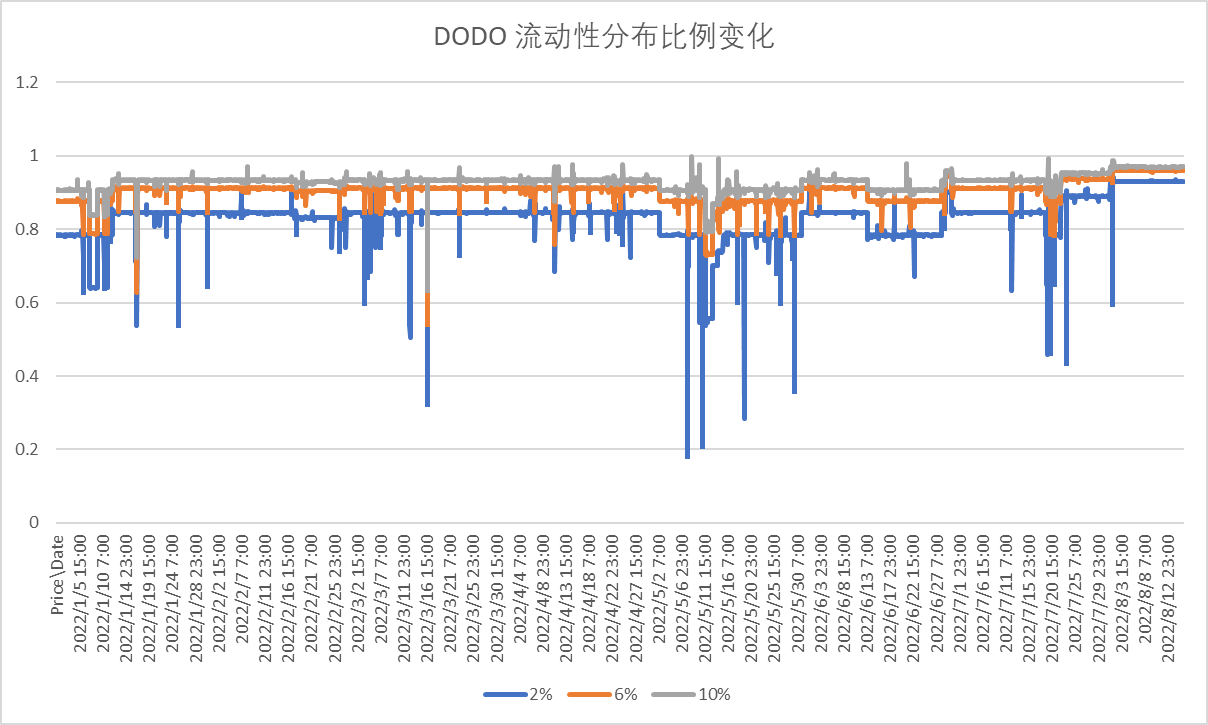
Liquidity distribution mean
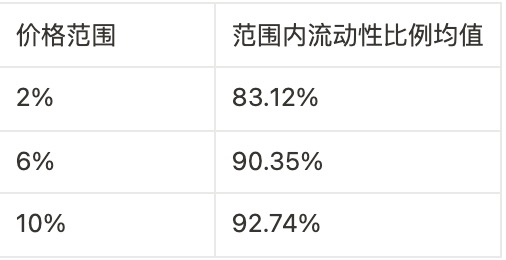
image descriptionDODO USDC/WETH Pool liquidity distribution changes over time (data source: Polygon)The liquidity distribution of DODO's USDC/WETH pool fluctuates greatly, and the degree of liquidity concentration near the market price is very high.
From the data point of view, in general, DODO’s market makers will set the K value to 0.01 at least, so as to achieve a high degree of liquidity concentration. However, market makers will quickly adjust the K value and adjust the liquidity distribution when the market is extremely volatile. Since the PMM algorithm provides a very flexible adjustment space for market makers, the adjustment of liquidity distribution is very flexible. Generally speaking, liquidity The degree of concentration is relatively high.
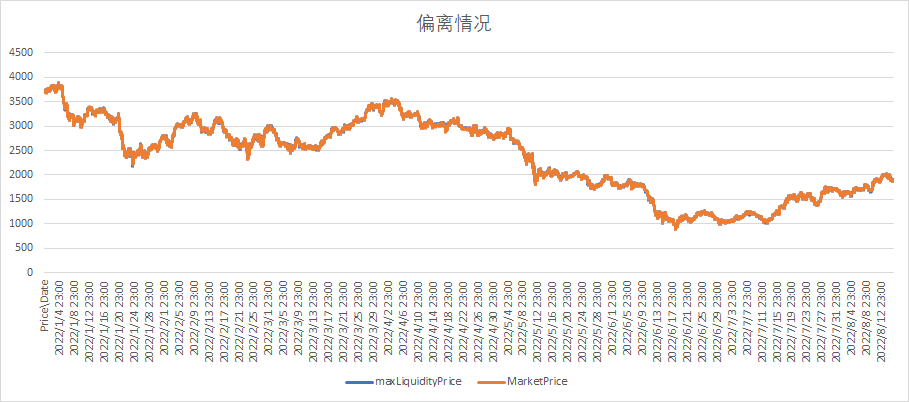
image descriptionSince DODO's PMM algorithm makes the market through market makers, provides quotations, and introduces external prices, it maintains a high degree of anchoring between the market price of the pool and the price with the highest liquidity.
At the same time, for the PMM algorithm, the price with the highest liquidity is the external price provided by the market maker. Therefore, the above figure also shows that the external price is not much different from the market price, which means that there will be no large-scale transactions by users The market price deviates greatly from the market maker's quotation, that is, the market maker's price adjustment of DODO can keep up with market changes in time.
first level title
This paper obtains the transaction volume and TVL data of three sample pools, and uses Volume/TVL as a proxy indicator of capital efficiency. This indicator measures the transaction volume that can be brought by each unit of TVL, reflecting the market-making efficiency of funds.
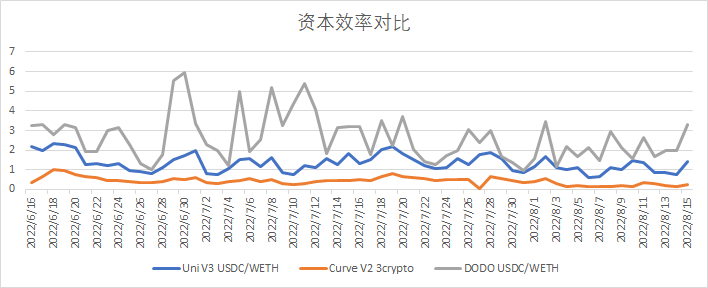
Since the absolute values of transaction volume and TVL differ greatly among the three sample pools, we directly compare capital efficiency.
image descriptionComparison of sample pool capital efficiency (data source: Ethereum, Polygon)From the performance of the sample pool,
The capital efficiency of DODO USDC/WETH is higher than that of the Uniswap USDC/WETH pool, and higher than that of the Curve 3 crypto pool, which is consistent with the corresponding liquidity distribution
market performance analysis
secondary title
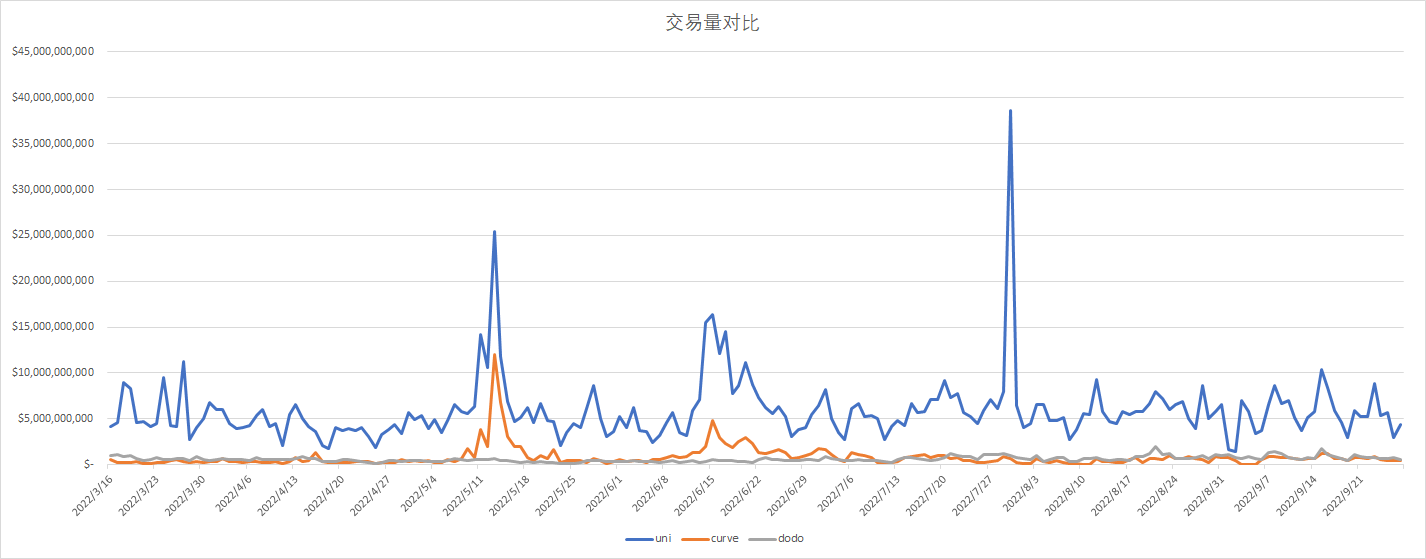
image description
text
secondary title
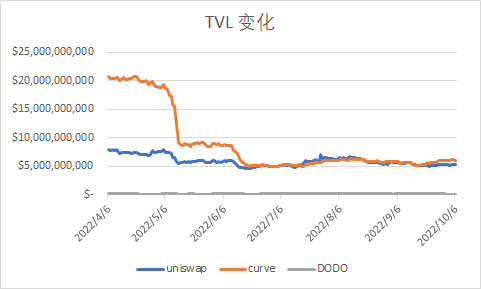
TVL comparison
Comparison of TVL changes in various exchanges (data source: Defillamma)
secondary title
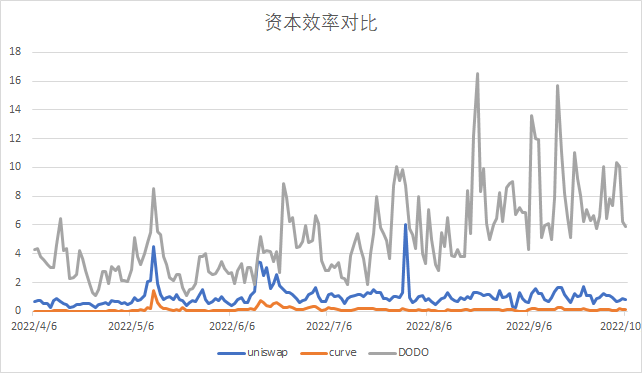
Capital Efficiency Comparison
Comparison of changes in capital efficiency of various exchanges (data source: Coingecko, Defillamma)
references
https://messari.io/article/dex-education-uniswap-optimistic-rollups-and-the-layer-2-dex-landscape
https://members.delphidigital.io/reports/uniswap-vs-curve-which-is-the-best-dex
https://www.paradigm.xyz/2021/06/uniswap-v 3-the-universal-amm
https://messari.io/article/the-chronicles-of-uniswap-the-token-the-switch-and-the-wardrobe
https://www.nansen.ai/research/the-market-making-landscape-of-uniswap-v 3
https://resources.curve.fi/base-features/understanding-curve
https://docs.dodoex.io/chinese/dodo-xue-yuan/pmm-suan-fa-gai-lan/pmm-suan-fa-xi-jie
https://www.nansen.ai/research/the-market-making-landscape-of-uniswap-v 3
https://uniswap.org/blog/uniswap-v 3-dominance
https://dune.com/msilb 7/Uniswap-v 3-Pair-Deep-Dive
disclaimer
https://blog.dodoex.io/ Five minutes to understand -pmm-algorithm behind dodo-a general liquidity framework and multiple use cases-39 a 49 c 222 aff
disclaimer
Copyright Notice
about Us
Without the authorization of DODO Research Institute, no one may use without authorization (including but not limited to copy, disseminate, display, mirror, upload, download, reprint, excerpt, etc.) or allow others to use the above intellectual property rights. If the work has been authorized to be used, it shall be used within the scope of authorization, and the source of the author shall be indicated. Otherwise, its legal responsibility will be investigated according to law.
about Us
Official Website: https://dodoex.io/
GitHub: https://github.com/DODOEX
Telegram: t.me/dodoex_official
Discord: https://discord.gg/tyKReUK
Twitter: https://twitter.com/DodoResearch
Mirror:https://mirror.xyz/0 x 70562 F 91075 eea 0 f 87728733 b 4 bbe 00 F 7 e 779788
"DODO Research Institute" led by the dean "Dr.DODO" led a group of DODO researchers to dive into the Web 3.0 world, doing reliable and in-depth research, aiming at decoding the encrypted world, outputting clear opinions, and discovering the future value of the encrypted world. "DODO" is a decentralized trading platform driven by the Proactive Market Maker (PMM) algorithm, which aims to provide efficient on-chain liquidity for Web 3 assets, allowing everyone to issue and trade easily.:https://twitter.com/DodoResearch/status/1587274217082404864


