Industry information
According to newsbtc news, on Friday, 59 common stocks on the New York Stock Exchange hit a new high, and the traditional market seems to be making a comeback. Previously, from February to June, Bitcoin maintained a relatively close linkage with the stock market. However, as the stock market recovers, the Skew chart shows that this correlation is starting to show some signs of breaking down. The analysis pointed out that if this trend continues, Bitcoin may not be able to catch up with the upside tailwind brought by the rebound in the stock market.
Market review
The market basically remained oscillating at the 9050 line. Because the upper five-day moving average was difficult to stabilize, the market fell back slightly, but the correction range was still within the controllable range; while the lower track of the Bollinger Bands began to expand outwards, if the later market again When the pressure falls back and the market's short sentiment becomes strong, the 9,000 mark below will be in jeopardy. In July, it is believed that there is a long-term trend to go below it.
market analysis
market analysis
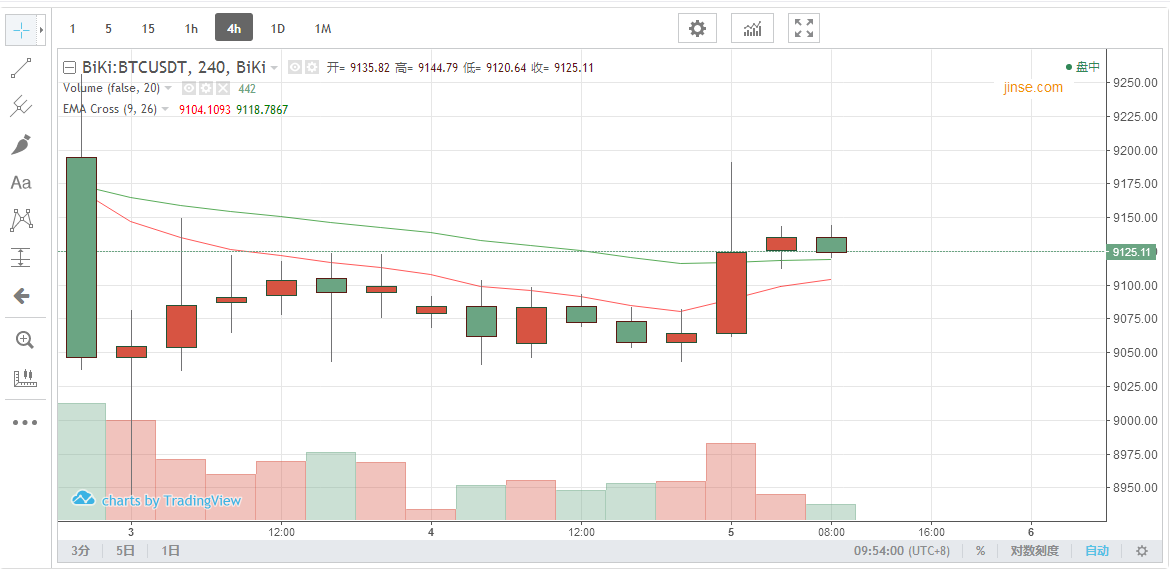
In the four-hour level chart, the Bollinger Bands opened. Judging from the recent running trajectories of the three consecutive K-lines, the market as a whole is on a downward path, with varying degrees of slippage at both high and low levels; the five-day and ten-day moving averages Downward, the currency price fluctuates around it, but it has not stabilized. If it can stabilize in the later stage, it will continue to move closer to the 30-day moving average and the 60-day moving average; Prone to profit-taking phenomenon.