






CEX Risk Assessment Guide: Three Key Indicators for Predicting Crisis


Original author: CryptoVizArt, Glassnode
Translated by: Nanzhi
Key Points
Exchanges are still the core of the digital asset industry, and the majority of transactions occur on them;
Based on entity-adjusted data, our assessment shows that 54% of BTC activity is related to exchange deposits or withdrawals;
Learning from the lesson of FTX's collapse, we introduce three indicators to assess abnormal exchange activity: internal transfer rate, exchange reliance rate, and whale withdrawal rate;
Using this exchange risk framework, we assess Binance, Coinbase, Huobi, and FTX to provide an overview of on-chain behavior on different exchanges.
Exchange Balances
CEX holdings reached a peak of 3.203 million bitcoins in March 2020 and have since steadily declined. This week (end of August), the total exchange balance reached its lowest level in five years, at 2.256 million bitcoins. These exchange balances consider wallets directly related to exchanges and do not include custodians or ETF tools specifically (such as GBTC or MicroStrategy, etc.).
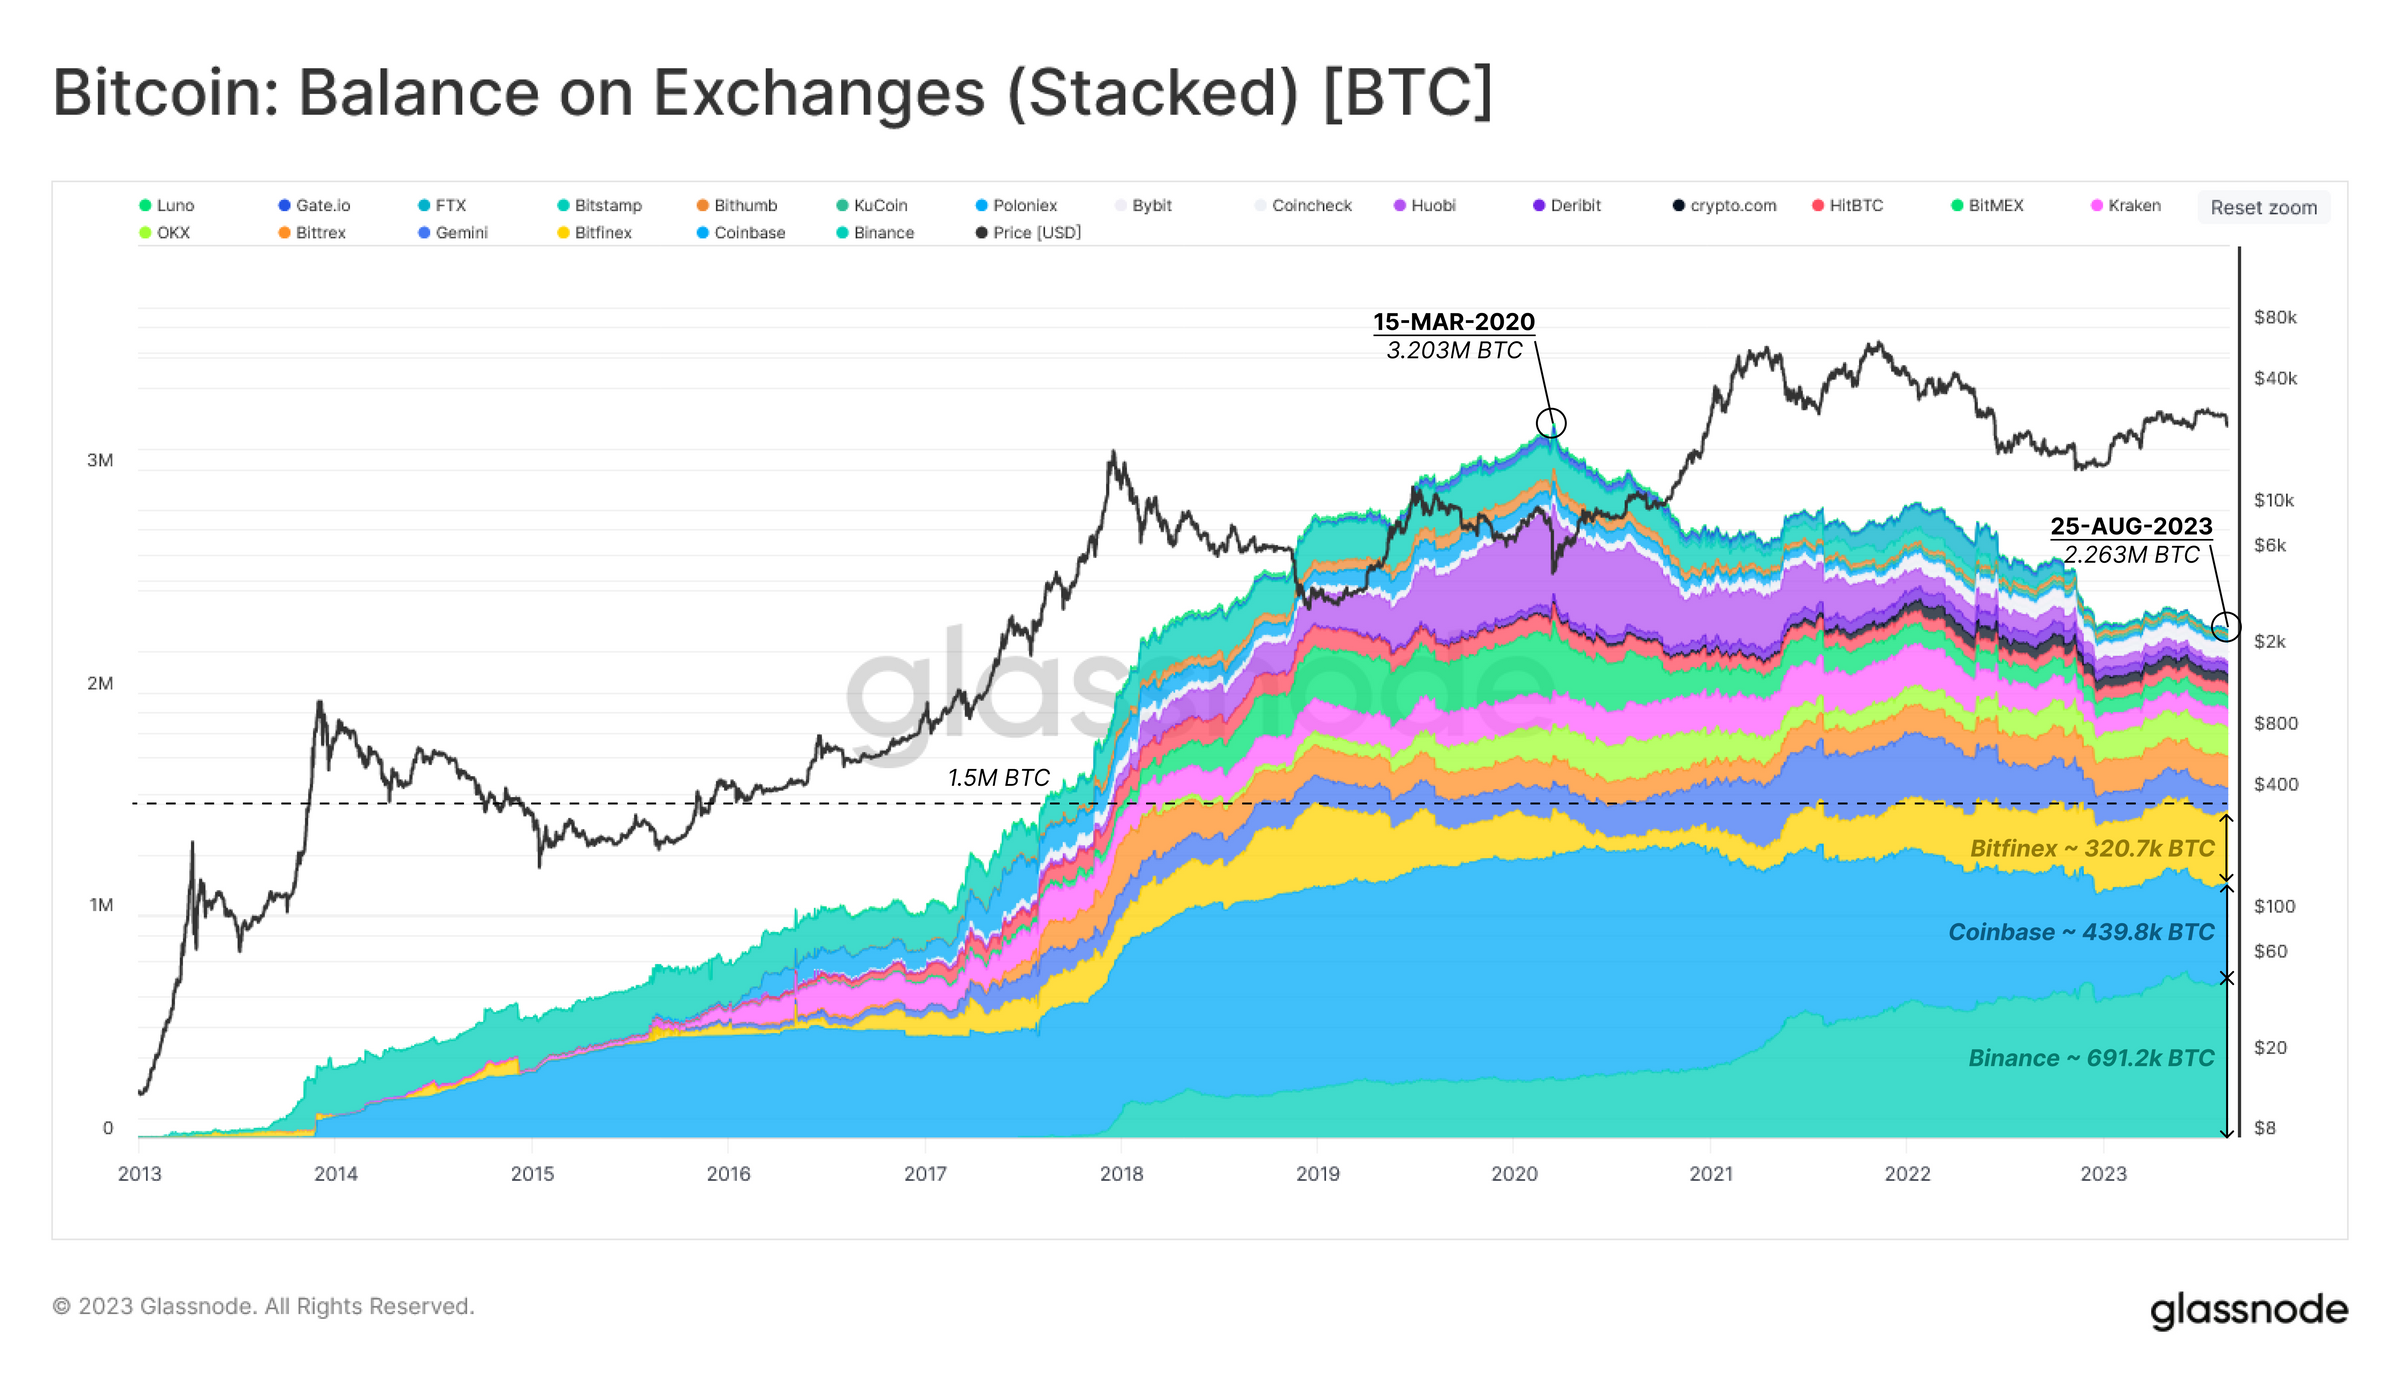
One notable feature of this chart is that the top three exchanges dominate, holding approximately 1.5 million bitcoins since early 2019. The current holdings of these exchanges are estimated as follows:
- Binance: 691,200 bitcoins
- Coinbase: 439,800 bitcoins
- Bitfinex: 320,700 bitcoins
Excluding the 145.7 million bitcoins considered lost, exchange reserves account for 11.8% of the circulating supply, totaling 2.31 million bitcoins. The daily on-chain transfer volume is 122,000 bitcoins (0.6%).
Out of this 122,000 bitcoins in daily trading volume, deposits and withdrawals from exchanges account for over 54% (approximately 67,300 bitcoins per day, usually split evenly between deposits and withdrawals). Therefore, observations of funds flowing into and out of exchanges often contain valuable information.
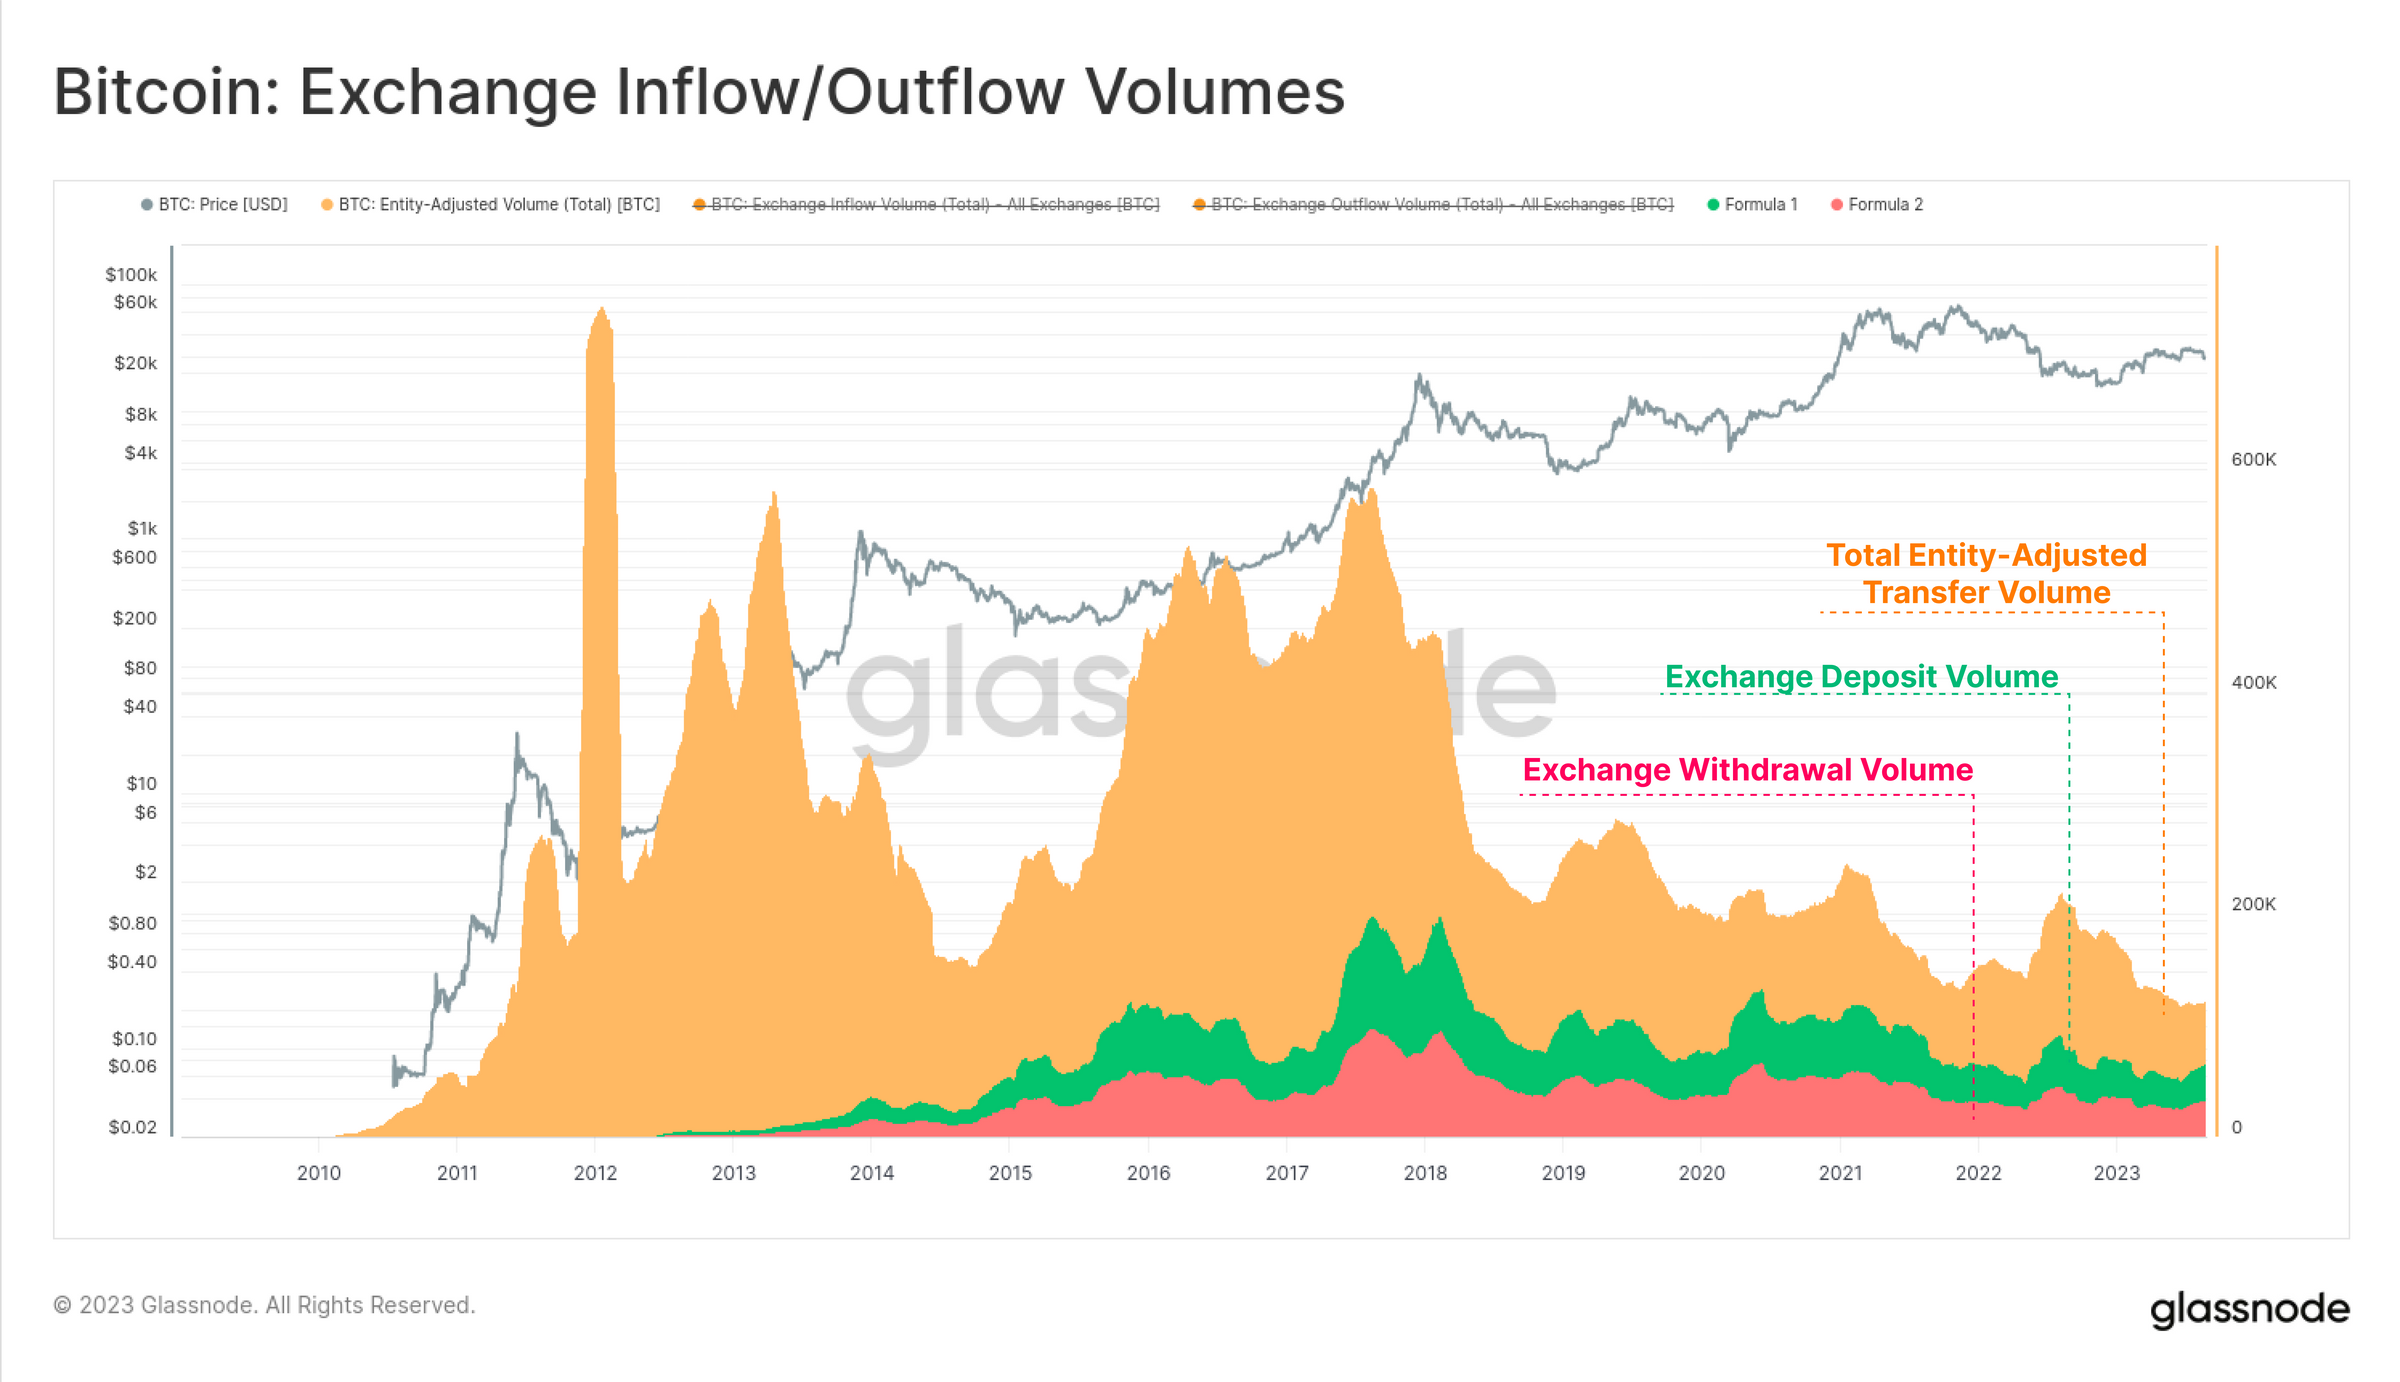
Fund Flow Analysis
After understanding the scale of the flow, we can delve deeper into the flow of funds between entities and exchanges. In the following graph, we combine the inflow and outflow of exchanges to form a single indicator, the exchange fund flow (90-day average).
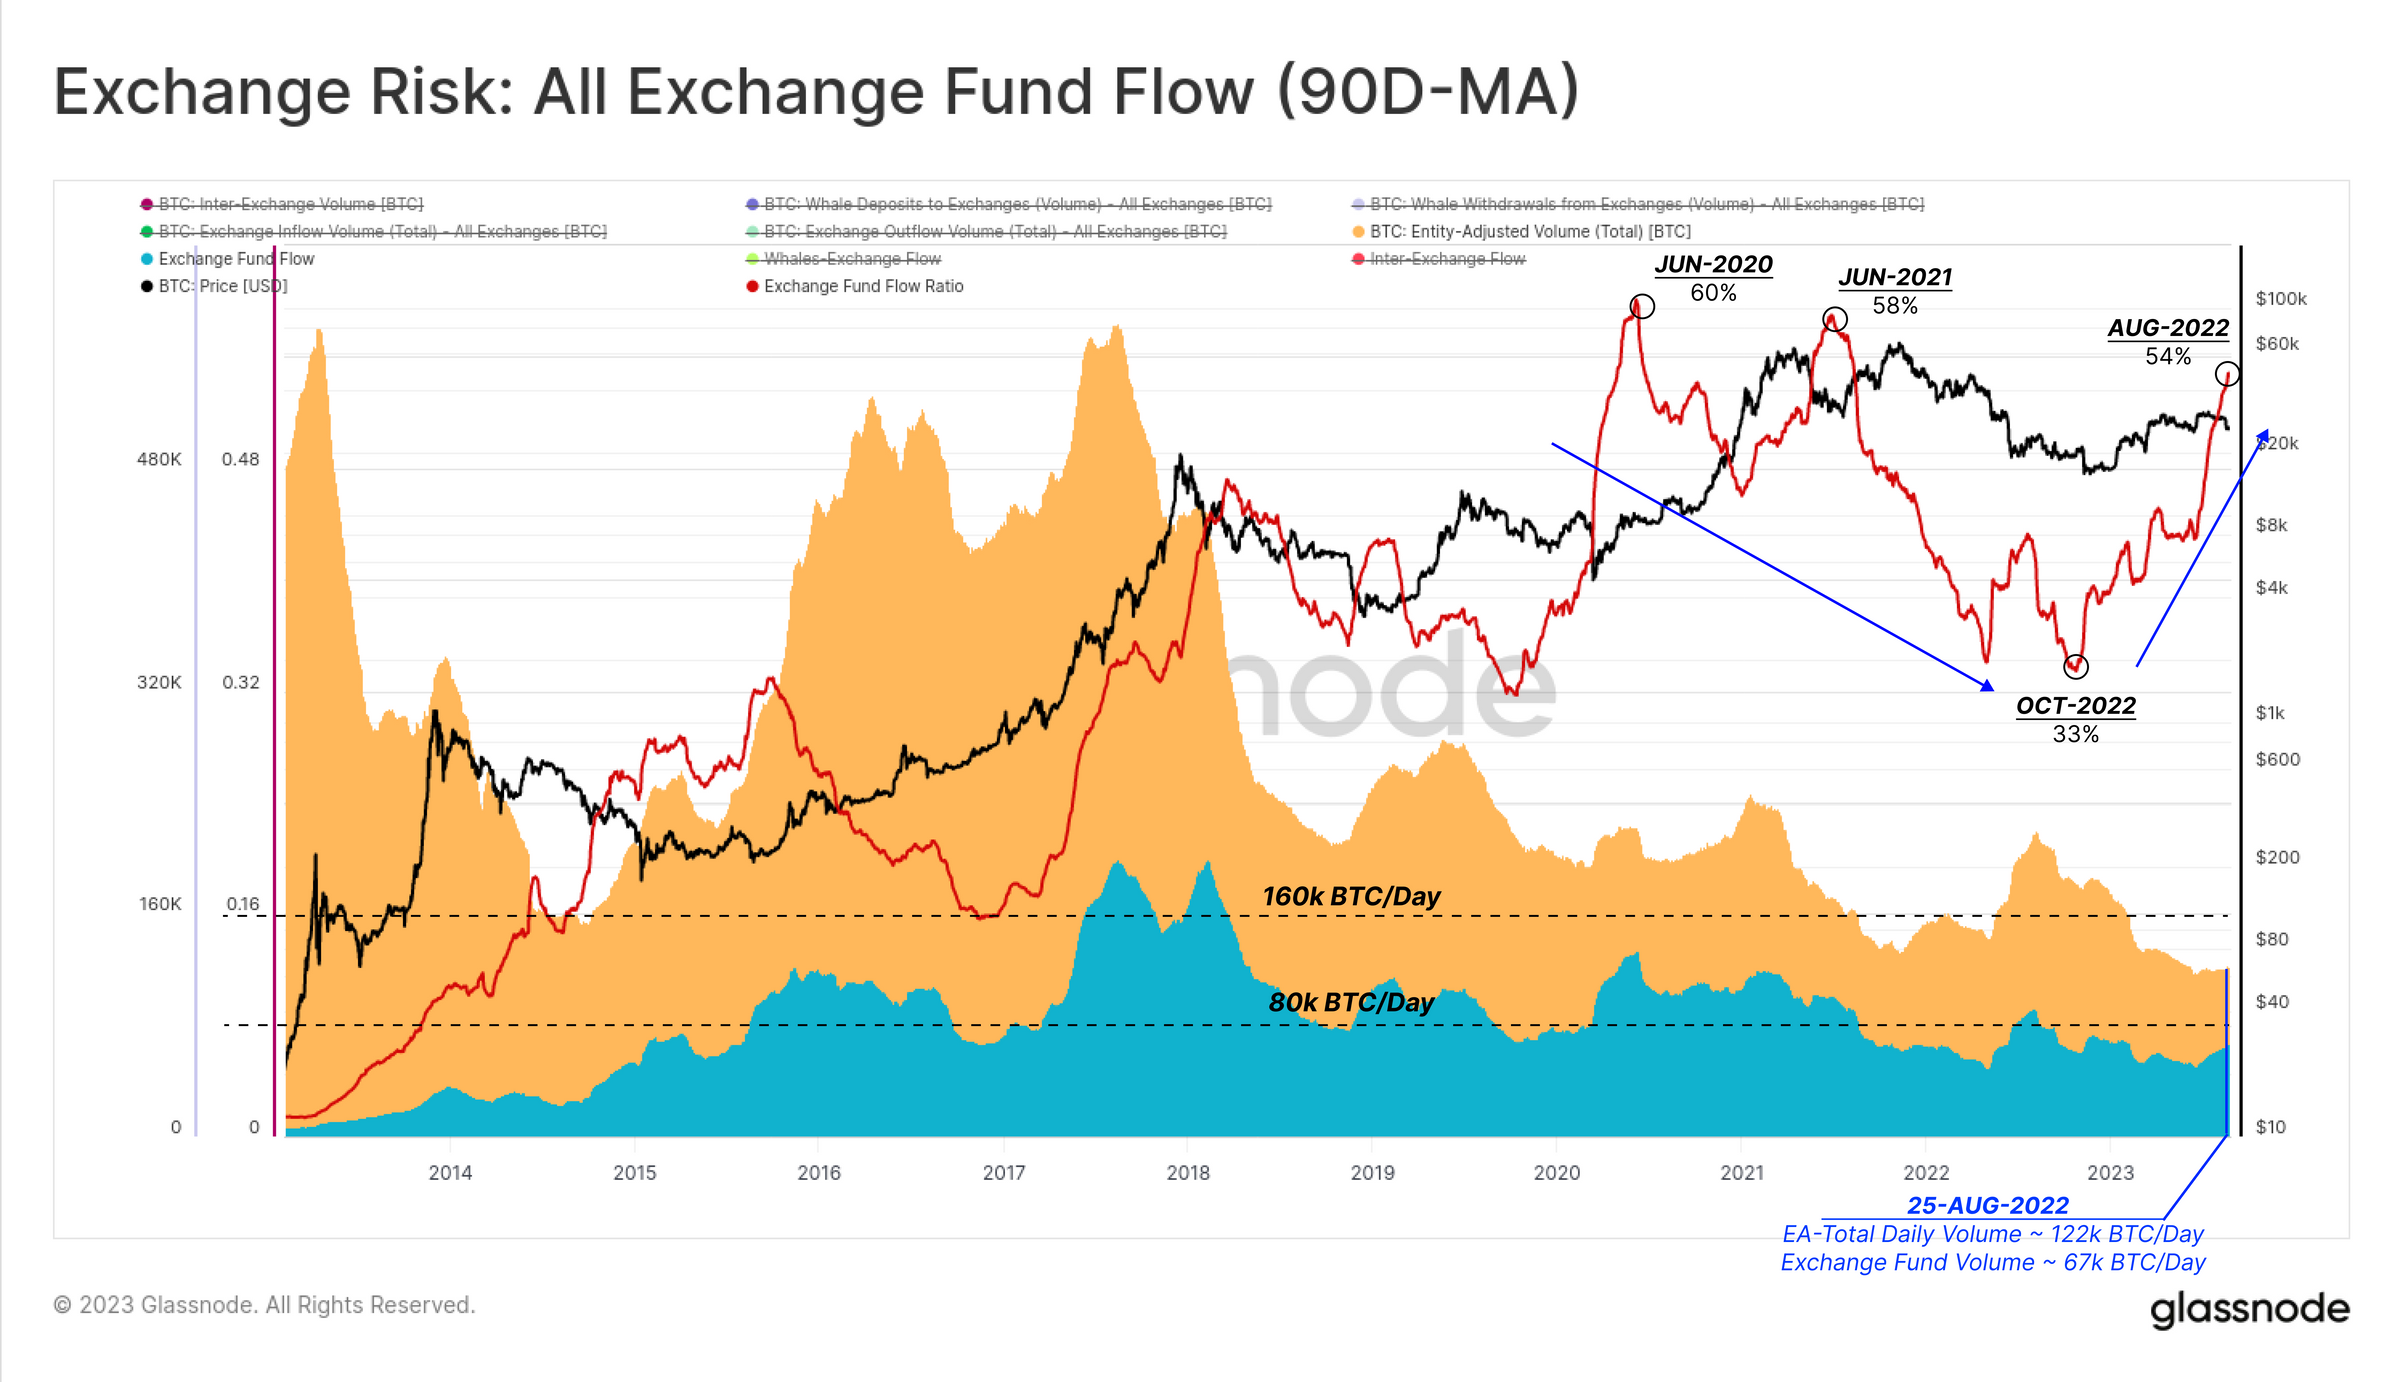
Here, we can see that the exchange fund flow accounts for 54% of the total and is in a macro upward trend. The exchange dominance reached 58% in June 2021, then sharply decreased as global interest rates accelerated, liquidity tightened, and the subsequent bear market ensued. In October 2022, with the recovery of global liquidity and markets from the impact of the FTX event, the dominance once again rose.
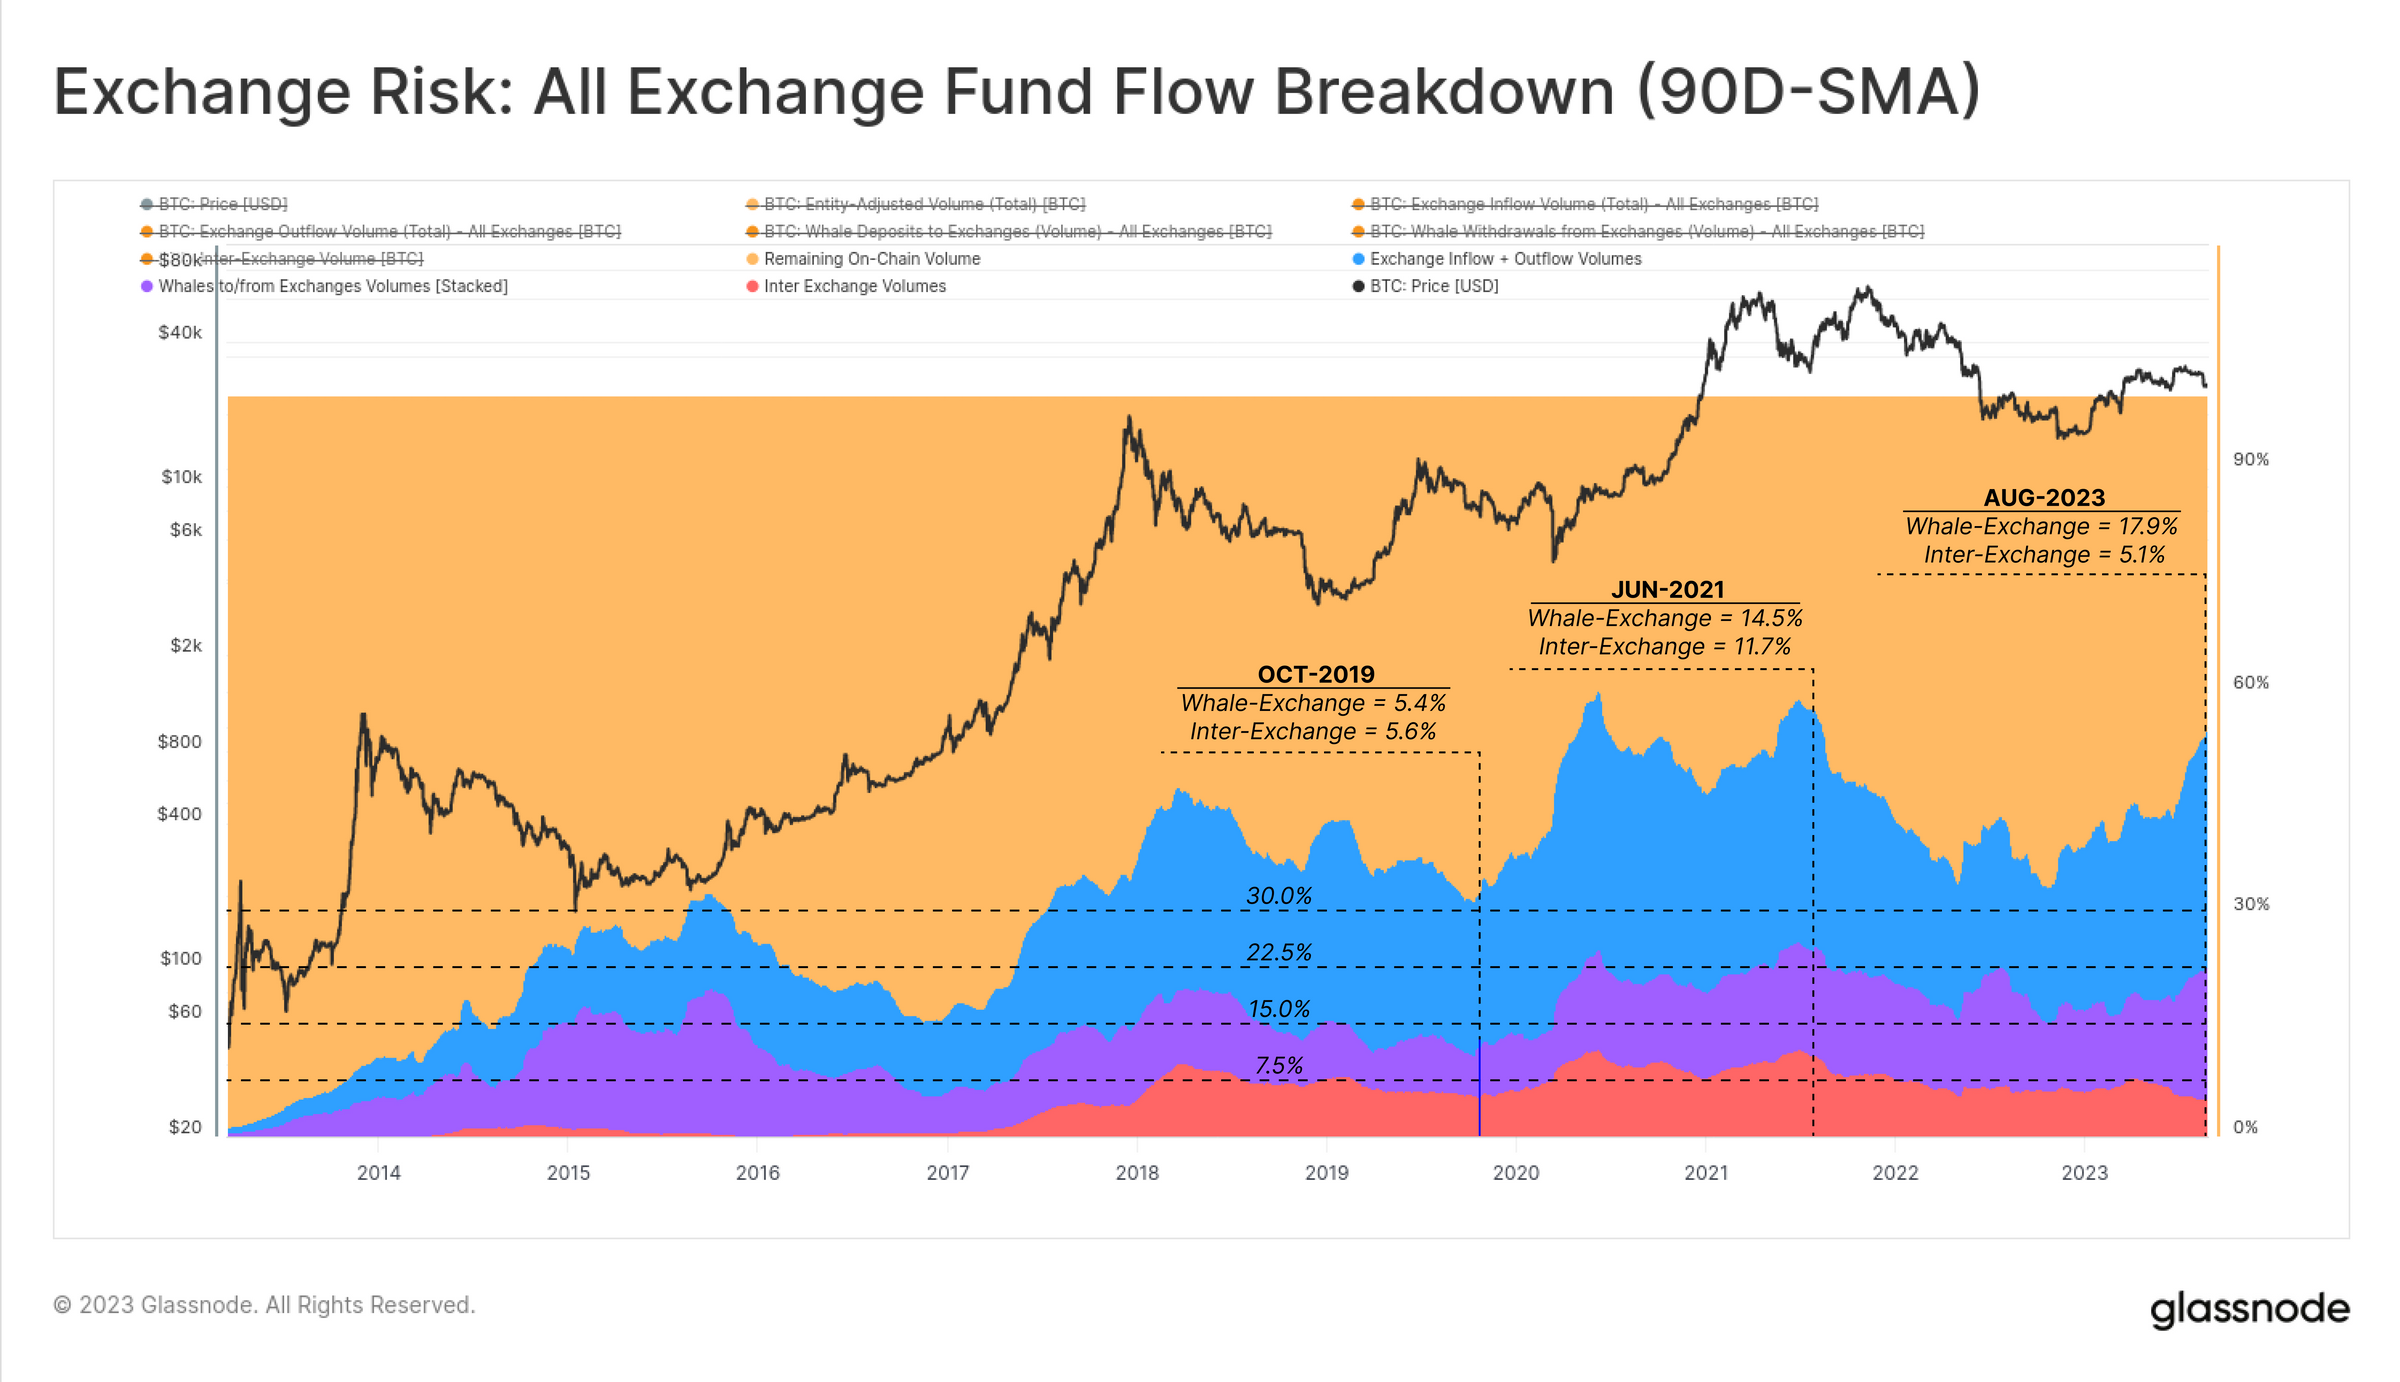
We can decompose the dominant position of on-chain transaction flow into four parts:
On-chain transaction volume unrelated to exchanges (entity adjustment).
All flow related to exchanges (inflow and outflow).
Whale-to-exchange fund flow: Transfer of funds between whales (1,000 BTC+) and exchanges.
Exchange-to-exchange flow: Transfer of funds from one exchange to another.
The exchange-to-exchange flow has been relatively stable, accounting for approximately 7.5% of on-chain transaction volume, reaching a peak of 11.7% in June 2021. Meanwhile, the whale-to-exchange flow has recently reached a new all-time high of 17.9%.
As we can see, flow related to exchanges (54%) is currently approaching historical highs.
Exchange Risk Analysis Framework
The first part of the report establishes the perspective on the dominant position of exchanges in the Bitcoin ecosystem. However, exchanges can also become a source of counterparty risk, as seen in the FTX incident.
In the following sections, we aim to establish a framework for analyzing the relevant risks of individual exchanges. In this section, we will use the FTX dataset as a reference point for future high-risk scenarios. Considering Coinbase's dominant position and recent market commentary on Binance and Huobi, we will provide data related to these exchanges for comparison.
We will use three indicators to construct this framework:
Internal transfer rate - Ratio of internal transfers to total reserves over a period of time.
Exchange dependency ratio - Level of flow between exchanges (transfers between exchanges).
Whale withdrawal ratio - a measure of the rate at which large entities withdraw funds.
Internal Transfer Rate
The first indicator is the ratio of the amount transferred between internal wallets of the exchange to the total reserve balance of the exchange. In order to provide comparable indicators across all exchanges and assets, the output value ranges from 0 to 1.

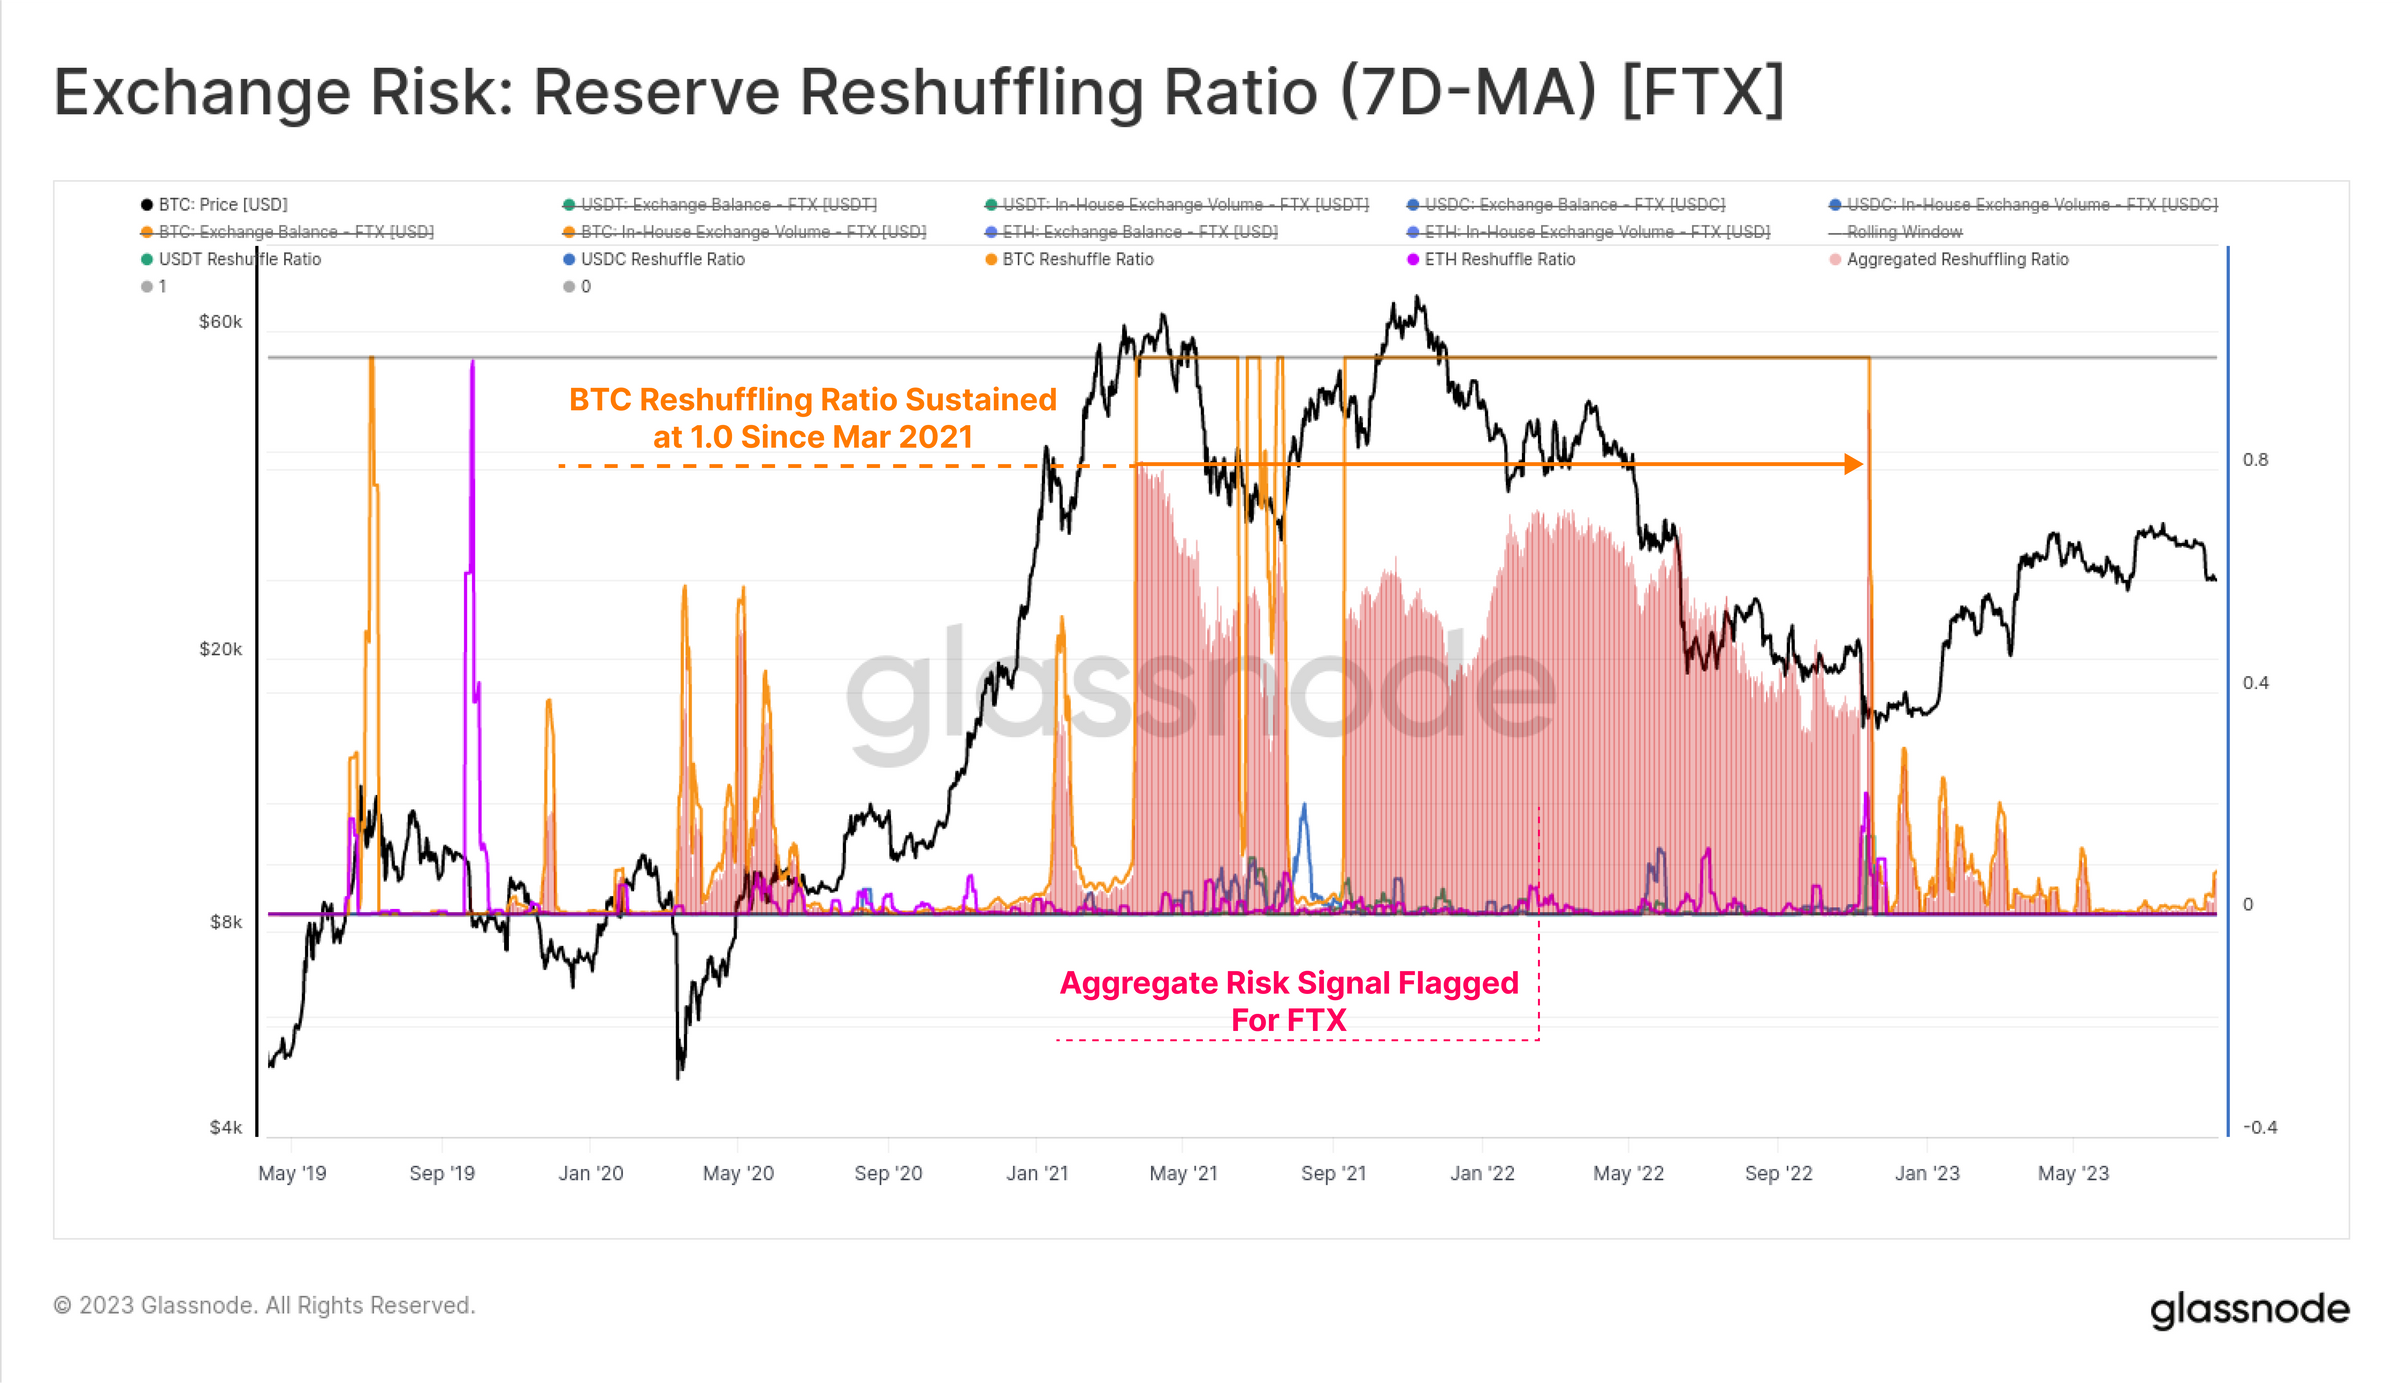
The core idea is to identify situations where internal transfers on the exchange exceed 100% within 7 days. If this situation persists over a long period of time and across multiple asset types, it may be a warning sign of improper fund management.
For FTX, we can see that their internal transfer rate for Bitcoin remained at 1.0 from March 2021 until November 2022 when it collapsed. We also show a "comprehensive risk" score taking into account the four largest assets: BTC, ETH, USDC, and USDT.
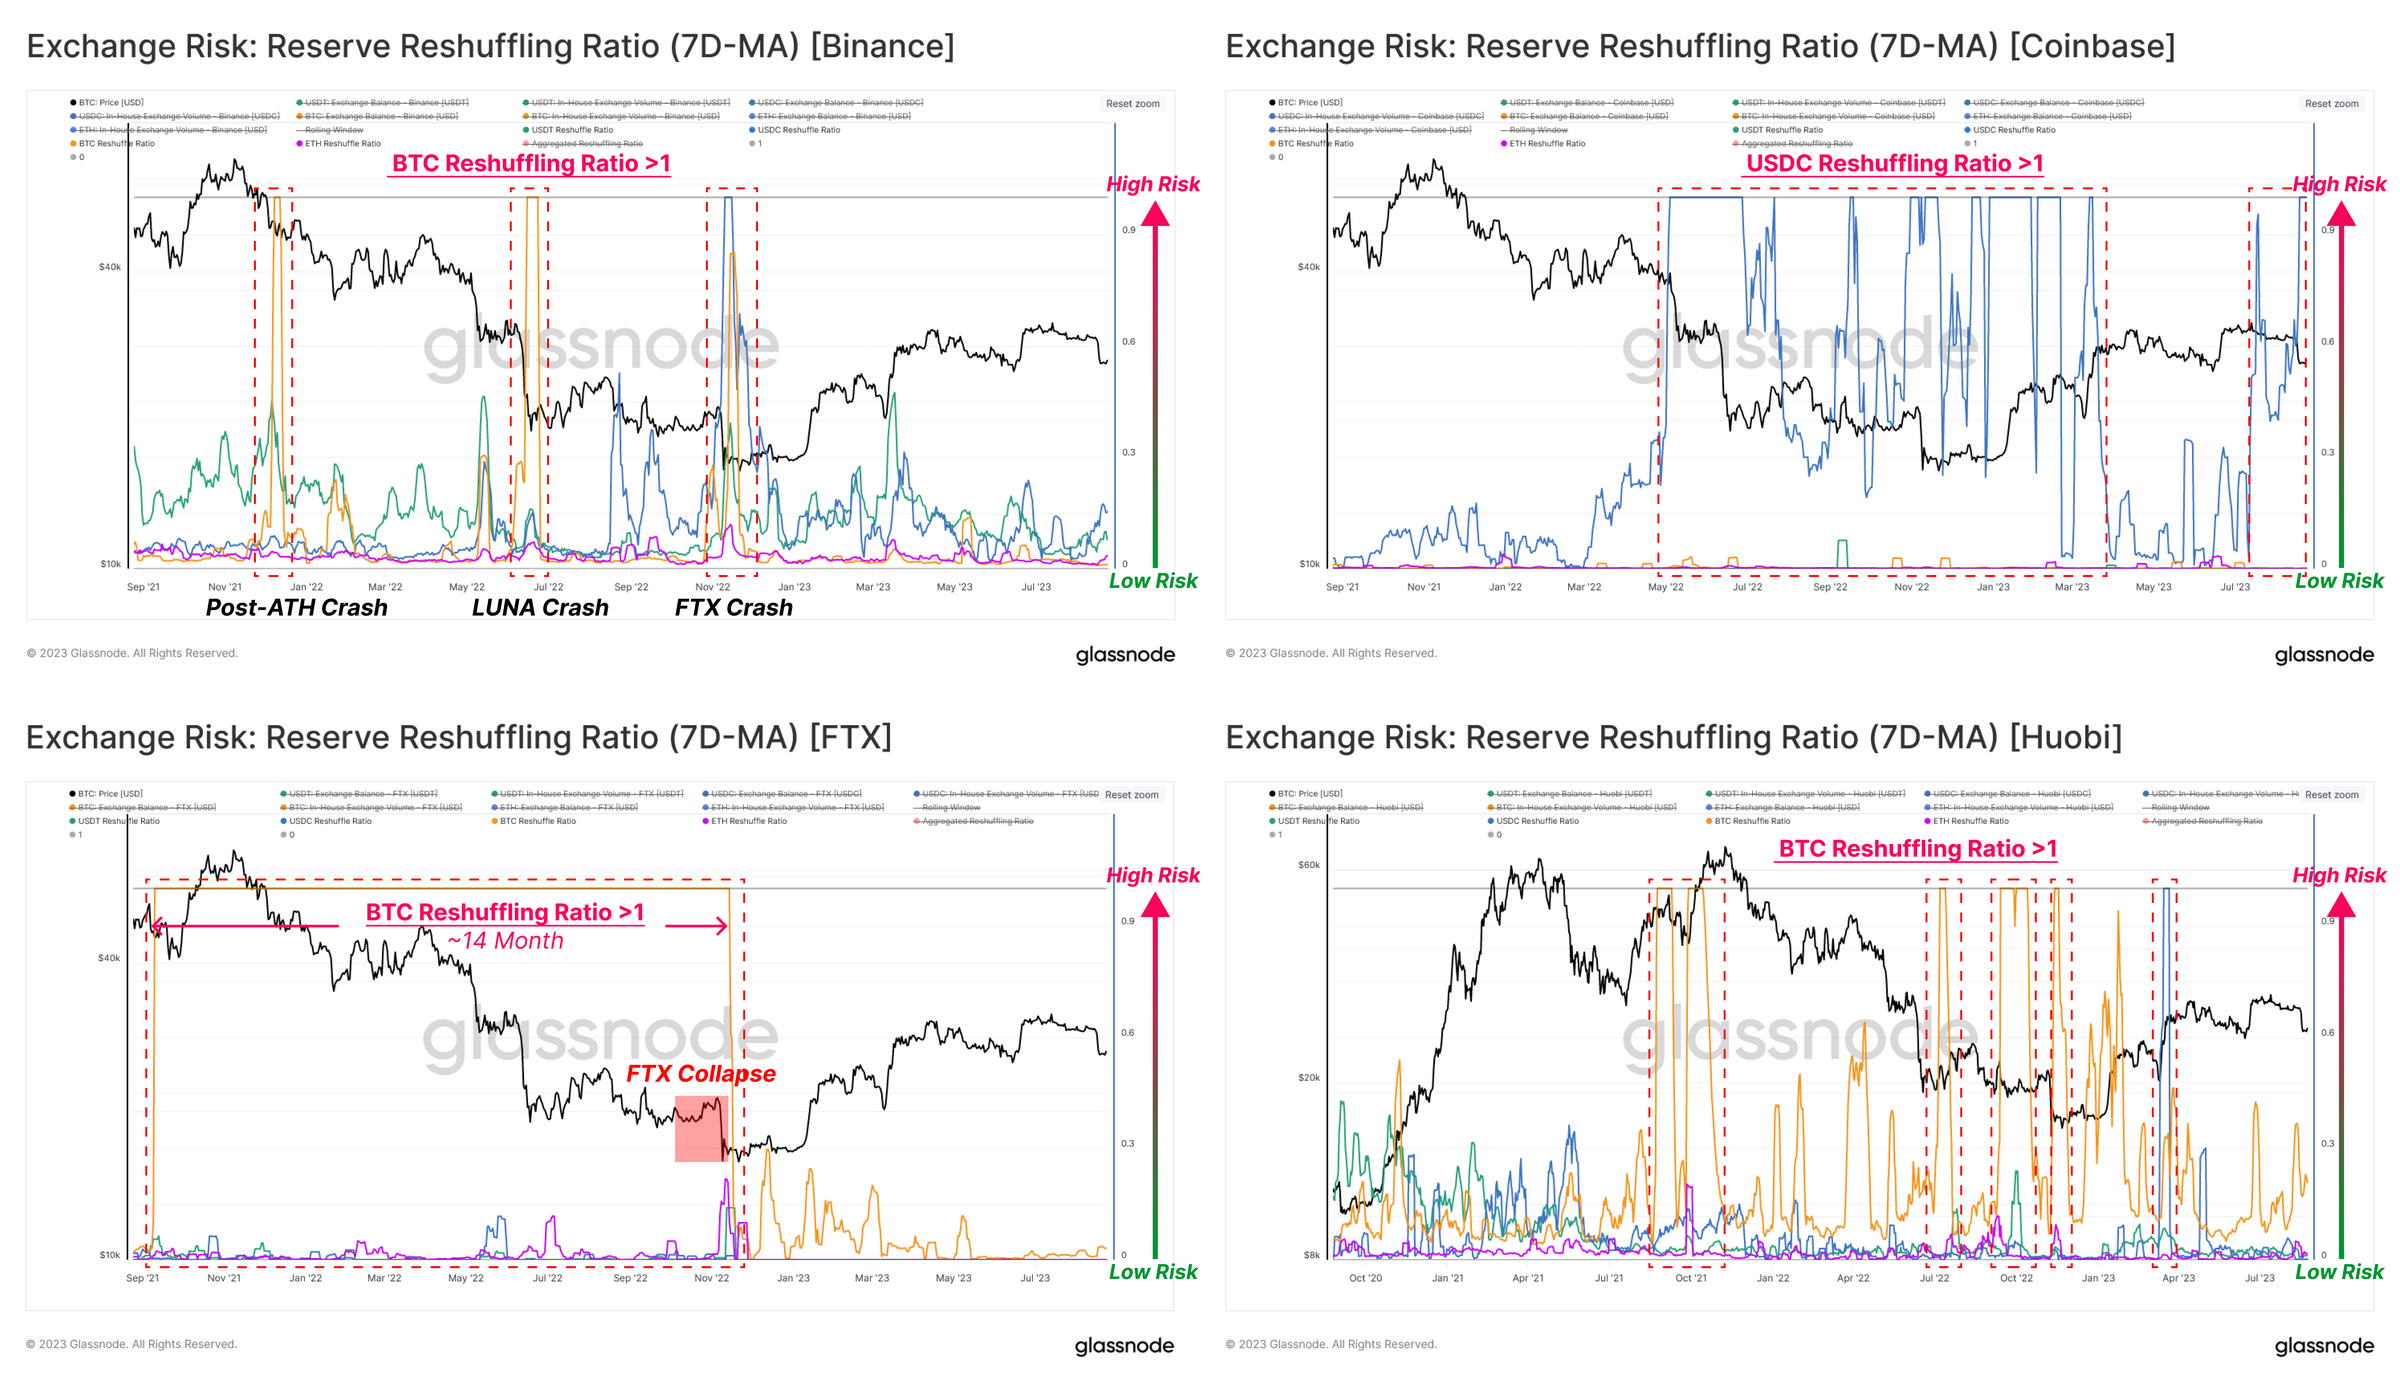
When compared to three other exchanges, some exchange-specific subtle differences can be observed:
Binance (top left): During periods of market volatility, sudden peaks in the internal transfer rate occur across all assets, followed by a rapid decrease. This seems to be a reaction of the market and is not persistent, likely a result of new deposit and withdrawal processing.
Coinbase (top right): Apart from USDC which remains at 1.0 for a long time, there are very few internal transfer events. This is likely due to Coinbase's collaboration with issuer Circle and its significant presence as a major venue for USDC flows.
FTX (bottom left): The internal transfer rate of Bitcoin entered the high-risk range within the 14 months before the exchange collapsed. In retrospect, this is likely the result of Alameda misappropriating client funds.
Huobi (bottom right): This exchange experienced volatility-related activities similar to Binance.
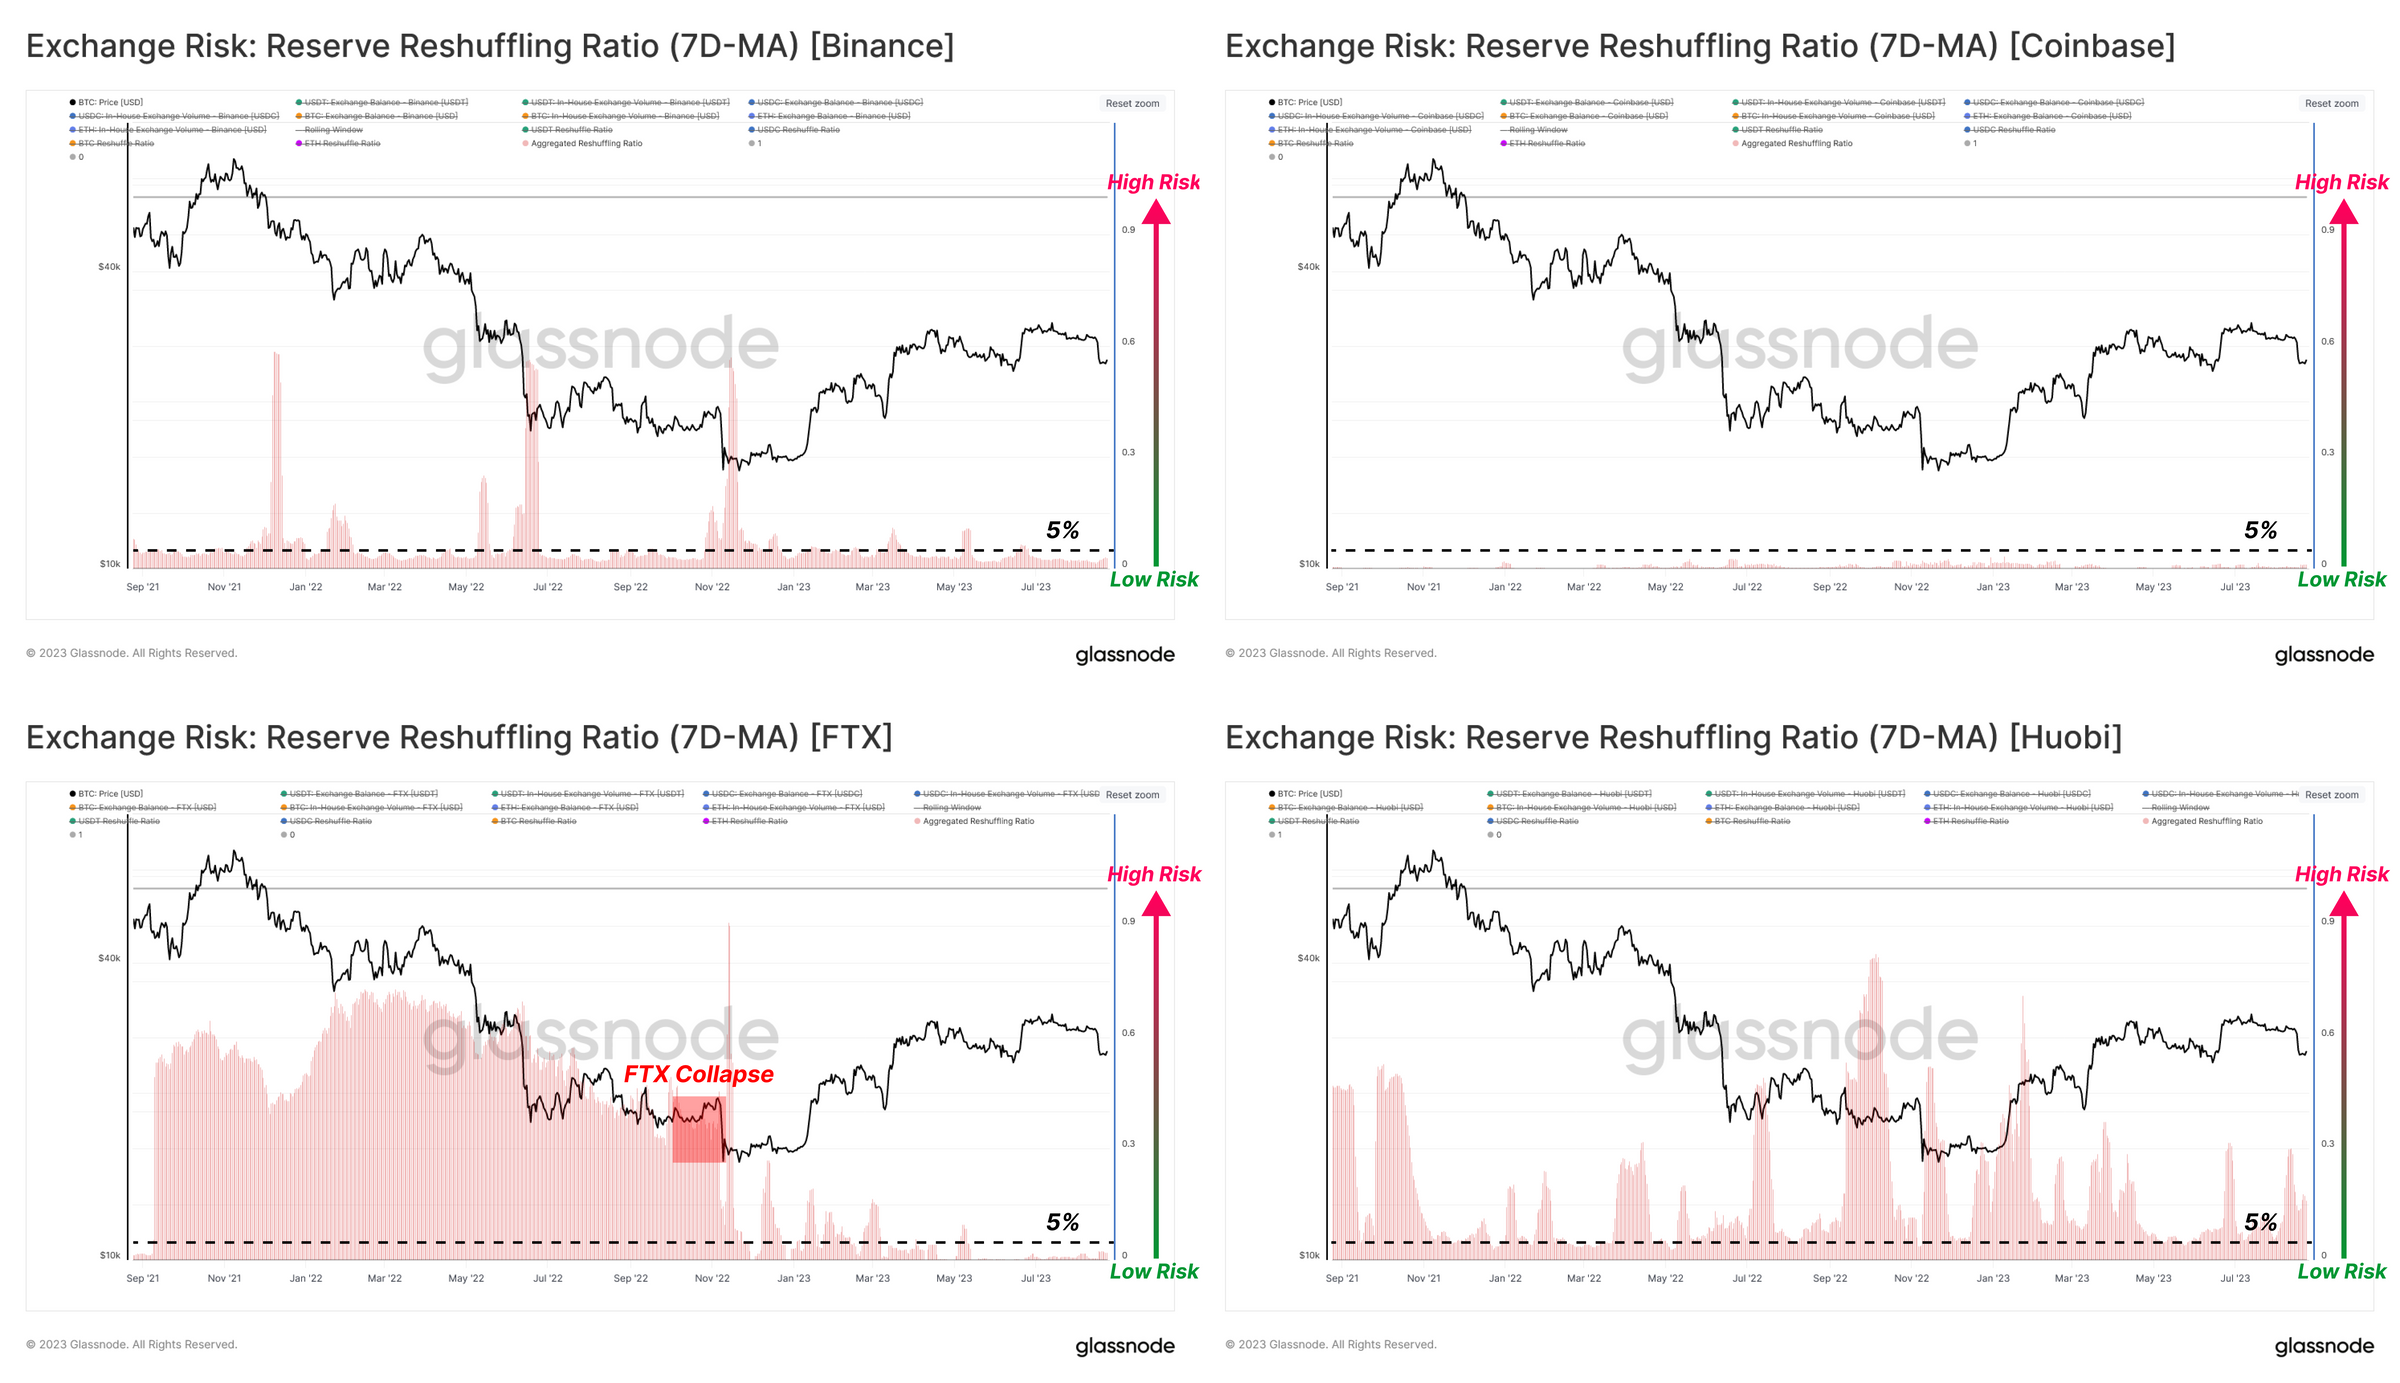
The chart below compares the internal transfer rates of these four exchanges across four assets. Here, we use a threshold of 5% to mark possible high-risk events. From this perspective, Binance and Coinbase have almost no internal "changes".
As we now know, FTX stands out for various reasons, all of which are bad.
Huobi is in the middle, with a similar internal transfer rate to Binance, but due to gradually decreasing exchange asset balances (denominator shrinking), the volatility is greater.
Exchange Dependency Ratio
Another indicator of potential exchange risk is the frequent transfer of exchange tokens from one exchange to another. This may indicate a high degree of liquidity dependence between these exchanges.

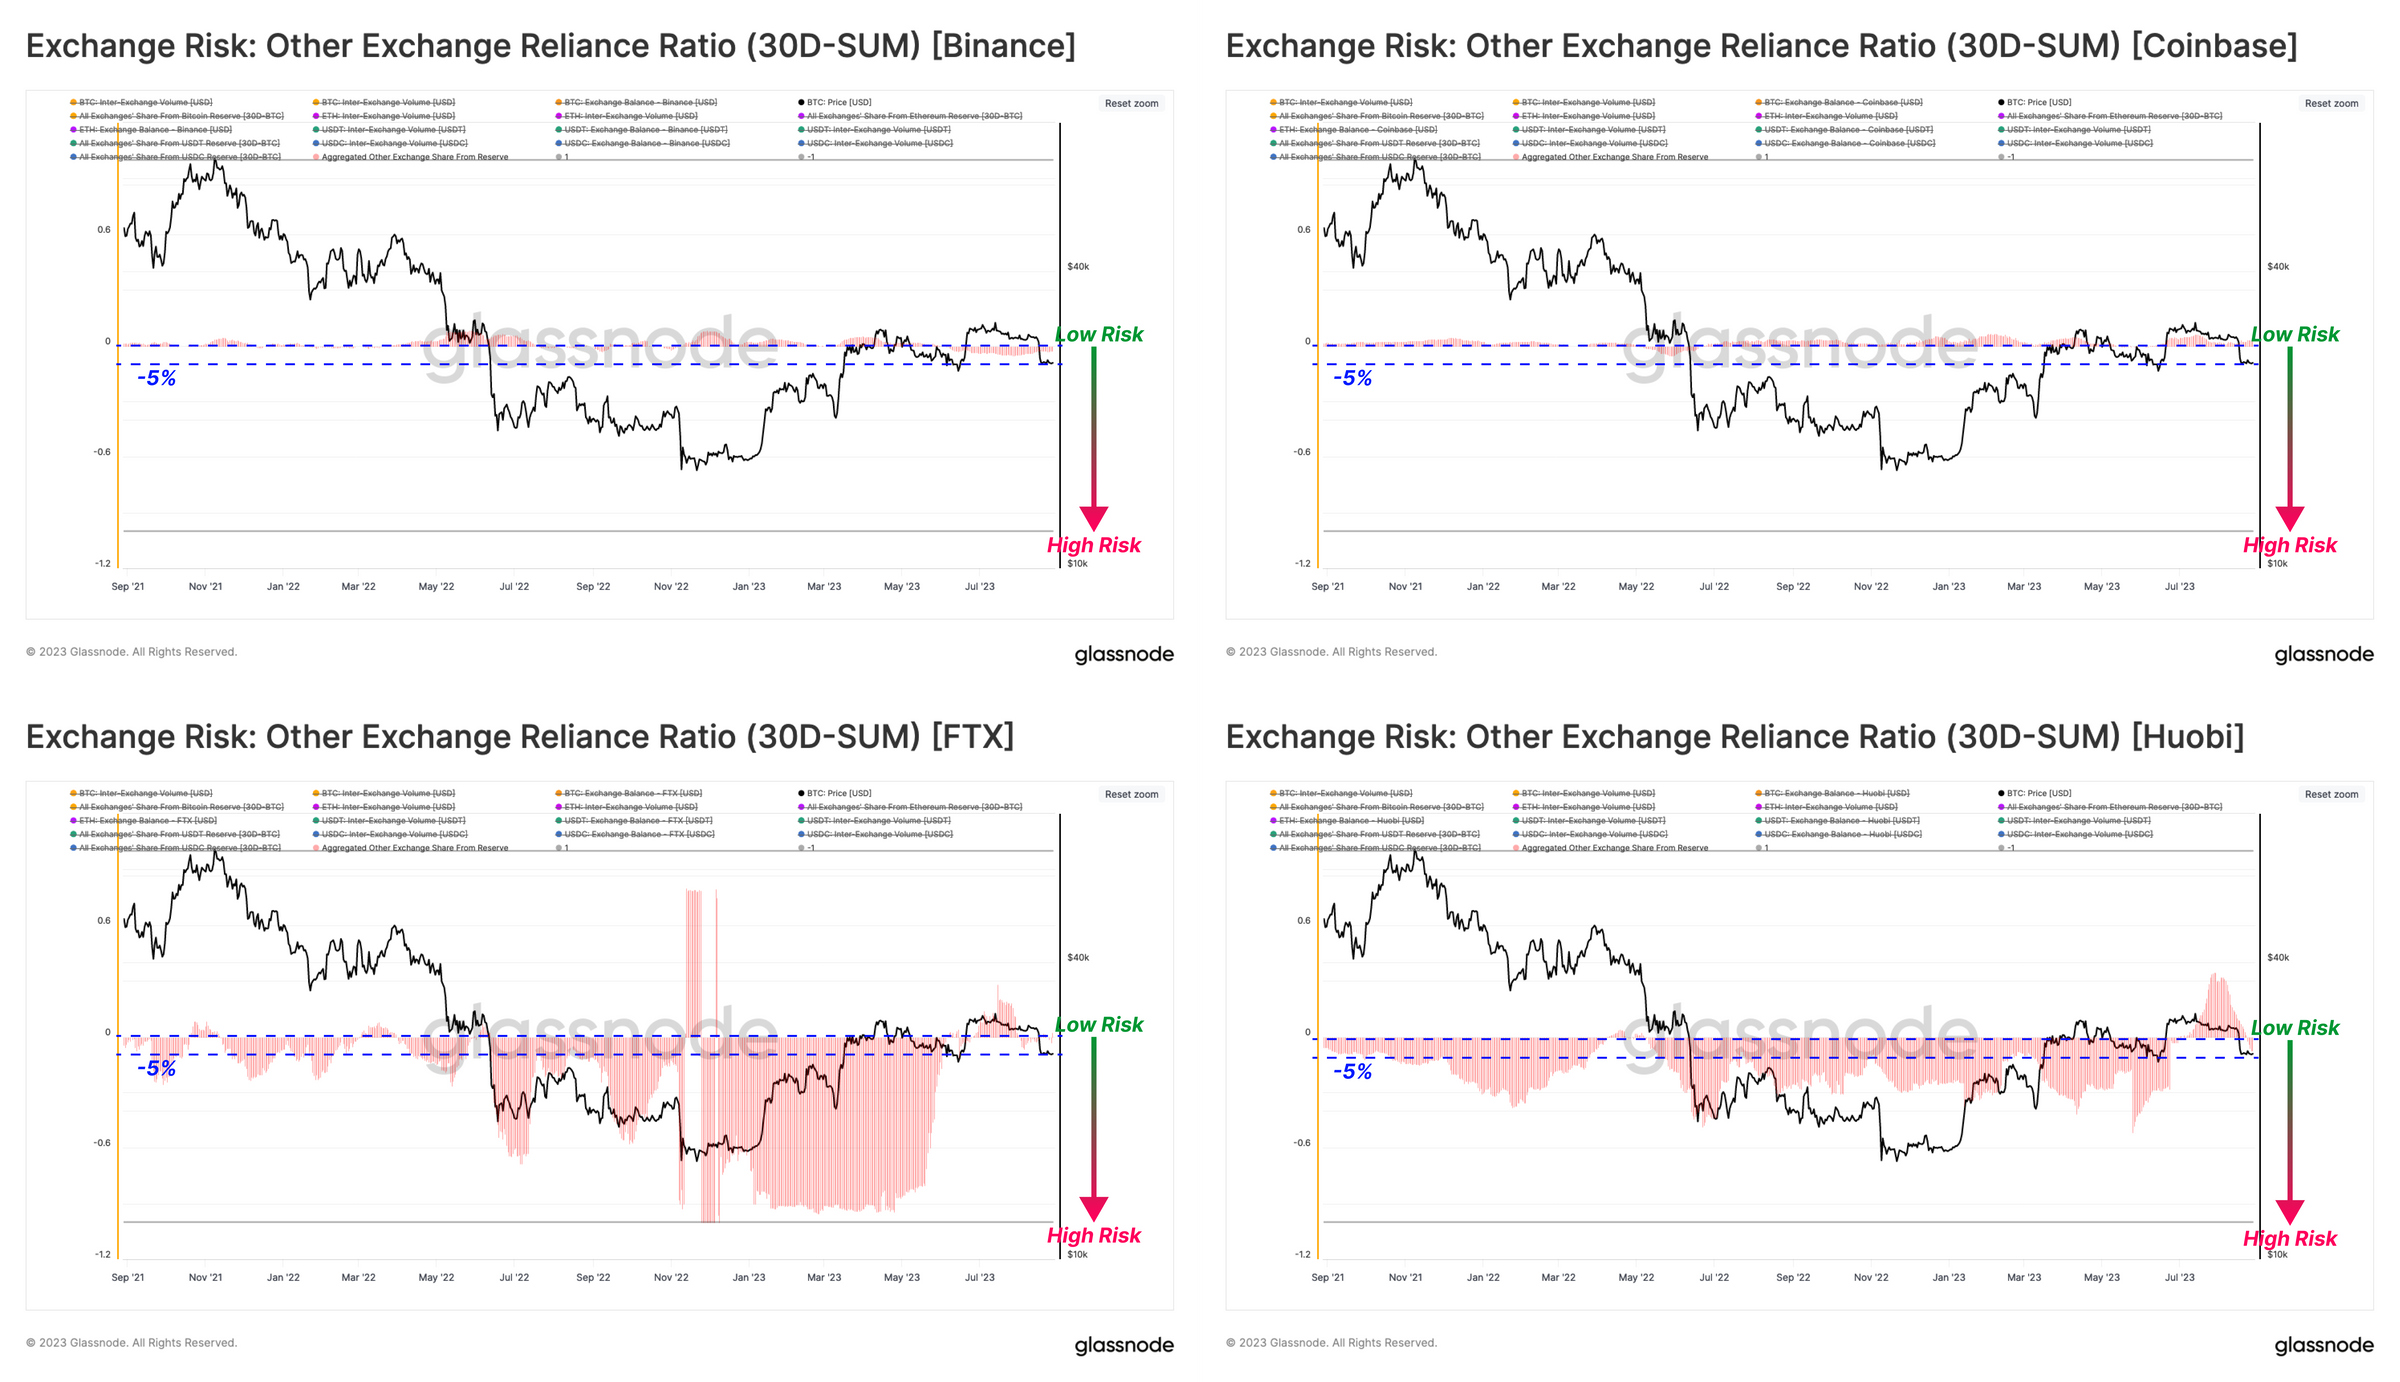
Similar to the previous section, we calculate this ratio for the top four assets in the market and limit the output values to the range of -1 to 1. We can also examine the direction of funds by whether the ratio is positive (net inflow) or negative (net outflow), as well as investigate the sources and destinations of the funds.
A significantly negative value in this indicator indicates that assets are rapidly flowing out of the exchange and towards another exchange, which may trigger an alert if this situation persists.
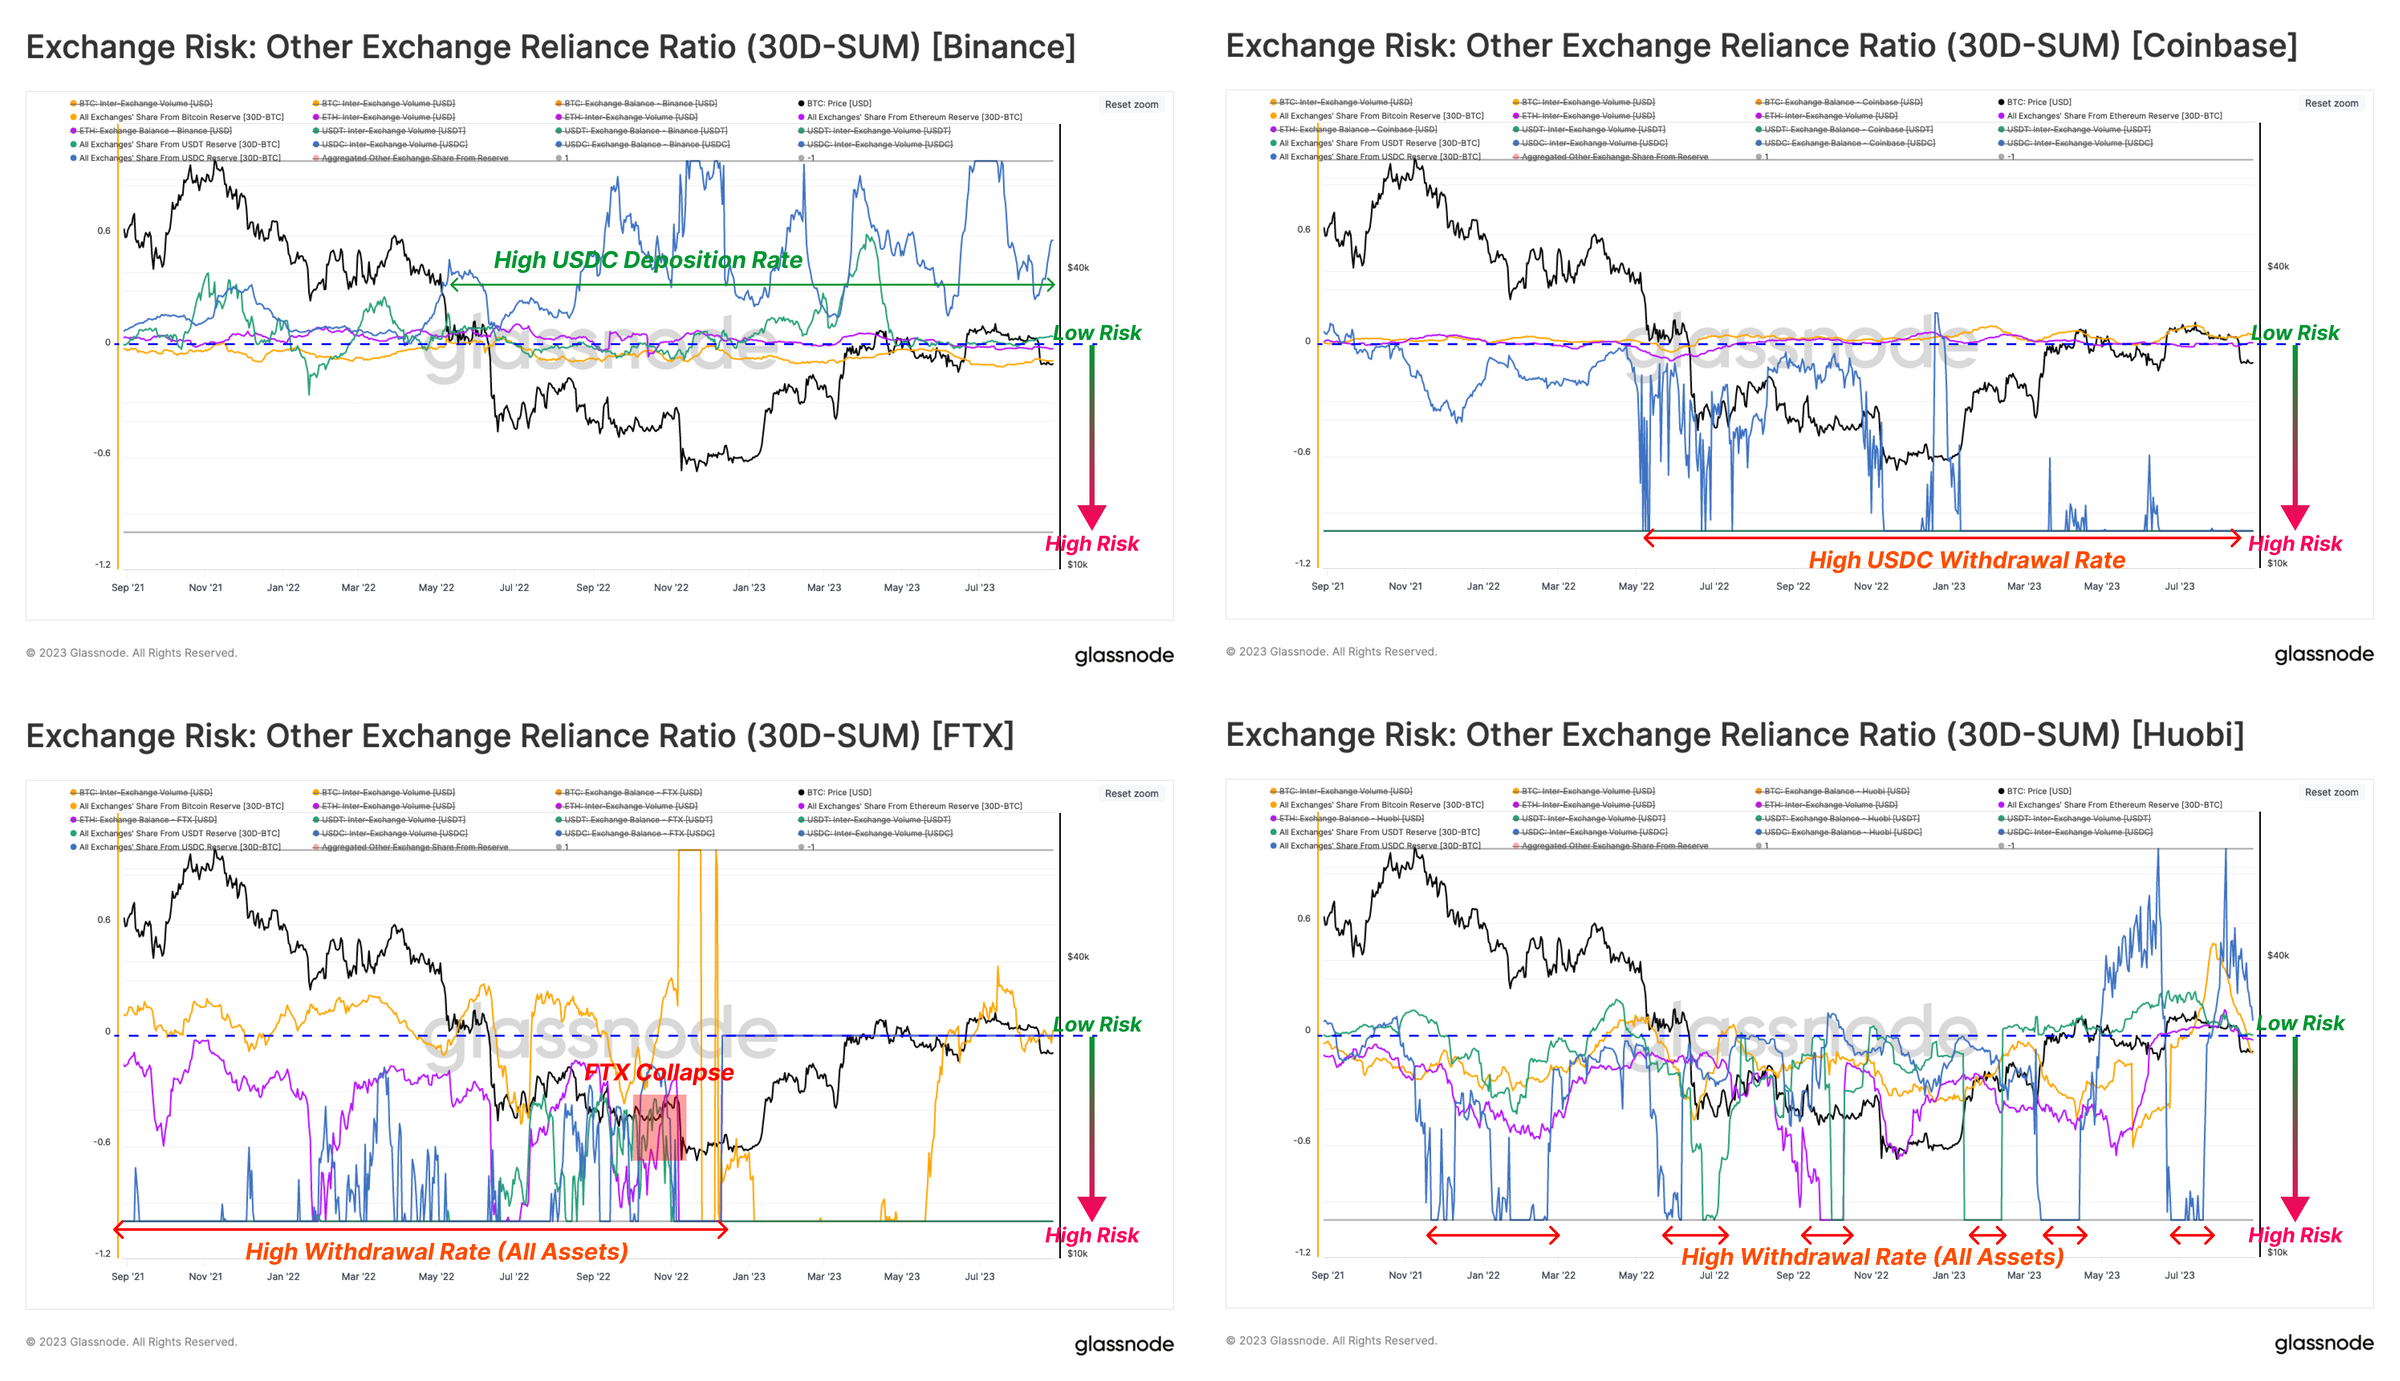
Reviewing the top four assets of the above-mentioned exchanges:
Binance (top-left): All assets have a neutral or close to zero dependency rate, indicating a small amount of funds flowing in or out from other exchanges compared to Binance balance. Since September 2022, there has been a high inflow rate of USDC, probably obtained from Coinbase.
Coinbase (top-right): Similar to Binance, all assets show a neutral dependency rate. However, since September 2022, there has been a high outflow rate of USDC. This suggests that a significant amount of USDC supply has migrated from Coinbase to Binance in the past 12 months.
FTX (bottom-left): The dependency rates for all four assets were significantly negative before the exchange crashed. This indicates that investors (including Alameda) were moving all major assets to accounts in other exchanges.
Huobi (bottom-right): Evaluating the risk indicator for Huobi, we can see that the dependency rates for all assets are significantly negative, indicating a net outflow from Huobi to other exchanges.
We once again show the comprehensive dependency rates, which depict Binance and Coinbase with very low dependency, at -5% or higher, indicating that their behavior is largely independent of other exchanges.
On the other hand, FTX and Huobi have negative comprehensive dependency rates, indicating that entities active on other exchanges have been consistently withdrawing funds from these entities.
Bitcoin Whale Withdrawal Rate
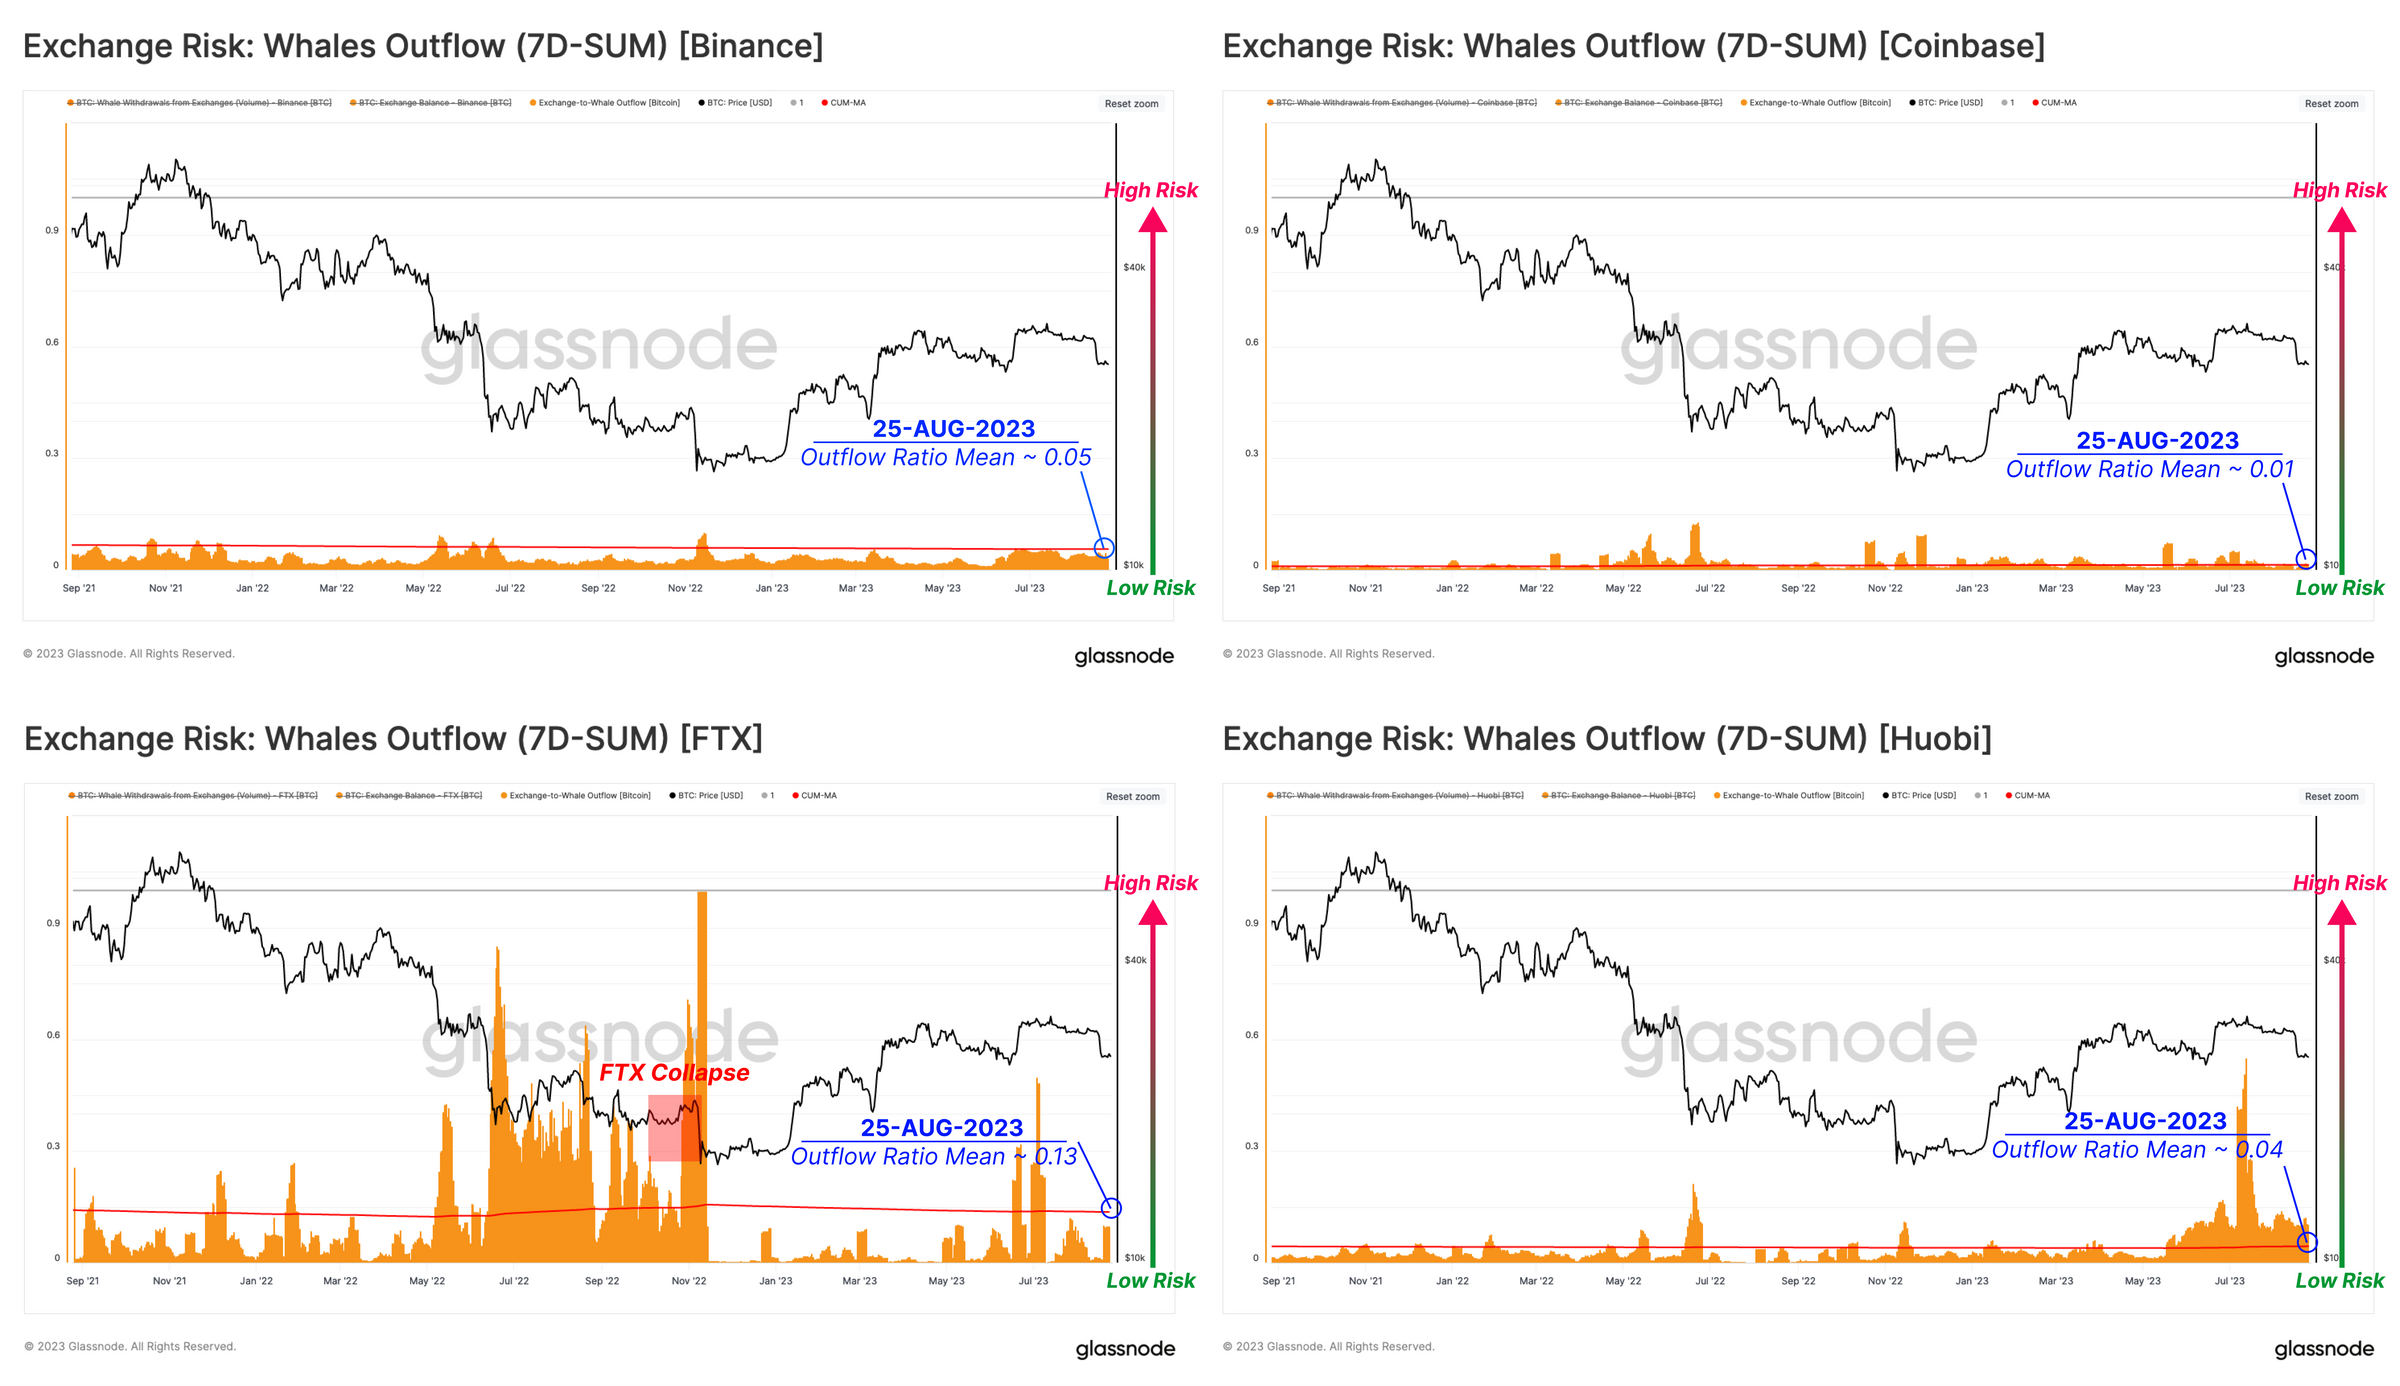
The final indicator monitors whether Bitcoin whales are accelerating their withdrawals. This parameter is the ratio between the total weekly whale outflow and the exchange's Bitcoin balance.

In addition to the whale withdrawal rate, we also display the historical average of this indicator as a long-term benchmark.
In the past two years, the whale withdrawal rates of Coinbase and Binance have been very low, with a long-term average below 5%;
For FTX, the surge in whale withdrawal rates began with the collapse of LUNA and 3AC, and remained at a high level until the exchange closed;
For Huobi, the risk is relatively low until June 2023. It is only in recent months that the whale withdrawal rate has continued to rise relative to Huobi BTC balance. This will to some extent drive a continuous decline in Huobi BTC balance, which has a reflexive effect.
Conclusion
FTX's failure serves as a reminder that counterparty risk still exists in CEX and custody institutions. With hindsight as a guide, we propose three indicators that offer simple insights into some potential risks within exchanges using our on-chain data and token clusters.
We find that Coinbase and Binance demonstrate similar safety with on-chain data based on internal transfer rates, exchange reliance rates, and whale withdrawal rates. Unfortunately, FTX serves as a notable risk indicator. For Huobi, the continued decline in balances of the four major assets BTC, ETH, USDT, and USDC will worsen these indicators, indicating the need for a certain degree of caution.





