


Bloomberg's long-form report: Why the bull market is not over yet?


Original title: Bloomberg Crypto Outlook – Discounted and Refreshed;
Author of the report: Mike McGlone | Senior Commodity Strategy Analyst at Bloomberg BI; Compilation and arrangement: Mary Liu (from Bitui).
Content overview
Bitcoin: $20,000 or $100,000?
America Wins the Digital Cold War
Crypto Top 3: Bitcoin, Ethereum, Tether
Bitcoin is dormant, continues to strengthen, and is more environmentally friendly
1. What's next for Bitcoin: $20,000 or $100,000?
1. What's next for Bitcoin: $20,000 or $100,000?
The trend is upward.
image description
Bitcoin "Nap Time": $30,000-$40,000
Bitcoin "Nap Time": $30,000-$40,000
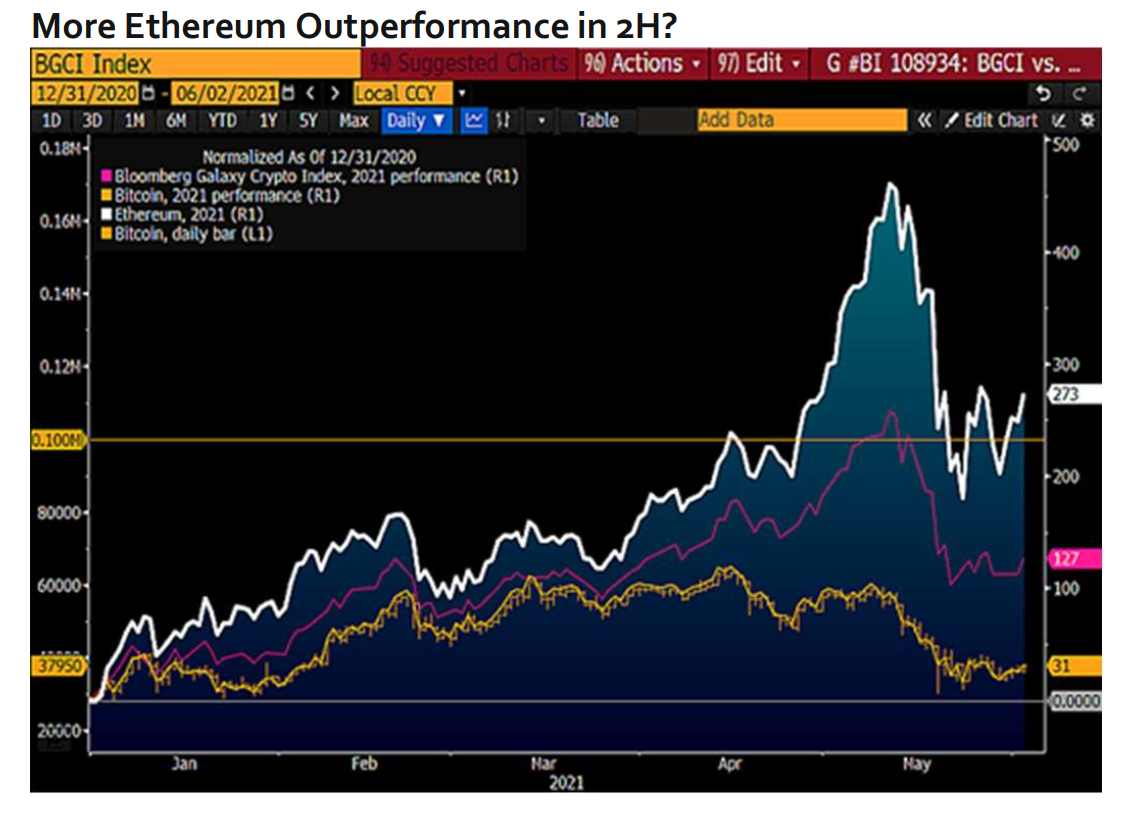
As we can see, the Bloomberg Galaxy Crypto Index (BGCI) is predicting that the bull market that started in June will start at a discounted price for Bitcoin.
Bitcoin has corrected roughly 50% from its 2021 high and appears to be establishing a bottom support around $30,000. That level is near last year's close and the 12-month moving average. The BGCI has risen about 130% in 2021, and it has also seen a nearly 50% correction from its peak of more than 250% in early May. Much of the excess speculation has been removed, leaving Bitcoin fundamentals intact.
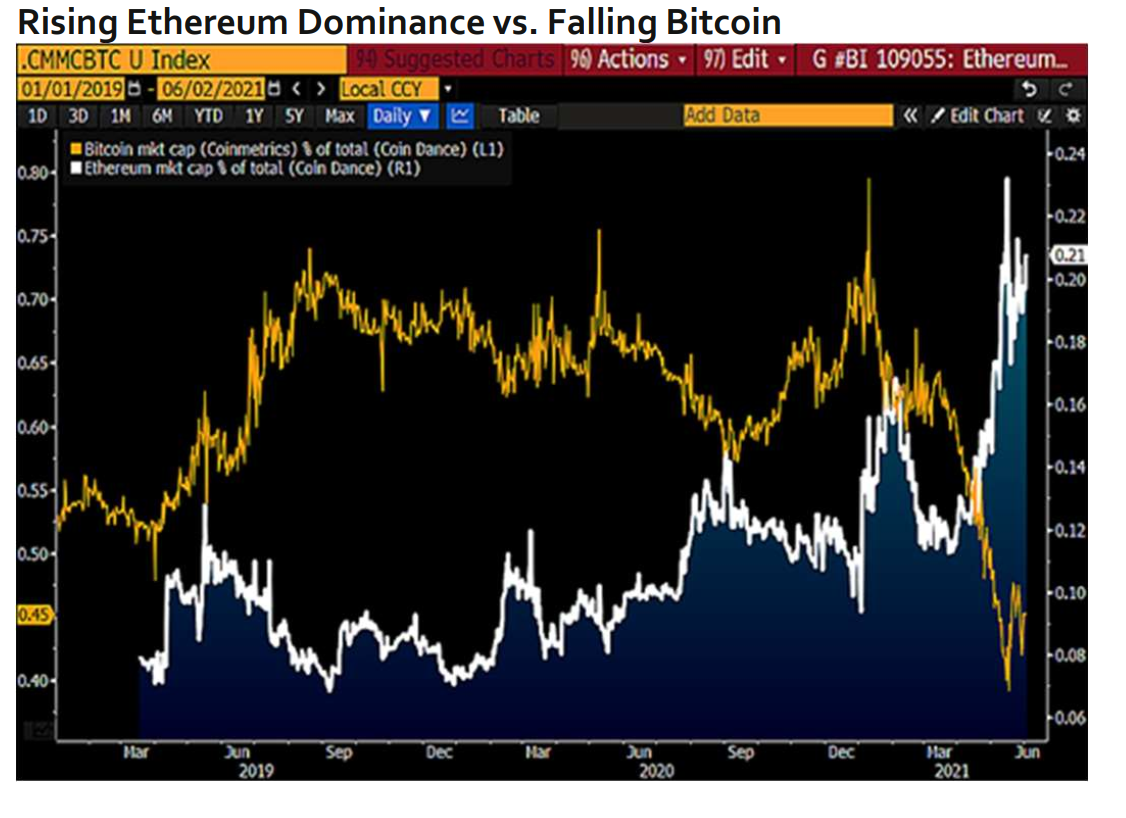
The benefits of diversification need to be emphasized, especially in an emerging asset class like cryptocurrencies. The longer-term trend appears to be for Ethereum to gain greater market share relative to Bitcoin. Both have bullish fundamentals, but Ethereum's fundamentals and use cases are a strong complement to Bitcoin's broader store-of-value attributes. The chart below depicts transaction volume as a leading indicator driving Ethereum, which has reached 50% of Bitcoin in terms of market capitalization. Since the beginning of 2021, ETH's 10-day average transaction volume has doubled to 80% of Bitcoin's. (Coinmarketcap)
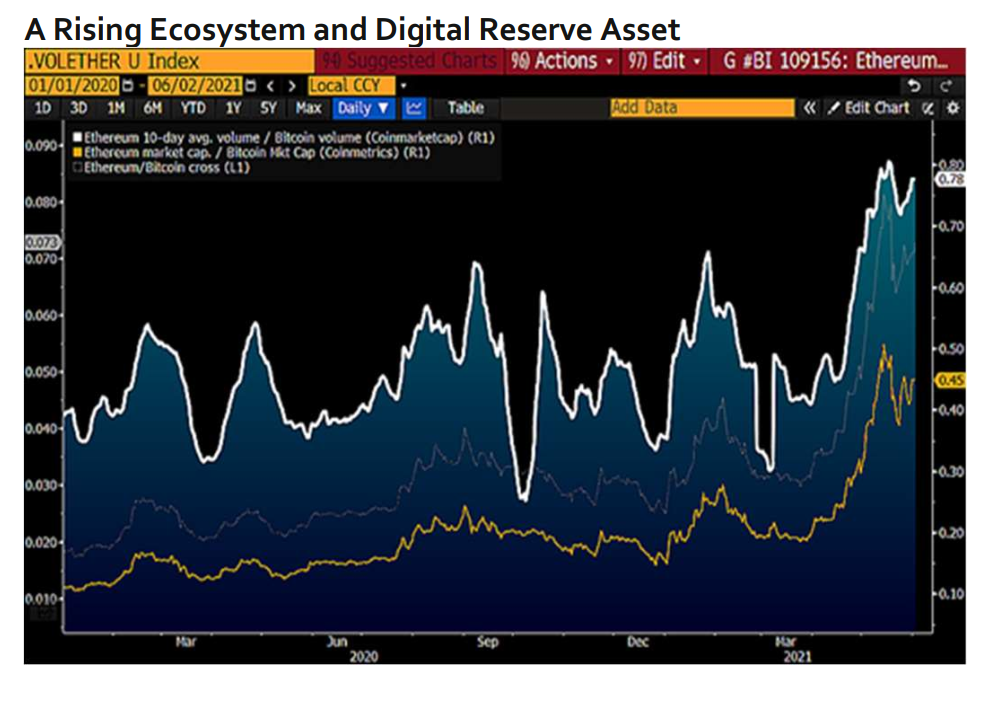 Bitcoin and Ethereum may have unique timing advantages. Reduced supply combined with historically low interest rates and a massive injection of money into the system form a solid basis for cryptoasset price appreciation if economic rules apply. Adoption is in its early stages, but it's key, and Bitcoin appears to be winning the race, as evidenced by Tesla's allocation of some of its equity wealth to the digital asset.
The chart below depicts Bitcoin’s annual mining supply falling below 1% by 2025 vs rapidly increasing US debt
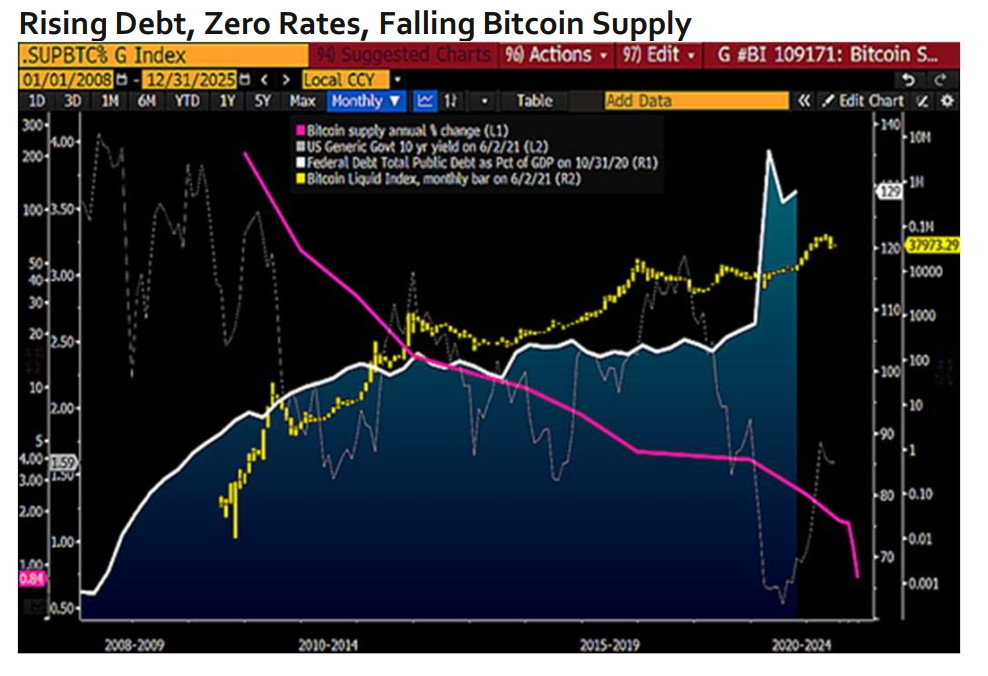
The chart below depicts Bitcoin’s annual mining supply falling below 1% by 2025 vs rapidly increasing US debt
10,Normally, such a backdrop would be ideal for pushing up the dollar price of gold, but the old world reserve asset is being replaced by the digital upstart. We see little stopping this trend and expect it to accelerate.
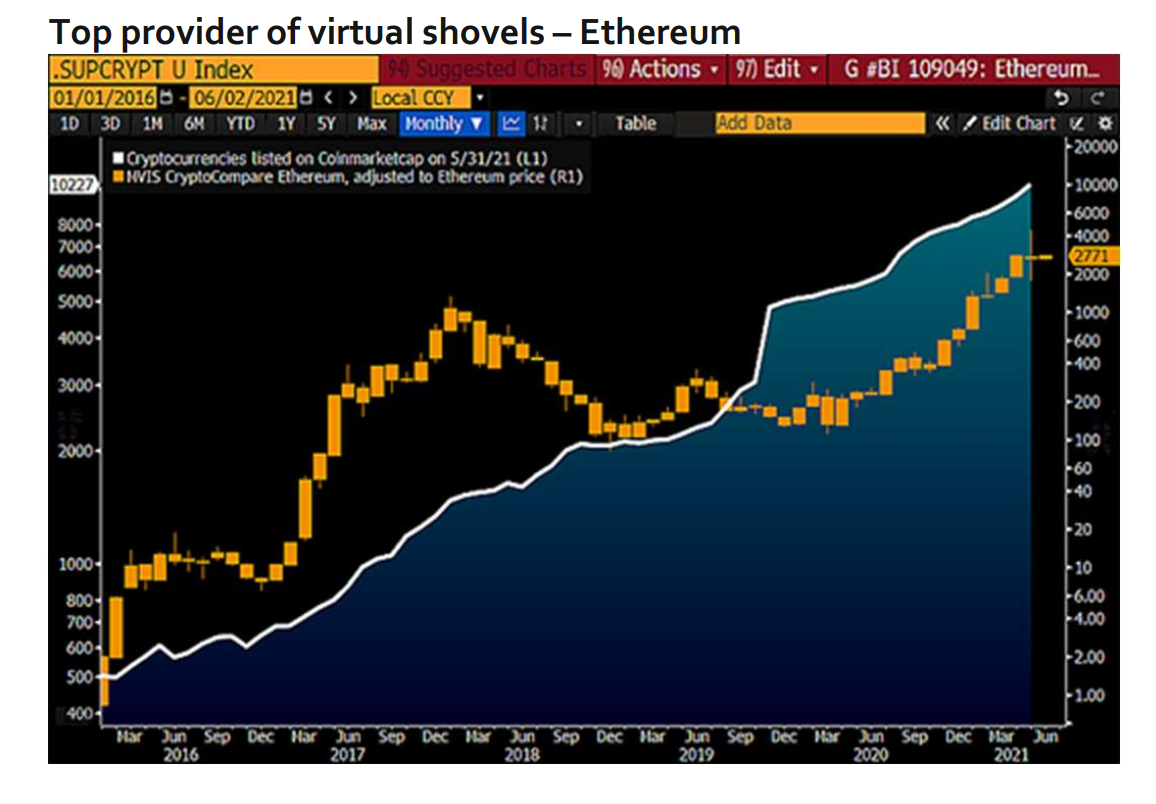
000 cryptocurrencies solidified the foundation of Ethereum. The increasing number of crypto assets listed on Coinmarketcap is a tailwind from Ethereum, the coin’s main base.
The chart below juxtaposes the roughly unchanged CNY/USD exchange rate over the same period with Tether’s parabolic market capitalization gains.
2. The U.S. Wins the Digital Cold War
The U.S.-China digital cold war is as dynamic as the Yankees won. In a new Cold War, China squashes new technology for Bitcoin and digitization of the currency’s open-source code, and we expect the US to embrace it. With proper regulation, the few things that can be messed up are increased dollar dominance, as evidenced by Tether, the world's most widely traded crypto asset. We believe that it is only a matter of time before crypto ETFs emerge.
The digitization of money is here: the dollar is king. It is the organic adoption of digital assets, and the US dollar as the main currency, that brings our biases closer to the same, especially the appreciation of crypto asset prices. Despite the rapidly rising US debt-to-GDP ratio and quantitative easing, the trade-weighted broad dollar is up about 30% on a 10-year basis, while the Chinese yuan is the most heavily weighted currency in the index.
The chart below juxtaposes the roughly unchanged CNY/USD exchange rate over the same period with Tether’s parabolic market capitalization gains.
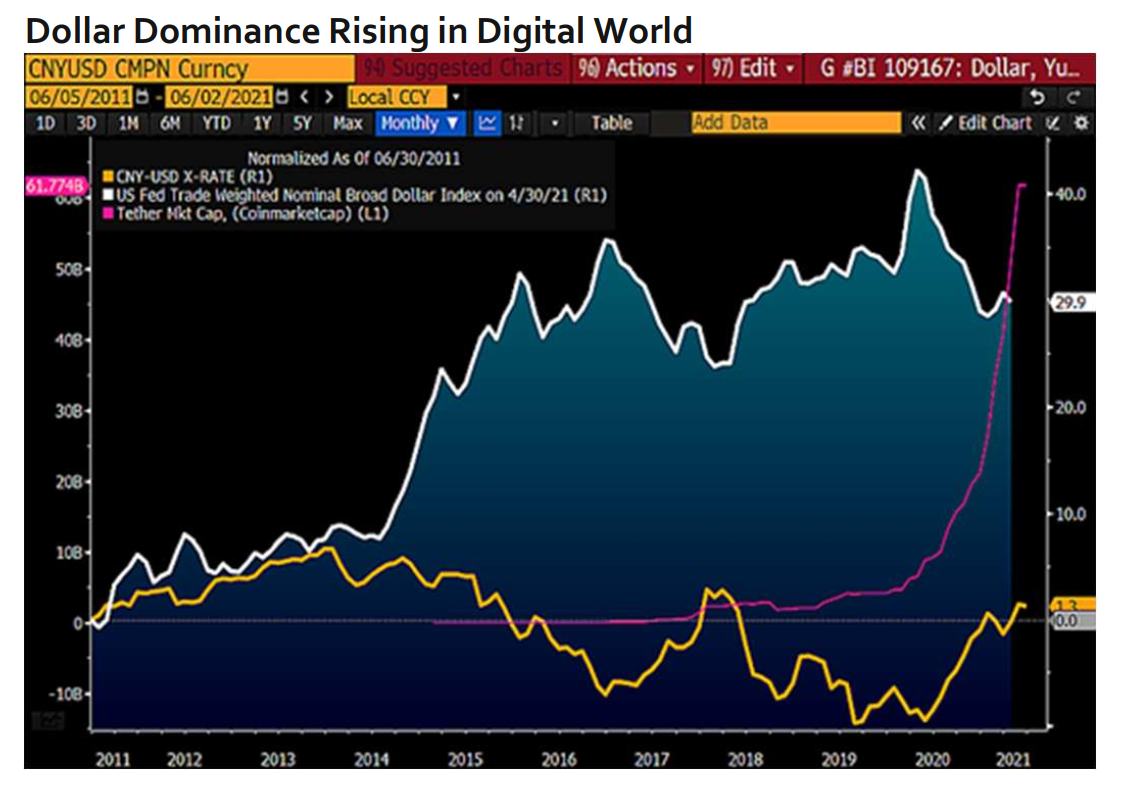
The fact that Tether has become the world’s most widely traded crypto asset despite the US’s declining share of global GDP is no different than the way things are going – with the dollar dominating the digital world.
The chart shows that the 30-day average volume for crypto futures is $2.6 billion, while the 200-day average volume for wheat futures has held steady below $4 billion for about a decade. There is little to stop the dollar value of daily bitcoin futures volume from surpassing that of wheat.
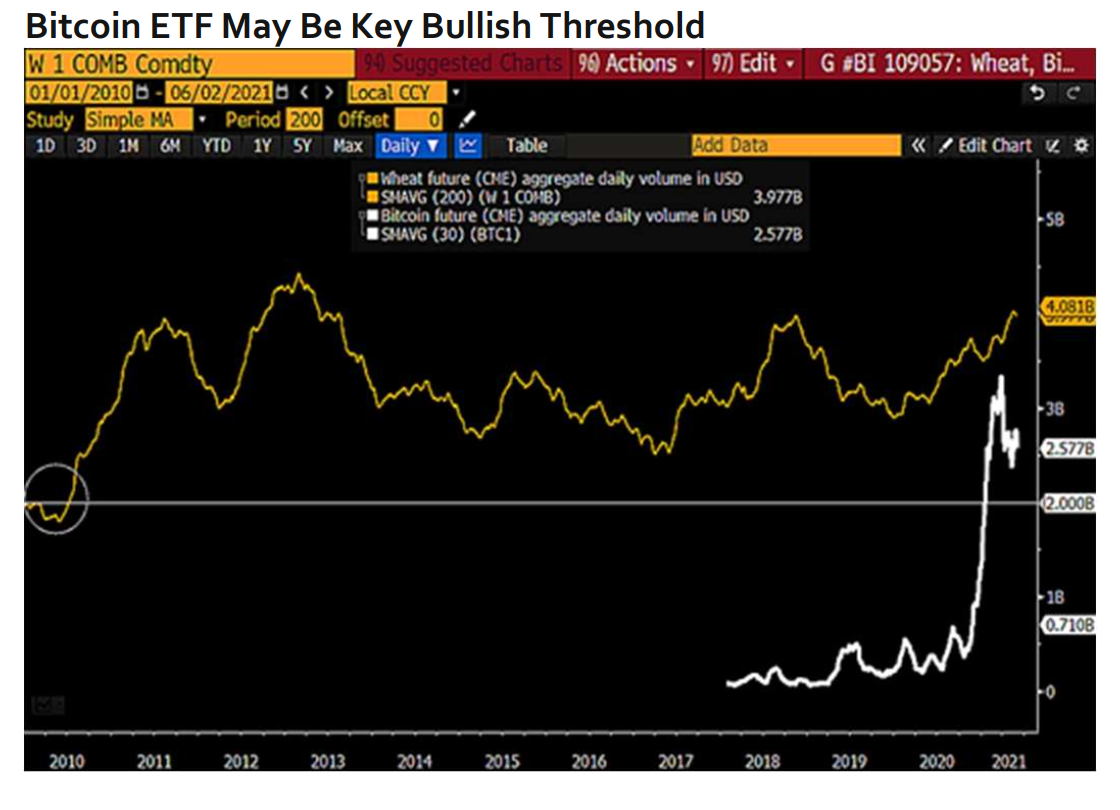 The chart shows that the 30-day average volume for crypto futures is $2.6 billion, while the 200-day average volume for wheat futures has held steady below $4 billion for about a decade. There is little to stop the dollar value of daily bitcoin futures volume from surpassing that of wheat.
Advantages of High Beta Bitcoin over Stocks?
Advantages of High Beta Bitcoin over Stocks?
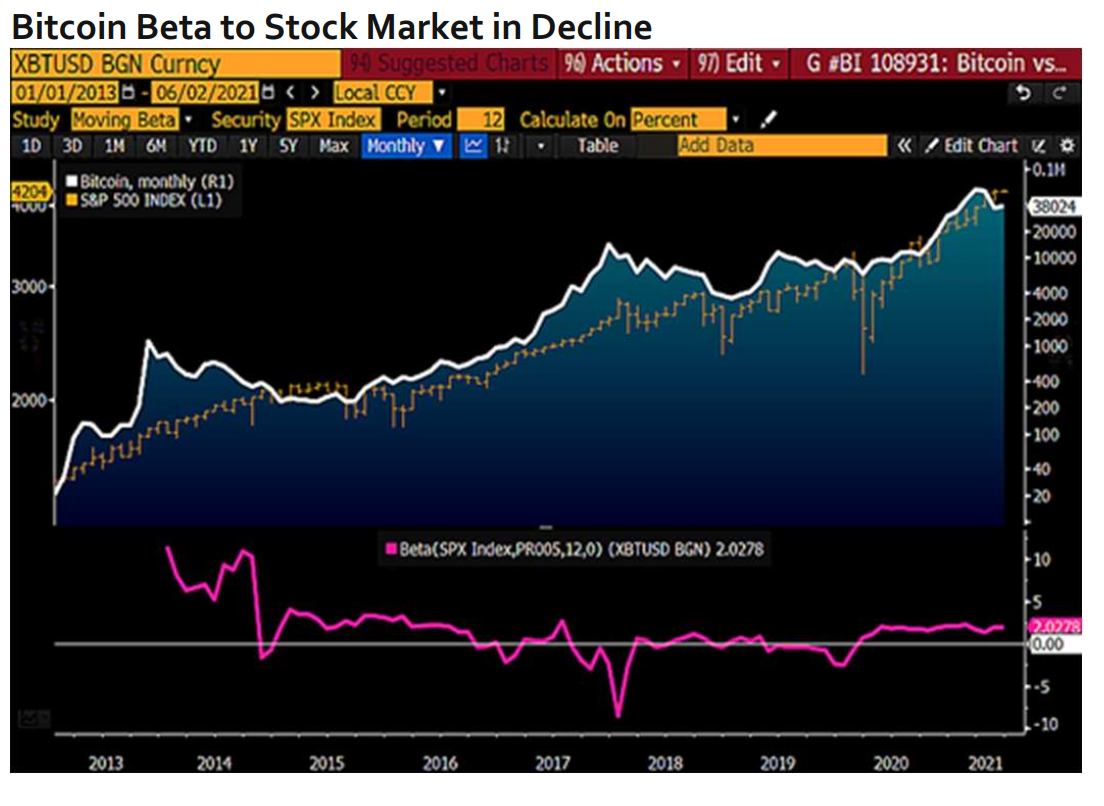 Most assets increasingly rely on rising stock prices for support, but Bitcoin may become an exception. The chart depicts a relatively high 12-month bitcoin-to-equity beta of about 2x, down from a peak of about 16x in 2013.
secondary title
You can only tell who is swimming naked when the tide goes out, while Bitcoin, Ethereum, and Tether are all “clothed” and shine in the top three positions in the crypto market. Bitcoin is the digital reserve asset, Ethereum is the main ecosystem builder, and Tether (an Ethereum token) represents a world that is rapidly going digital on the back of dollar dominance. Tether's rise to the third-largest cryptocurrency market capitalization is one of the most consistent trends in the digital space.
Bitcoin, Ethereum, Tether — the steadfast survivors. Consistent strength and performance deserves respect, which is how we view the digitization of money represented by Tether. Despite controversies and regulatory crackdowns, the rising market capitalization of the world’s benchmark USD token has been an ongoing indicator of the expanding digital asset ecosystem. The chart below depicts the top three cryptoassets on Coinmarketcap in early June: Bitcoin, Ethereum, and Tether.
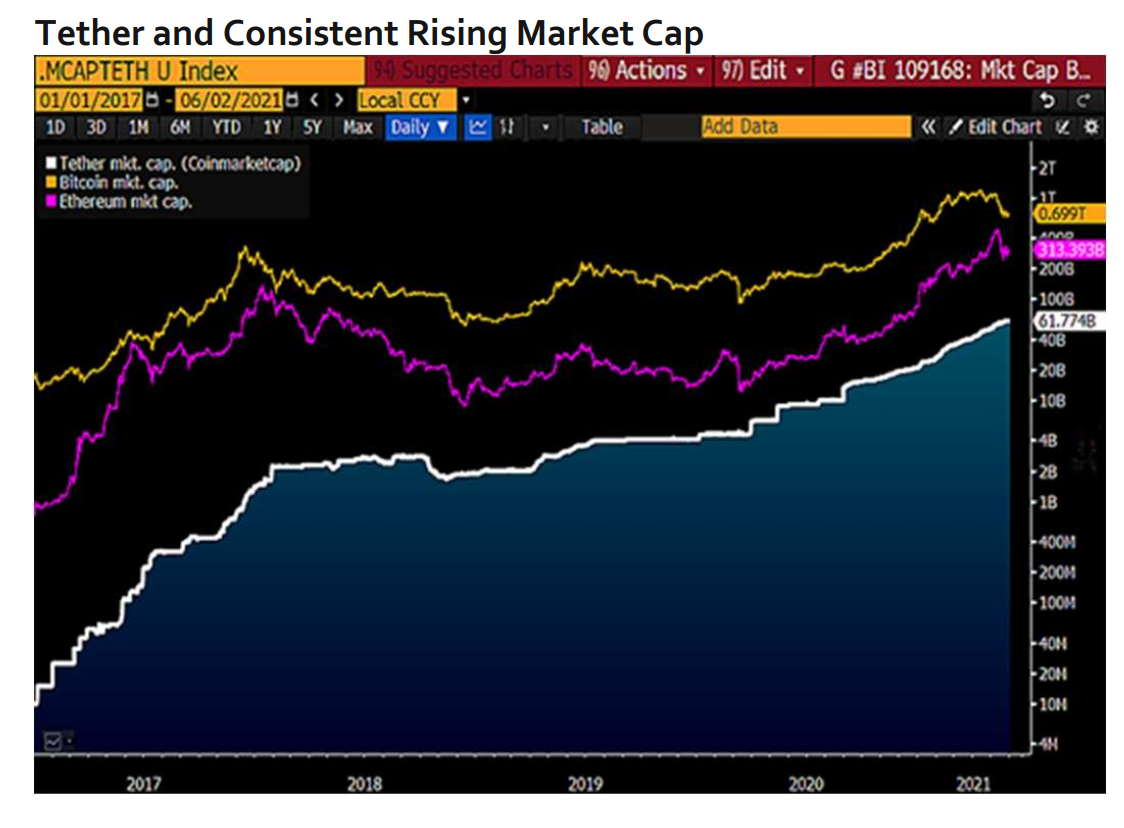
Bitcoin, Ethereum, Tether — the steadfast survivors. Consistent strength and performance deserves respect, which is how we view the digitization of money represented by Tether. Despite controversies and regulatory crackdowns, the rising market capitalization of the world’s benchmark USD token has been an ongoing indicator of the expanding digital asset ecosystem. The chart below depicts the top three cryptoassets on Coinmarketcap in early June: Bitcoin, Ethereum, and Tether.
While most crypto assets fell, Tether gained prominence in 2018 when its market capitalization and trading volume were still rising. Digital dollar adoption is surging, with Ethereum-based dollar tokens breaking into the top 10.
4. Bitcoin is dormant, stronger, and more environmentally friendly
4. Bitcoin is dormant, stronger, and more environmentally friendly
What happened to Bitcoin? It will be more powerful, greener and extend less. In our opinion, the reason for Bitcoin’s recovery is the continuation of the bull market and the inevitable path to $100,000. Markets got a little overheated in April, with a major factor in the cryptocurrency correction — excessive energy usage — representing the strength of the world’s largest decentralized network. China's restrictions have instead promoted the benefits of Bitcoin and shifted energy to renewables.
In 2021, Bitcoin's fundamentals are solid. At the end of 2020, Bitcoin's historical trend indicated that the cryptocurrency would move significantly higher in 2021, and it did. Bitcoin was up about 35% through May 24 of this year, getting a little too high around $65,000, but it found multiple layers of support below $30,000 amid a roughly 50% drop from its peak.
The chart below depicts a key part of Bitcoin's fundamentals in 2021: In 2020, 260-day volatility has fallen to its lowest level ever compared to most major asset classes (notably the S&P 500). Combined with last year's supply reduction, migration to institutional portfolios, Ethereum futures, and the launch of ETFs in Canada and Europe, we think Bitcoin's potential to move towards $100,000 is more likely than staying below $20,000.
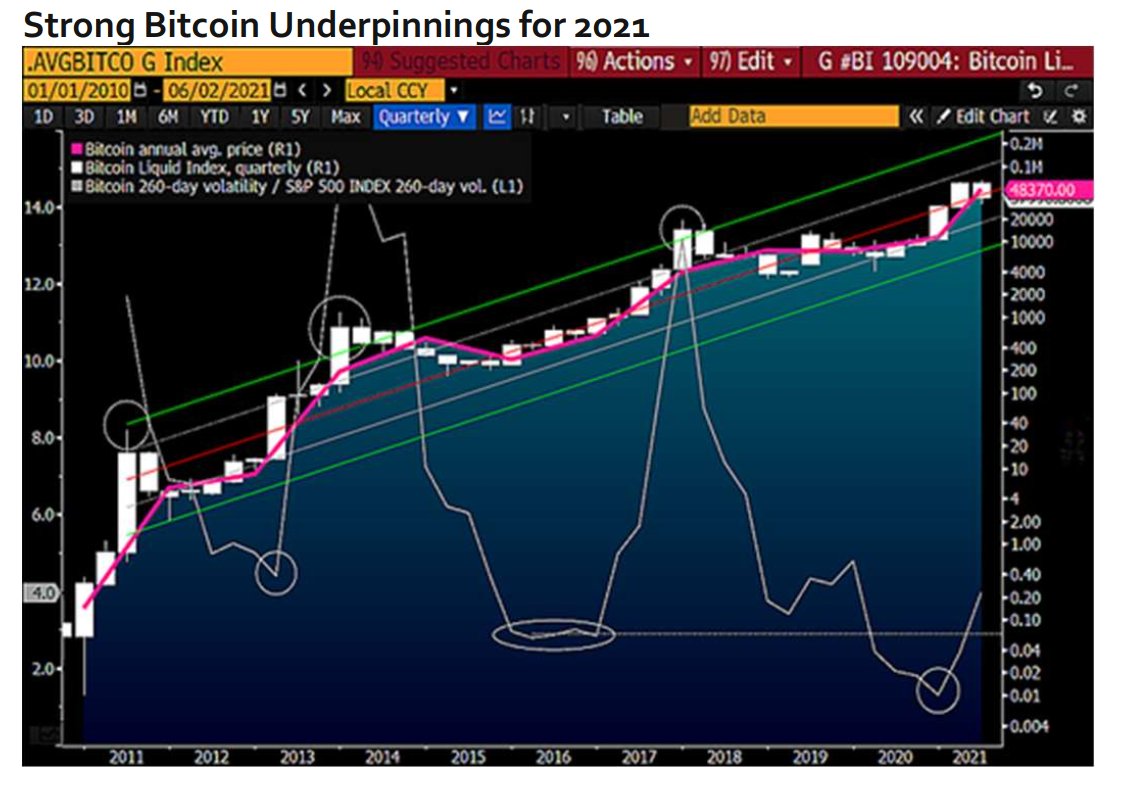
$100,000 for 2021 is eligible. The chart below depicts the cryptocurrency's potential path towards resistance around $100,000. Similar to the big rebounds in 2013 (55x) and 2017 (15x), the supply in 2021 is reduced. The 2020 halving is taking place against a backdrop of unprecedented global fiscal and monetary stimulus and institutional tilt toward Bitcoin allocations. For the better part of the past decade, cryptocurrencies have become increasingly likely to become digital reserve assets and maintain their planned course.
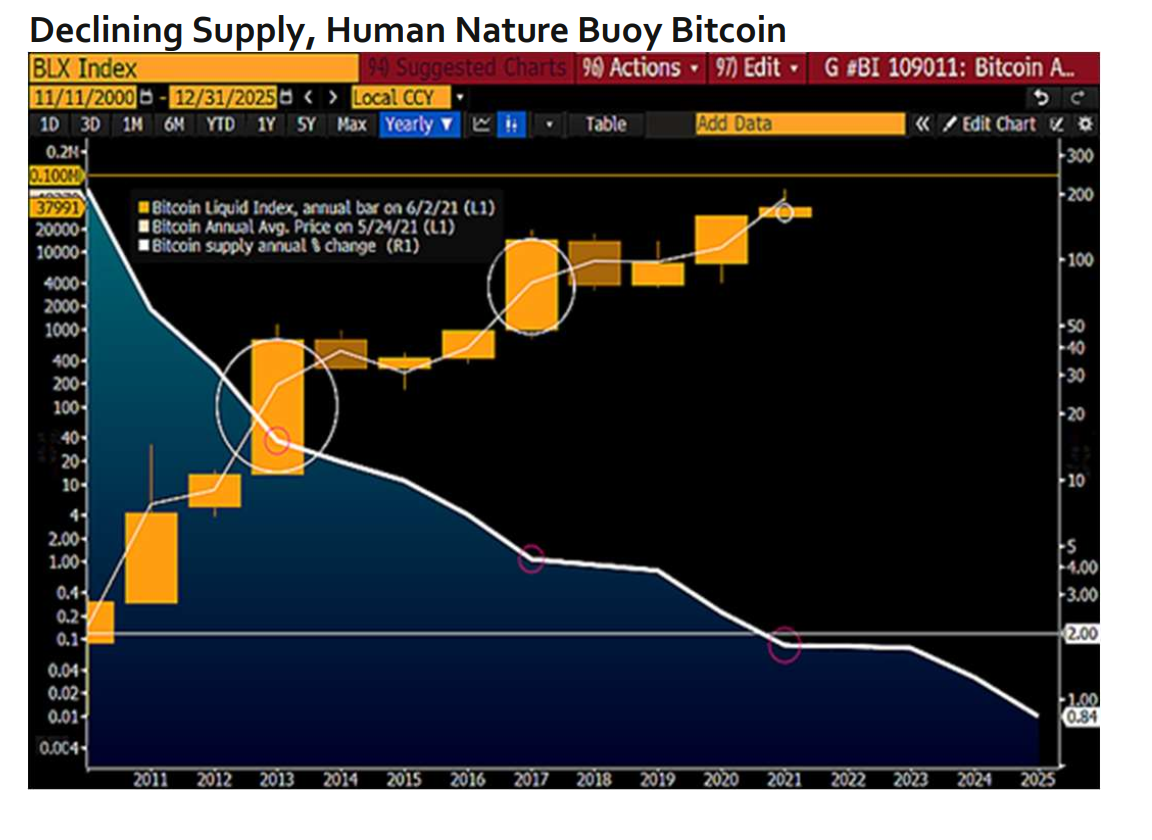 Another point of support comes from the recognition of new asset classes. Gold may be losing its importance, so diversification may just be prudent.
secondary title
5. Technical Analysis: A Discounted Ethereum Bull Market
5. Technical Analysis: A Discounted Ethereum Bull Market
2,000-4,Ethereum is the go-to platform for cryptocurrencies and decentralized finance, and our analysis shows that Ethereum is trading at a discount in a protracted bull market. Looking like Bitcoin in 2017, with slight gains compared to the broader market, Ethereum has removed excess speculation and should consolidate in the $2,000-$4,000s for a while.
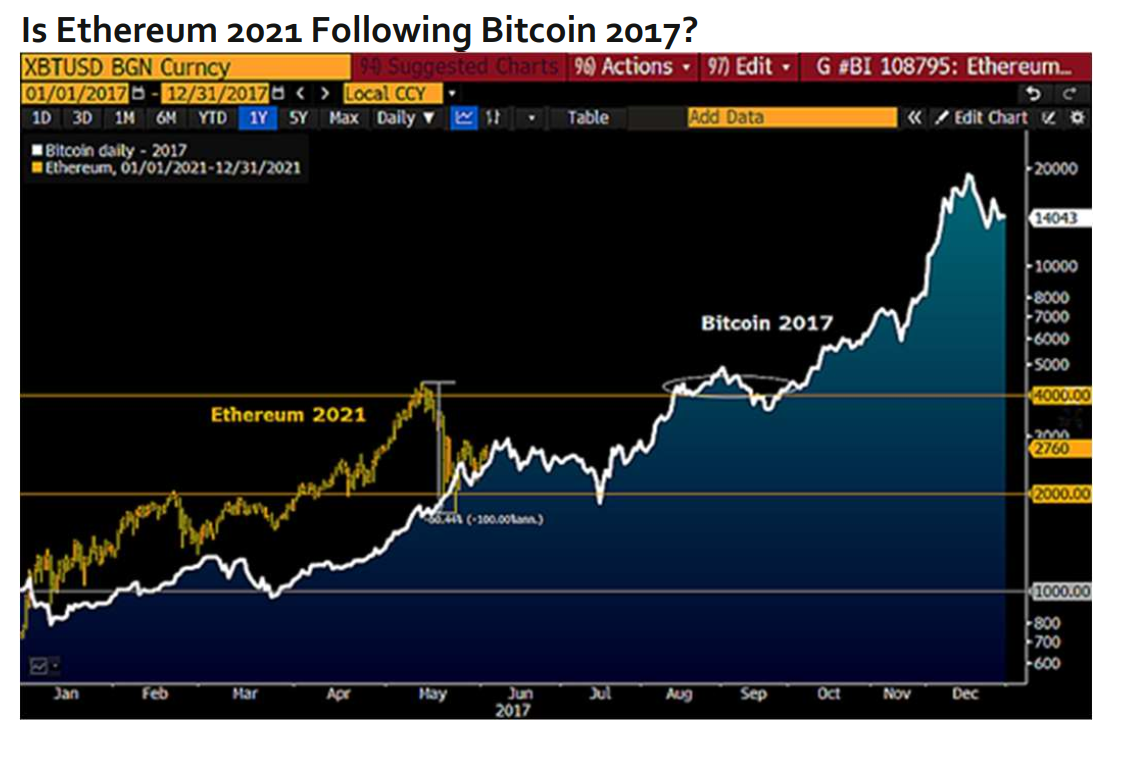 $000 is probably the sweet spot for Ethereum. Ethereum has a price advantage over bitcoin, the world's digital reserve asset, which is expected to reach six figures in 2021. Ethereum traded just above $4,000 in mid-May, but now looks like a discounted bull market after a correction of about 60% on May 26 to about $2,800. The chart depicts ETH back on a bullish trajectory, following Bitcoin's 2017 price action. Similar to ethereum at the start of the year, bitcoin started 2017 around $1,000 and peaked at just under $20,000. Ethereum is likely to remain in the roughly $2,000 to $4,000 range it had in May until October and embark on an upward path similar to Bitcoin's in 2017.
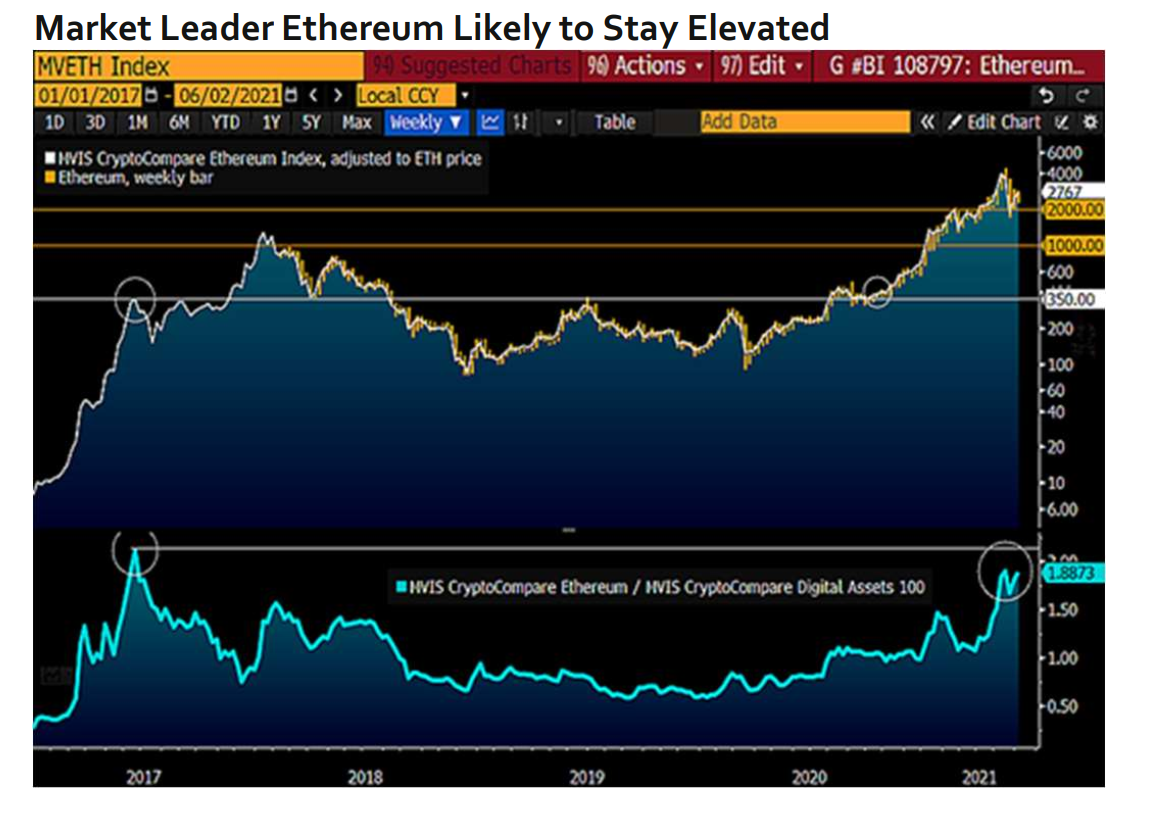
Discount Bull: Ethereum Drops to $2,000. Relative to the broader crypto market, the price of ETH is close to suggesting that it will struggle for some time. The chart depicts the ratio of ETH to the MVIS CryptoCompare Digital Assets 100 Index, slightly below its 2017 peak. In June of that year, Ethereum hit $350, corrected about 60%, and then climbed back to the peak in November, and we see similarities, ETH has fallen back 60% to just under $2,000, and it is now at a discount. In the bull market.





