


Go ahead and break through 700? Ethereum Trend Analysis


At present, both Ethereum and Bitcoin have hit new highs in 2020, and the price trends of the two are very consistent. The recent highly bullish trend in Ethereum has seen the price of the digital asset surge higher, having breached the pivotal $500 mark.
secondary title
New price highs reflect bullish strength
image description
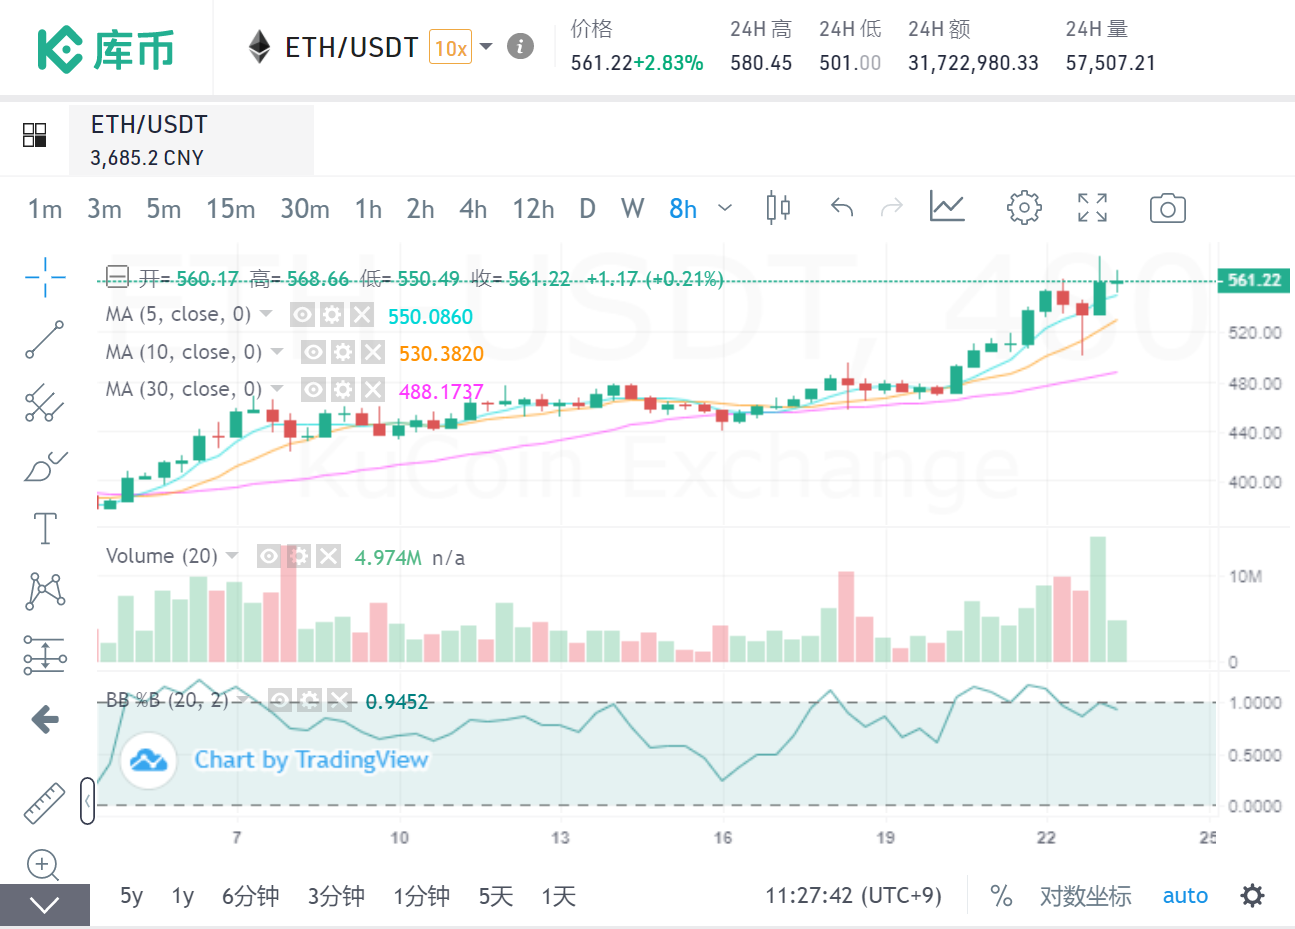
Ethereum price chart(Source: KuCoin Exchange)
secondary title
Is Ethereum hitting $700 next?
Weekly chart analysis reveals a long-term bullish trend for Ethereum. Despite a dull few days, Ethereum has picked up pace to cross some key resistances. It’s up more than 400% from its March lows and is roughly flat with other significant digital assets.
Ethereum analysts are confident that the price will hit higher. Ethereum remains highly bullish even as technical indicators approach oversold territory on the hourly chart.
UpcomingETH 2.0 is the real reason for the prosperity of the entire ETH ecosystem. ETH 2.0 is scheduled to be launched on December 1st, and it is the most important upgrade of the ETH network. Moving towards Proof of Stake will bring significant performance, speed and efficiency improvements.
secondary title
Long-term trend is bullish
Short-term or hourly charts can be misleading. For example, an hourly time frame might depict stagnant or zigzag price action, while a weekly or daily chart clearly indicates a long-term trend. Ethereum is trending very positively, as indicated by last week’s price surge. according toIntoTheBlockAccording to the data, about 75% of ETH addresses are now profitable.
On the weekly chart, ETH/USD has been rising since March, bouncing from a March low of $90 to a high of $580. The sustained bullish momentum could help the asset pair cross the 38.2% Fibonacci retracement level towards a new target of $700.
Bearish Trend Judgment: Is $700 A Pipe Dream?
Traders and investors are betting on a bullish trend for Ethereum based on overall market sentiment. In addition to exchange data, derivatives market data can also help to get a clear picture of possible future trends for Ethereum.
Right now, Bitcoin options are relatively flat, but heading towards overheated levels. The December call option is priced at $70,000. Ethereum options in December 2020 are trading near $1,120 compared to BTC. Upside is only plausible if the ETH 2.0 launch goes according to plan and traders are ETH long-termists. The bullish rally of the past few days has indeed reflected the bullishness of traders, but the options movement must not be ignored either.
Search for "wealthy women, intellectual women and big beauties" to get more cutting-edge and interesting articles!
Search for "wealthy women, intellectual women and big beauties" to get more cutting-edge and interesting articles!





