


BTC, SUSHI, ETH Popular Currency Market Review


Summary Overview
Summary Overview
BTC is going bearish. BTC’s reaction to bearish indicators will affect its performance for the rest of the year. If BTC can hold the $11,300 support level until the indicators turn bullish, then we should see BTC reach all-time highs again before the end of the year. However, if BTC fails to hold this level, then we are likely to see BTC fall all the way back to $10,500 or even $10,000 in the next few weeks. (Writing time is September 3, 2020)
SUSHI is one of the latest DeFi hot coins recently. Technical analysis shows that a potential breakout may be imminent.
LTC is one of the worst-performing major cryptocurrencies since the March circuit breaker, as shown in the chart below, comparing BTC and ETH.
NEO has performed very strongly recently, rising from $12 to $20 within a month, an increase of 80%! This is also a feature of NEO. However, there is some doubt as to whether this will continue; it will depend on whether NEO can use the Bollinger Band 20-day MA support line.
LEND is currently exhibiting a bearish descending triangle pattern due to a negative candle breaking below the triangle.
EOS is currently rapidly approaching the neckline. If this line breaks, then a drop to $2.6 and then to $2.4 is likely. A drop to $2.4 would result in a loss of 16% from our current position.
XRP has support at $0.245, and while XRP is one of the established cryptocurrencies, this support level has more historical correlation, which is why XRP should be one of the better performing cryptocurrencies if a potential sell-off happens.
The chart for ETH is rather uncertain. Both up and down are doable, with indicators showing no real push in any particular direction.
bitcoin
bitcoin
Crypto markets have had a rough week. Many cryptocurrencies saw declines of more than 5%, and BTC failed to break through or hold $12,500.
The reason is that BTC is currently undergoing a necessary adjustment. You must know that the price of BTC in March was 4,000 US dollars, and the price at the time of writing was 11,350 US dollars, which is already a huge increase.
If BTC skyrocketed like it did in 2017 without the current correction, it will go to the bubble again. It is important for the market as a whole that BTC does not fall into a bubble. This is because if BTC falls into a bubble, it could create another wave of investors away from the cryptocurrency market either because their funds are trapped in the bubble, or because it is too risky.
Currently, we have reason to believe that BTC is not in a bubble, and there is some logic to the moves we are seeing so far. However, the same cannot be said for most markets, especially DeFi. Some people have already started calling for #short DeFi#.
More on that later...
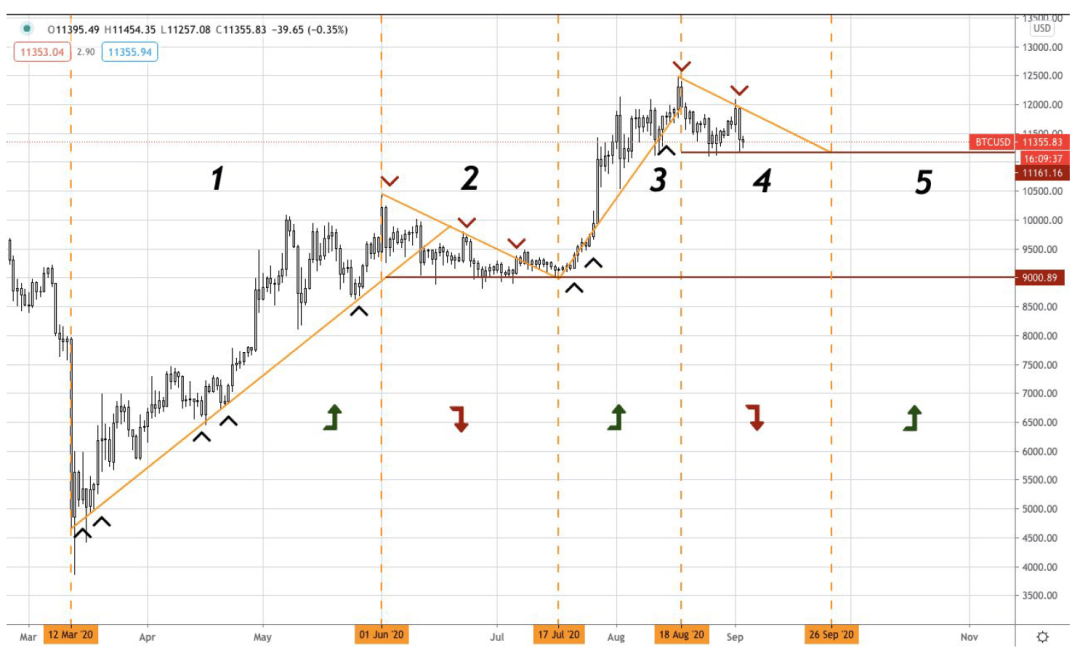
BTC/USD stages
BTC is currently in the fourth of a five-stage movement. This phase mainly revolves around the cryptocurrency’s retracement from the Phase 3 high.
The third stage attempted to break through $12,500 but failed. Stage 4 will be very similar to stage 2, looking for $11,100 as stage 4 support. A break below this would be bearish to $10,800. However, if $10,800 is breached, then the bullish outlook for BTC needs to be seriously reconsidered.
Analysis of the reasons for the sharp drop of BTC on September 2
On September 2, the price of BTC suddenly plummeted from $12,050 to $11,250. This sent BTC down 5% in one day, a huge loss relative to its $20.839 billion market cap.
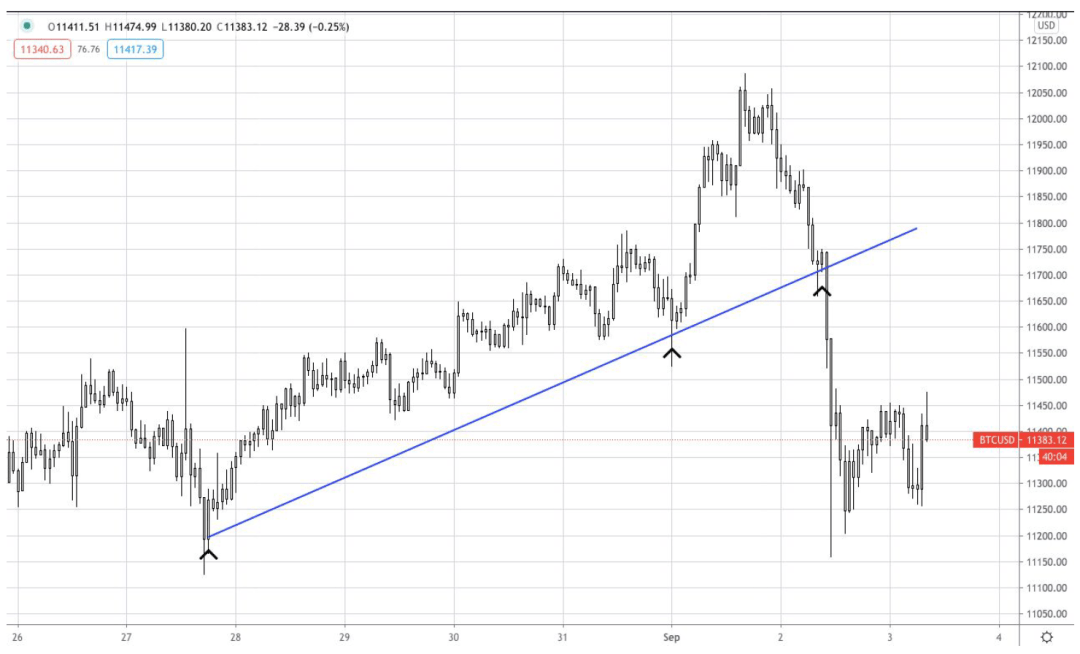
BTC/USD false trend line
At first glance this appears to be caused by a break of the lower trendline. But it wasn't, the lower trendline didn't have enough validation points to capture most of the movement.
What actually happened was a false breakout of the trumpet pattern shown in the chart below.
The investor reaction was exaggerated by the market's leveraged options. Investors are likely to enter with a long position where marked below. Because BTC broke through the overall resistance of the trumpet pattern, the K line uses this resistance as support.
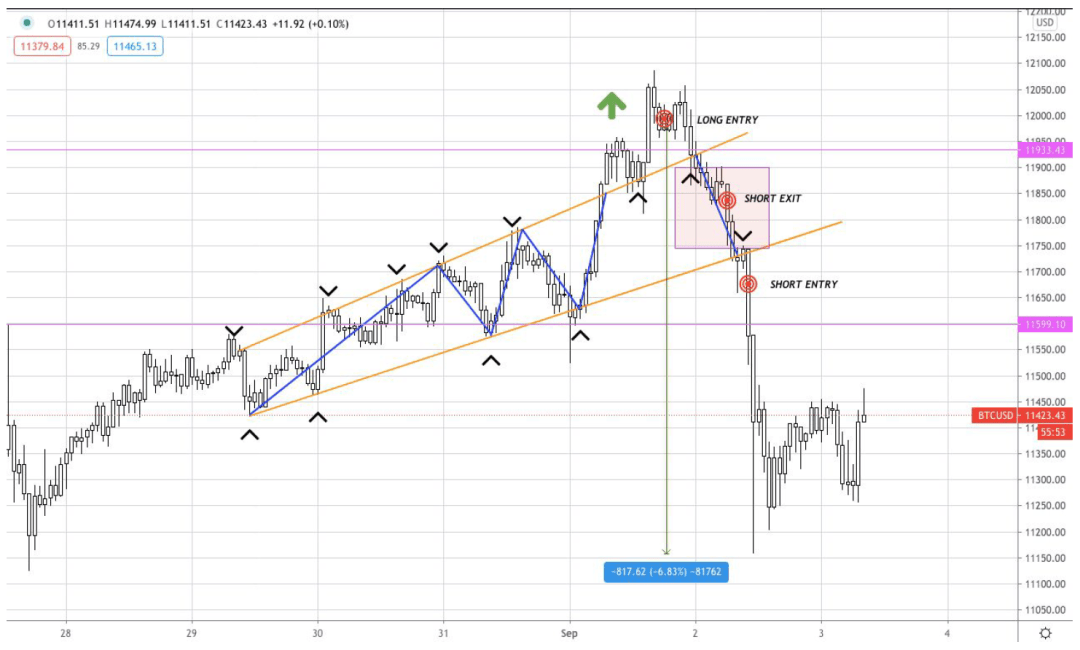
BTC/USD what happened
Then came a major breakthrough. There is a good chance that the bulls will get in, because from there, the $12,000 is very likely to be breached. However, the $12,000 breakout failed and BTC re-entered the trumpet pattern - usually a major bearish signal (or one that you drew the wrong chart). From here, traders will turn bearish as many indicators turn bearish before BTC hits the $11,200 support level.
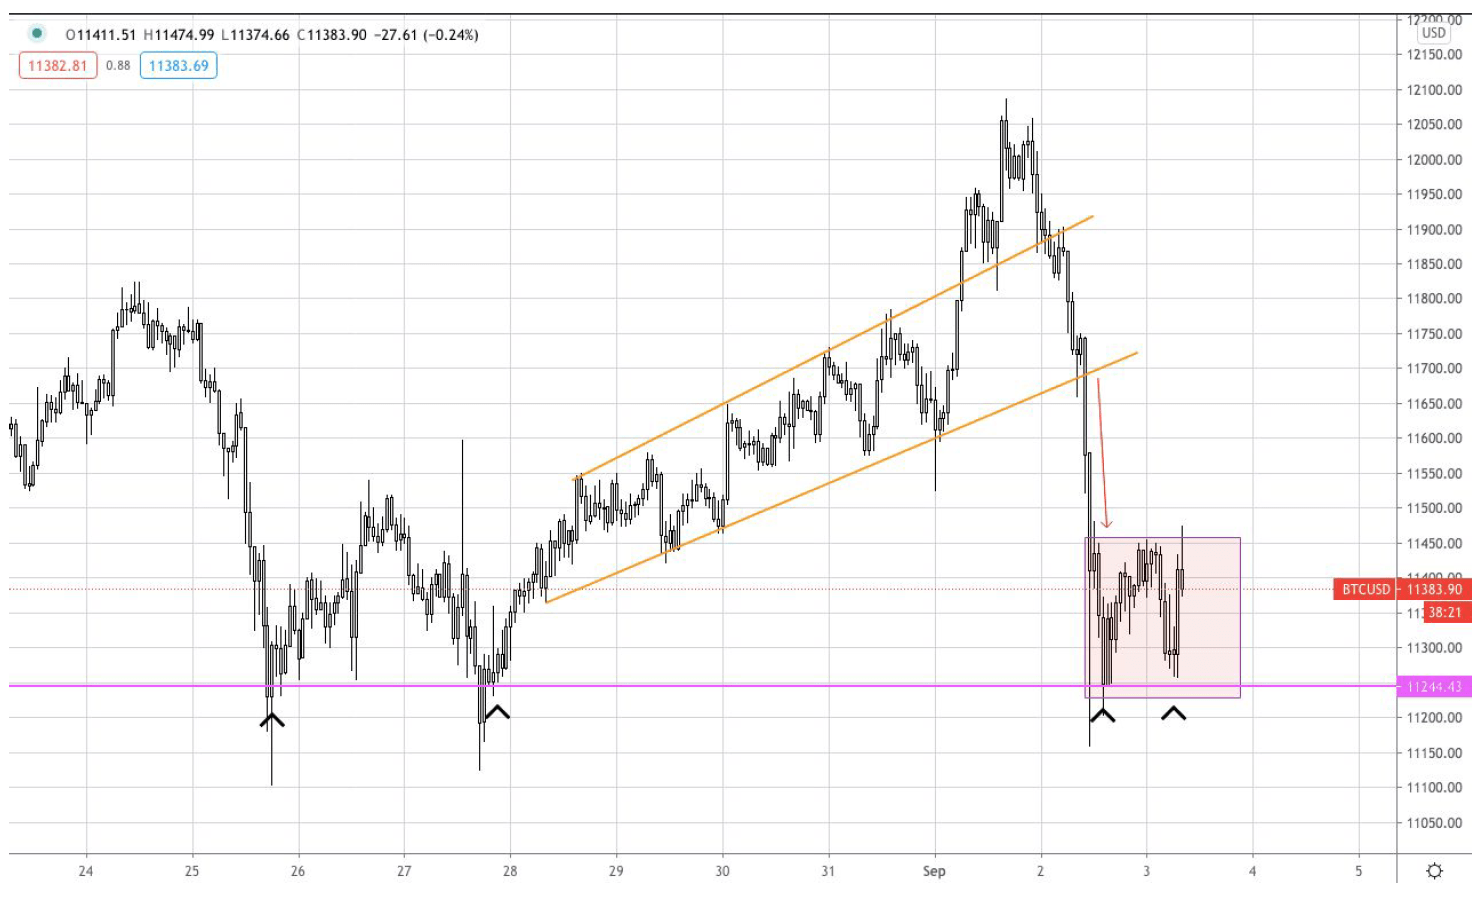
BTC/USD added support
As demonstrated below and previously discussed, due to the gradual and sustainable rise in BTC price, there is an important support level that prevents a sharp downside in BTC. This support level has had multiple points of validation over the past few months and before; it is one of the strongest support levels for BTC. As of September 3, 2020, it has now added more verification points.
However, where does BTC go now? With no patterns on the daily/weekly or even hourly charts, where does BTC stand?
BTC Status Analysis
Overall, the cryptocurrency market remains bullish. However, the market is adjusting. We can gauge market sentiment by observing BTC dominance. Currently, BTC dominance is declining. This is a positive sign for the cryptocurrency market.
During periods of bull market behavior, BTC’s market dominance typically declines, while the opposite usually occurs during bear markets."This is because altcoins are always hit harder than BTC during a bear market, so people put their money in BTC because it's like a"haven
BTC/USD market dominance
, or they deposit more USDT. Therefore, with BTC currently in a negative channel, market sentiment remains bullish. Unless BTC breaks positively above the parallel channel it is currently trading in.
As shown in the chart below, when BTC moves from $12,100 to $11,200, as discussed earlier, we can see that BTC dominance increases when BTC value decreases. The BTC price is represented by the red line, while the dominance is represented by the candlesticks.
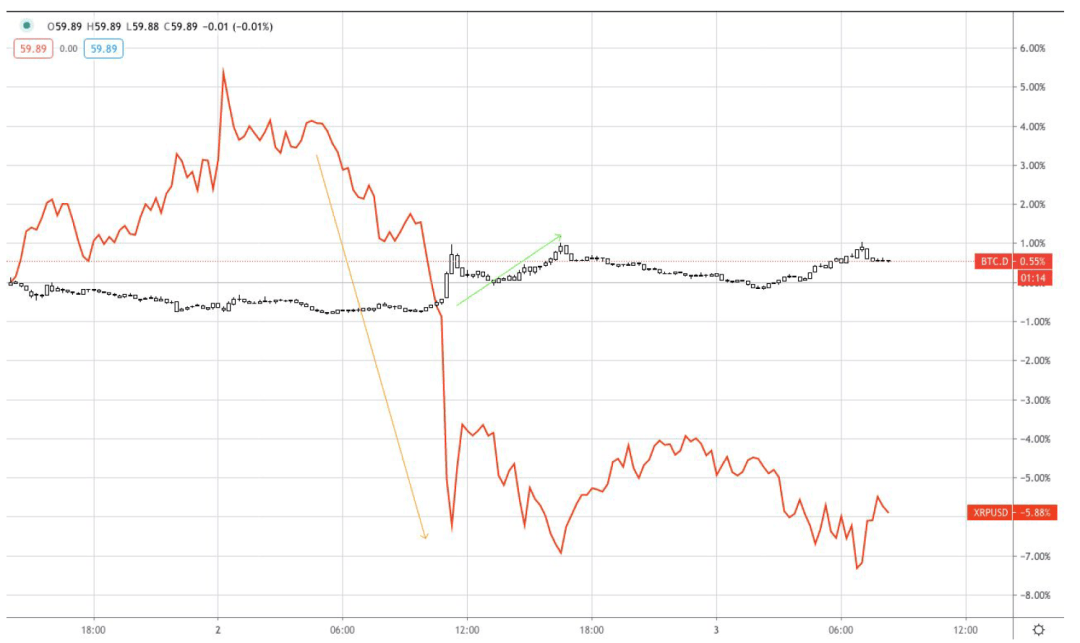
BTC/USD dominance vs price
There is an inverse correlation between BTC and BTC market dominance.
BTC daily outlook
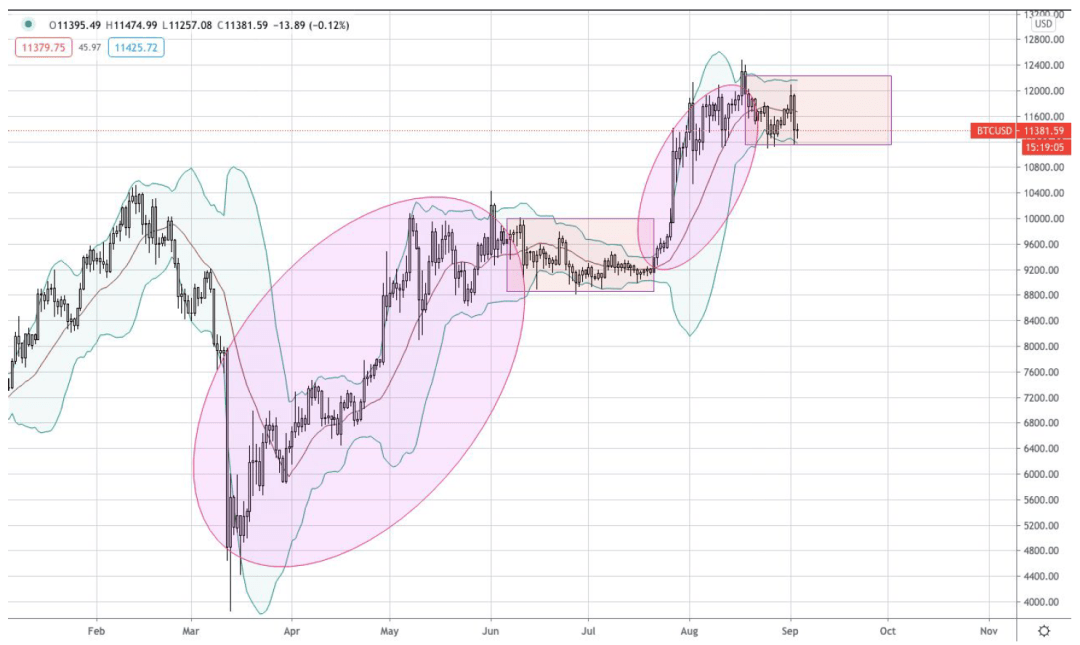
BTC/USD similarities
From the daily outlook, we can see again that BTC is in the fourth consolidation phase. BTC is moving violently in various parts of the Bollinger Bands, but it is not hyperextended in any one direction. In the following trend, the direction of BTC's hyperextension will determine whether the fifth stage will occur, or whether there will be a new adjustment, and the end of this volatility. The Bollinger Bands have also narrowed, again suggesting that we are approaching a period of sideways trading. There are many similarities between BTC's current performance and BTC's performance during the sideways trading period from June to mid-July.
BTC current support level
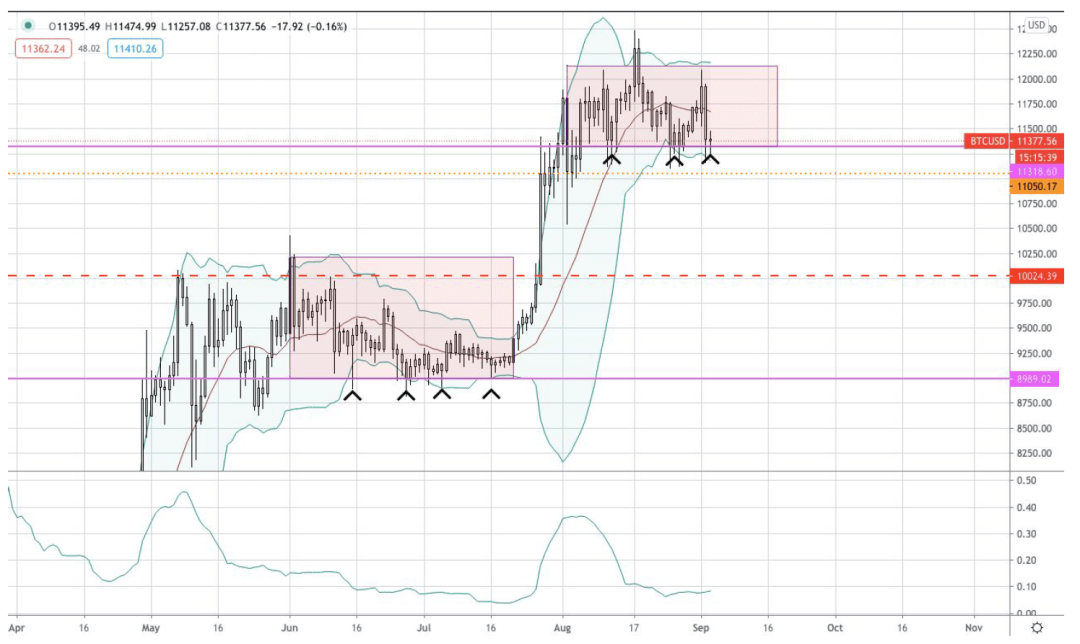
BTC/USD BBs, support levels
BTC MACD
The current important support level of BTC at the time of writing is $11,300. As the chart below shows, BTC has used this level as support three times in the past month. Due to the gradual weakening of this support level, the probability of BTC being held is relatively low, but we will wait and see.
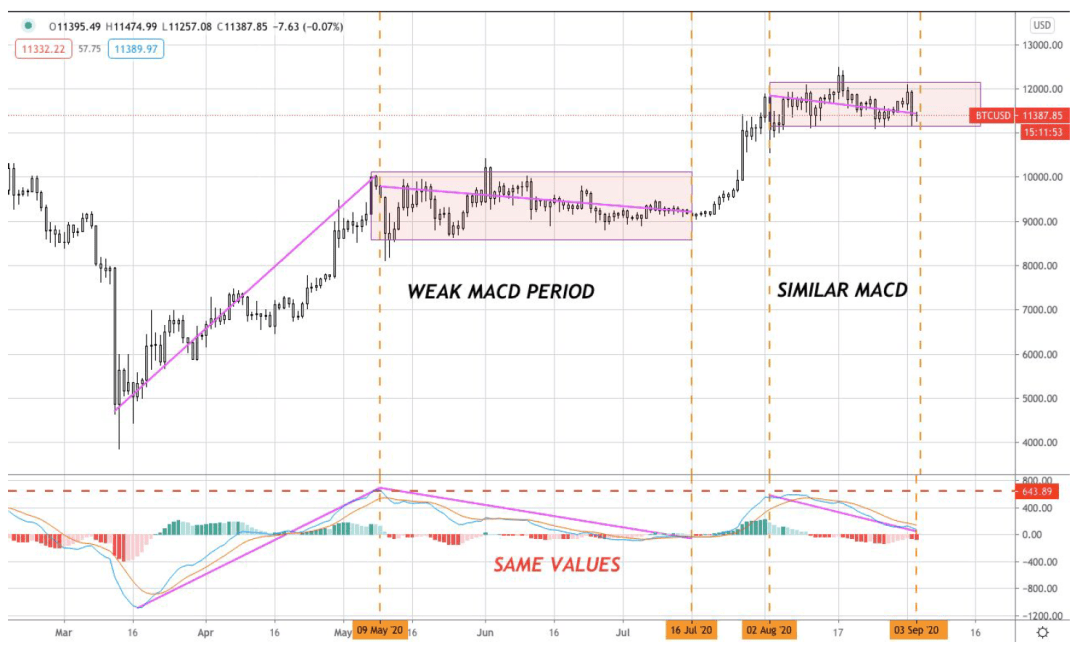
BTC/USD dangerous MACD
The MACD is currently bearish. It is showing signs of weakness and a positive breakout of the positive zone could easily be seen. However, since the MACD is bearish, this could be bad news for the $11,300 resistance. MACD could lead to a break below this level. This would deprive BTC of the significant gains it has made recently.
BTC/USD price indicator
Group 1 – QQE MT4, RSI
QQE MT4 - The QQE MT4 is currently bearish, although divergence has emerged. This could mean that there is a downside in BTC, or that the bulls take control of the bears, allowing a slight sell-off before BTC reaches new heights. Overall, the indicator is bearish.
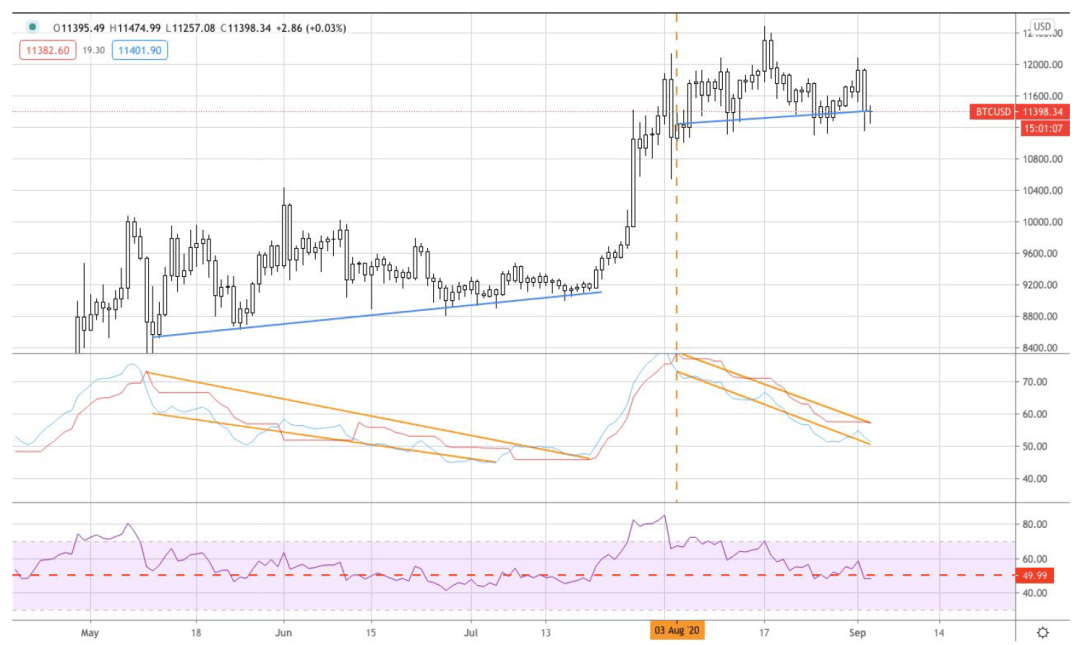
Indicators set one QQE MT4, RSI
RSI - Currently the RSI is showing a 50/50 balance. The demand for BTC has dropped significantly. The indicator is neither bullish nor bearish - neutral.
Group 2 – KCs, SAR, PPs, WWV
KCs - neither bullish nor bearish, suggesting that BTC will trade sideways and we should wait for a breakout in either direction before taking a trade.
SAR - The SAR is currently above the BTC price. This is yet another bearish indicator.
PPs - BTC recently broke below the central PP. This is very important, and it indicates that a bear market is turning - a bull market that threatens to spin out of control. bearish.
EFI - The EFI shows that bears are trying to dump BTC since the price surge since mid-August. This has been shown recently, with BTC currently trading below the EFI center point.
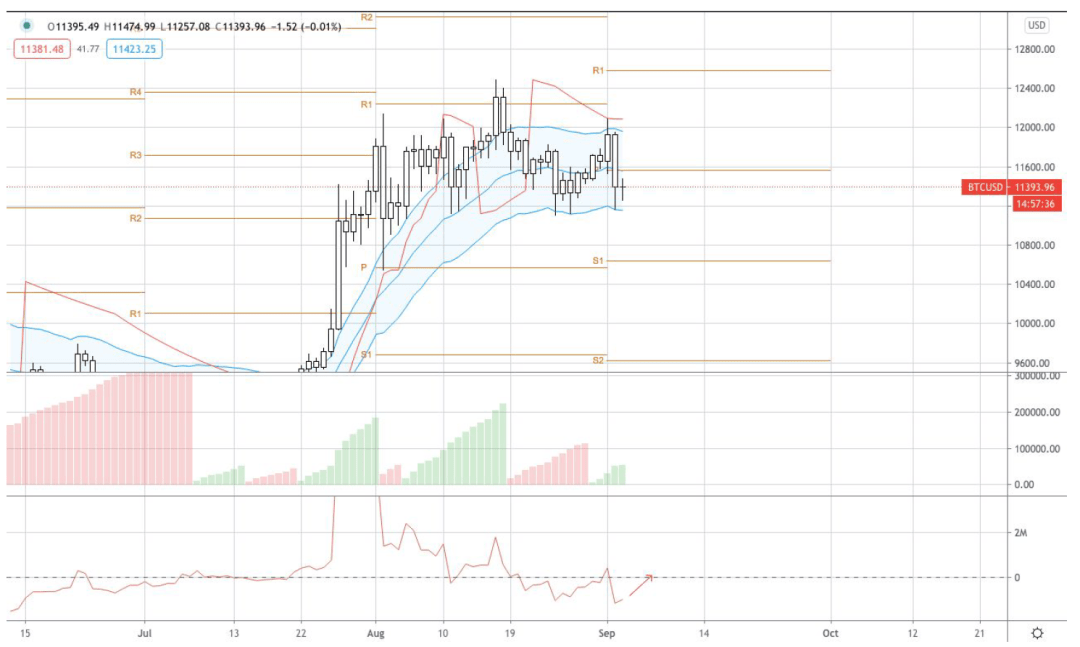
BTC/USD KCs, SAR, PPs, WWV
WWV - WWV is currently bullish as the indicator shows green bands.
Group 3 – Gann HL, 6&20 day SMA
6/20 EMA -- There has been a bearish crossover of the EMAs recently. This makes 6 a cross below the 20-day moving average. This indicator is bearish.
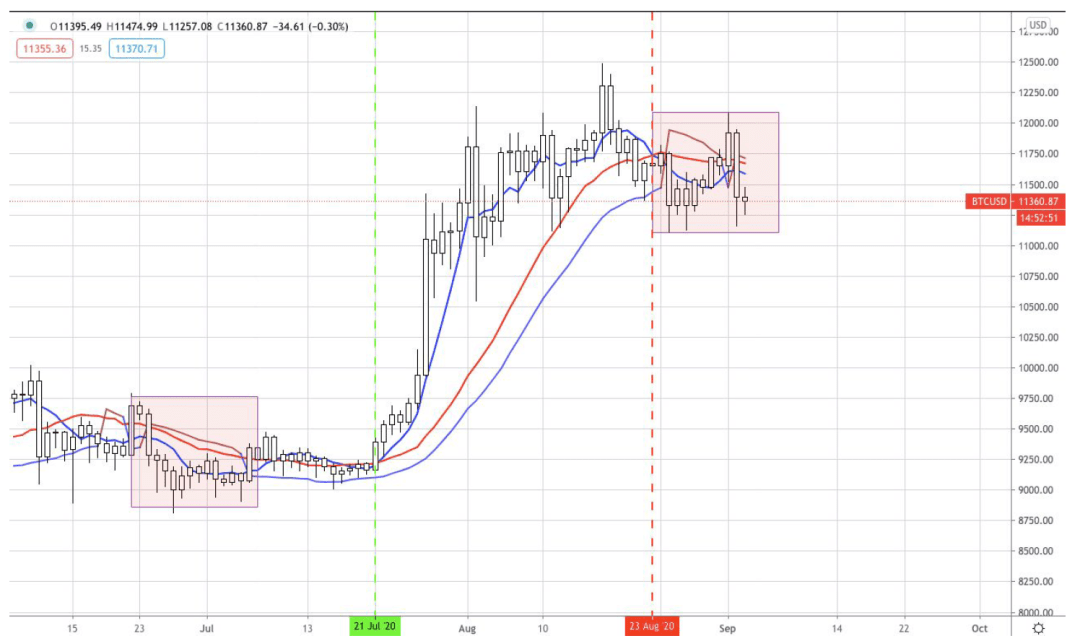
Indicators set three – Gann HL, 6&20 day SMA
Gann HL - Gann HL is currently bearish. This is due to Gann HL being below the candlestick.
BTC/USD Indicators table
Summary table of price indicators
Index Analysis Summary
As seen above, the overall BTC indicator analysis is clearly bearish. Therefore, this is bad news for the $11,300 support level and could see BTC lose a lot of its recent gains.
BTC Analysis Summary
SUSHI
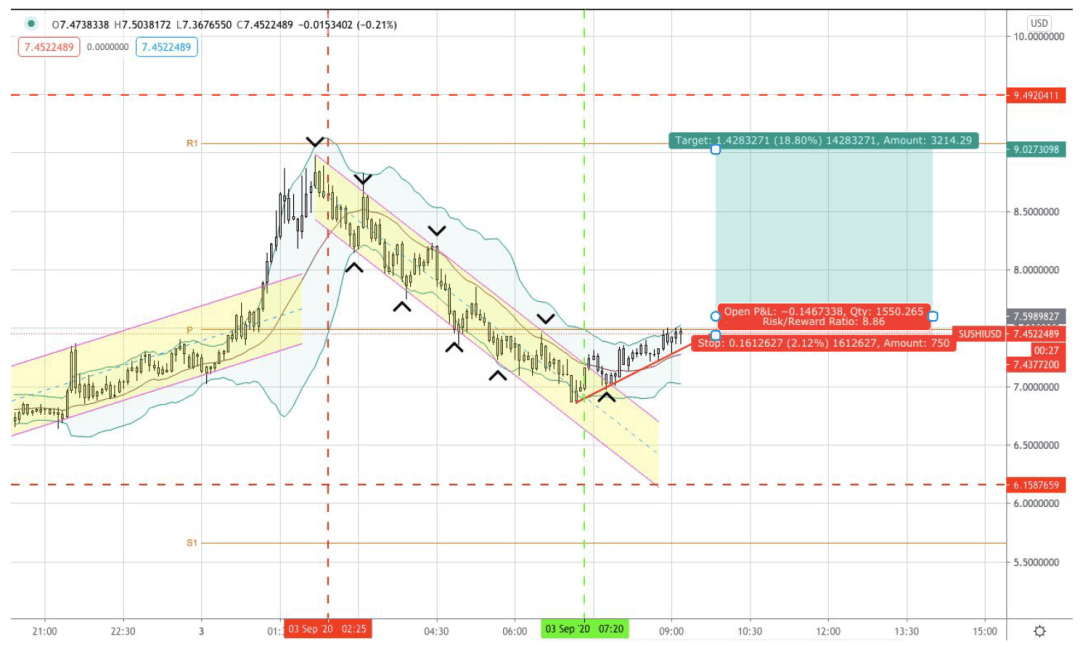
SUSHI/USD
BTC is going bearish. BTC’s reaction to bearish indicators will affect its performance for the rest of the year. If BTC can hold the $11,300 support level until the indicators turn bullish, then we should see BTC reach all-time highs again before the end of the year. However, if BTC fails to hold this level, then we are likely to see BTC fall all the way back to $10,500 or even $10,000 in the next few weeks.
SUSHI is one of the latest and hottest DeFi coins recently. Technical analysis shows that a potential breakout may be imminent. SUSHI has broken out of the nearest descending parallel channel and has seen the Bollinger Bands moving average as support as it attempts to break above.
LTC
If SUSHI can break through the central PP, it will undoubtedly be bullish. However, we will need to wait for this breakout to occur in order to manage risk levels. If SUSHI does not break out of the center PP, then we will likely see SUSHI reach $6.1 and possibly even $5.7 - S1 point. Whether SUSHI can break through this level is likely to depend on the trend of BTC.
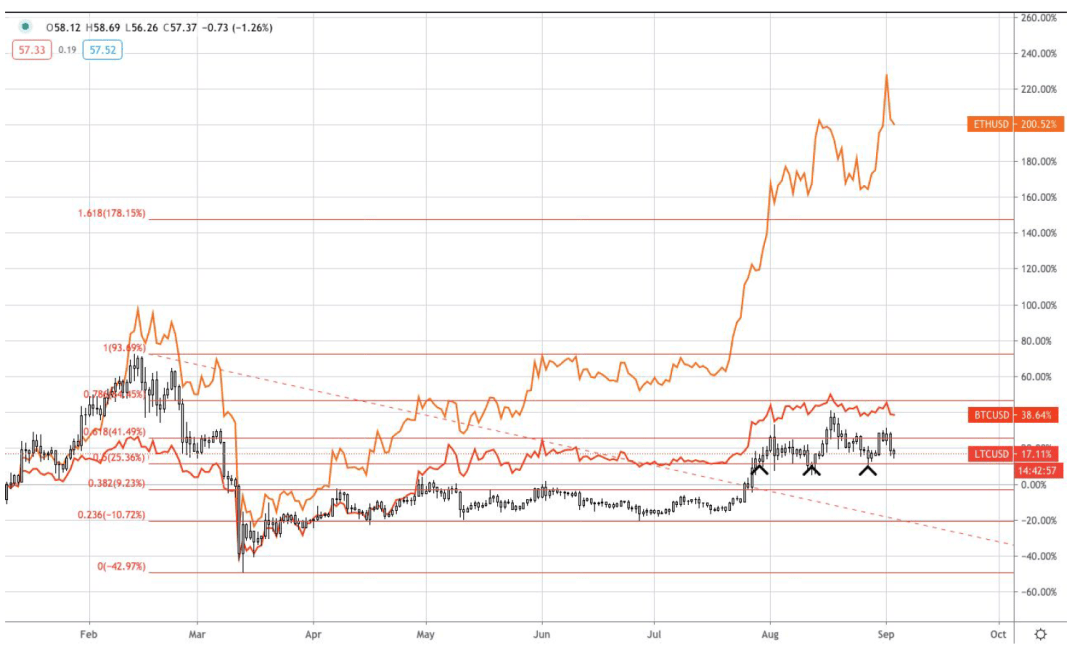
LTC/USD BTC and ETH comparison.
Since the crash in March, LTC has been one of the worst-performing mainstream cryptocurrencies, as you can see in the chart below compared to BTC and ETH.
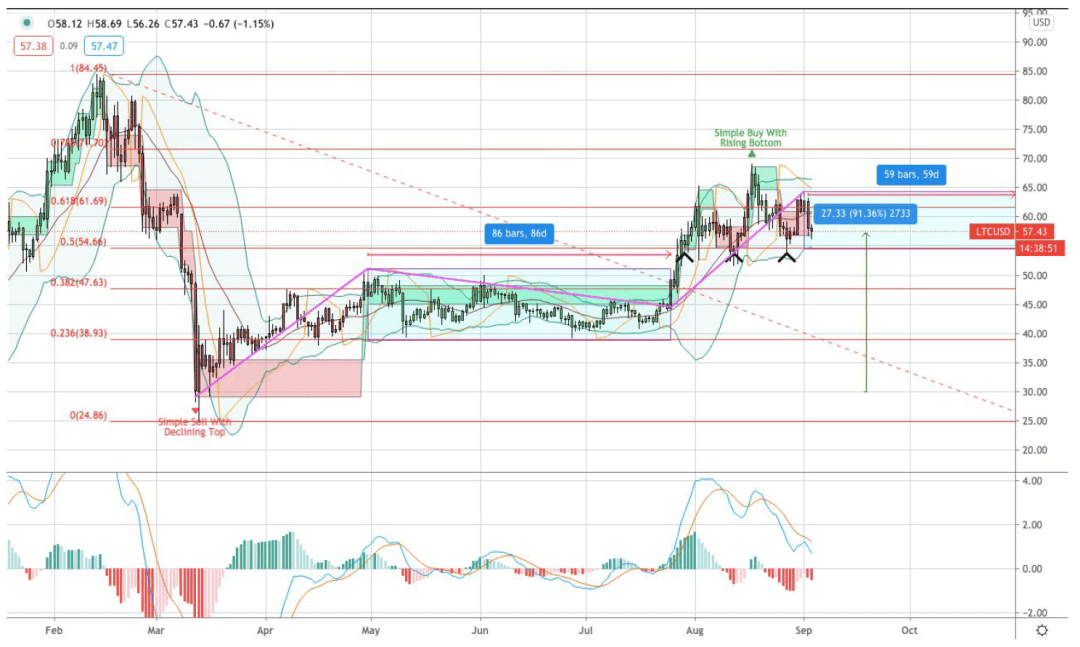
LTC/USD
Unfortunately, the indicators and patterns exhibited by LTC suggest that this trend will continue. Currently there are many bearish indicators for LTC and it is only supported by the 0.5 Fibonacci support level as shown in the chart below.
NEO
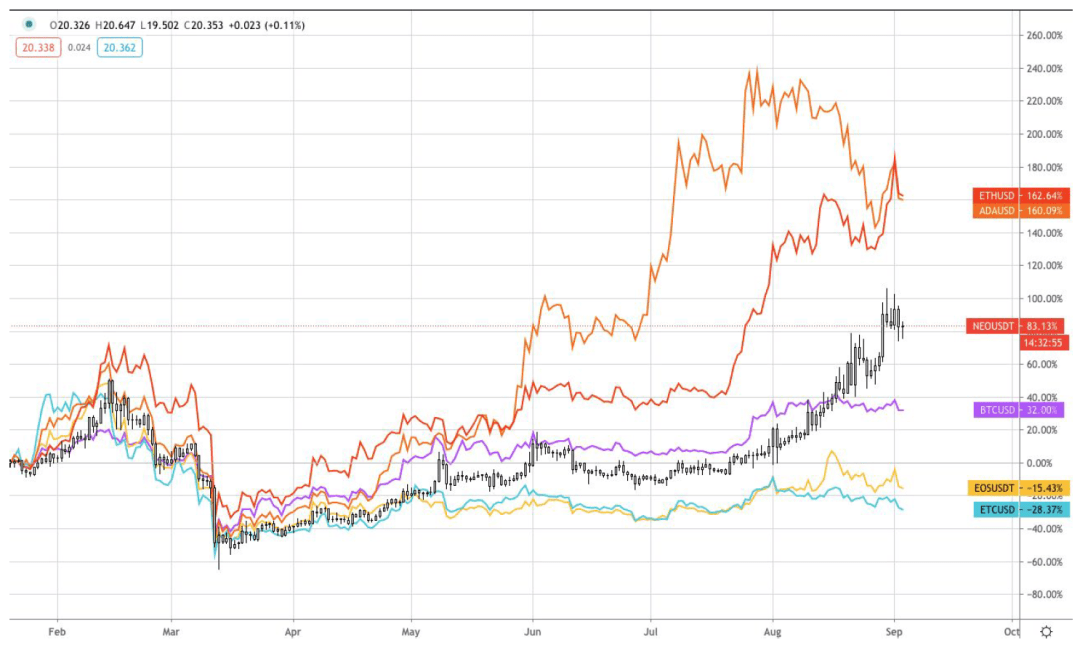
NEO vs ETH/ETC/EOS/ADA/BTC
The current chart, like BTC, suggests that a price drop or sideways trading will occur. In this chart, PnF is bearish along with the MACD, while the Bollinger Bands are waiting for a breakout in either direction to occur before giving any indication.
NEO has been very strong lately, rising 80% from $12 to $20 in the span of a month! There are some doubts if this will continue though, and it will depend on NEO being able to use the Bollinger Band 20 Moving average support line.
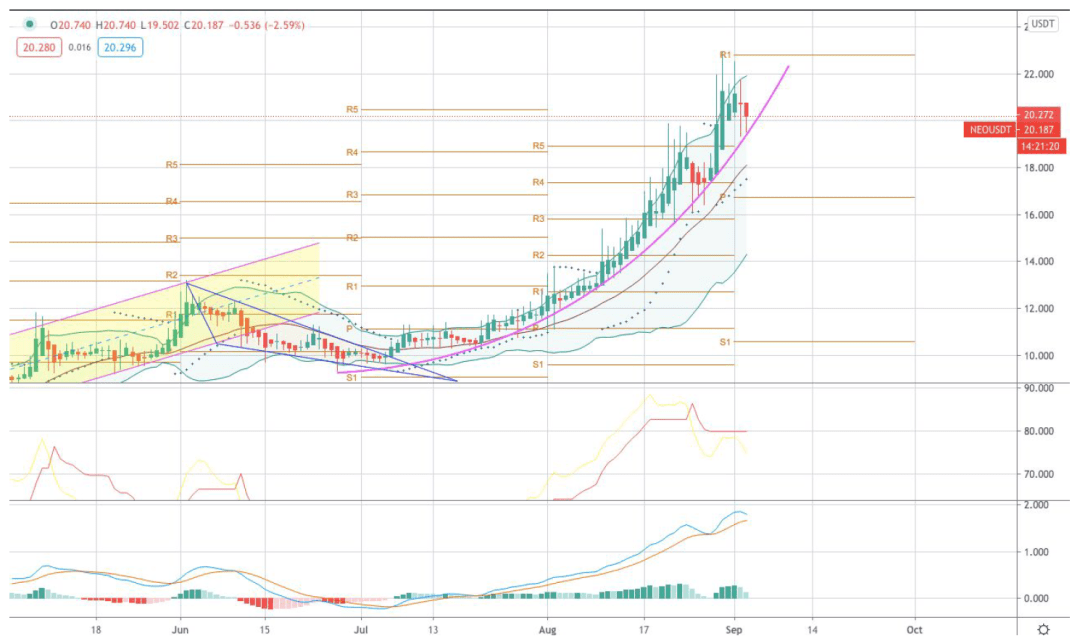
NEO/USD chart TA
LEND
Indicators are currently bullish. The SAR indicator is lower than the K line, the K line is located in the upper area of the Bollinger Bands, and the MACD is currently positive. Heikin Ashi is red though. If NEO can make a quick pass, and switch back to green, then expect NEO to hit $23. However, if not, the bearish QQE MT4 takes over, then NEO will likely hit $19. If that happens, then unfortunately $13 is a very realistic target after $19.
LEND has been one of the best-performing cryptocurrencies of 2020, however, it seems unlikely that this will continue. Seeing a cryptocurrency go up 16,000% over the course of a year reminds us that this market clearly still has potential, and that the 2017 pump was not a one-off. However, when a cryptocurrency has risen so much in a year, a certain degree of shock is also expected to be followed by a pullback.
LEND is currently exhibiting a bearish descending triangle pattern due to a candle below the triangle with a black candle. LEND has currently reached the resistance level of $0.64. If it falls below this level, LEND is expected to touch $0.53. If LEND stays above and BTC does not fall below $11,300, LEND may re-touch $0.74 in the next few days.
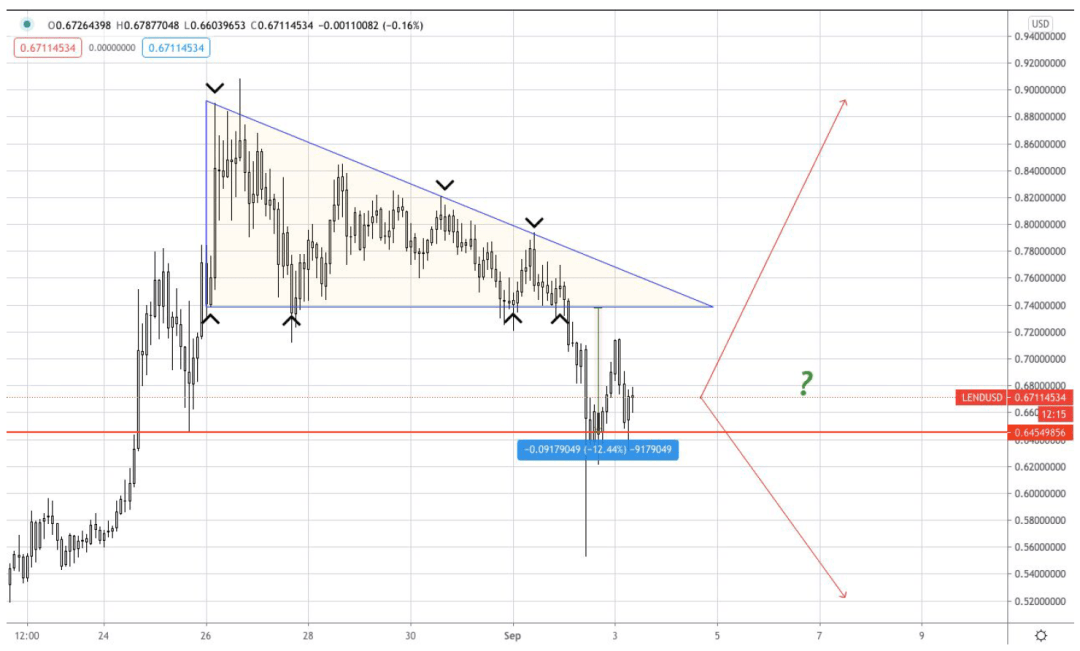
LEND/USD
EOS
$0.53 seems the most likely due to the bearish formation and a series of bearish indicators for the recent downside.
Compared to other cryptocurrencies, EOS has performed very poorly since March.
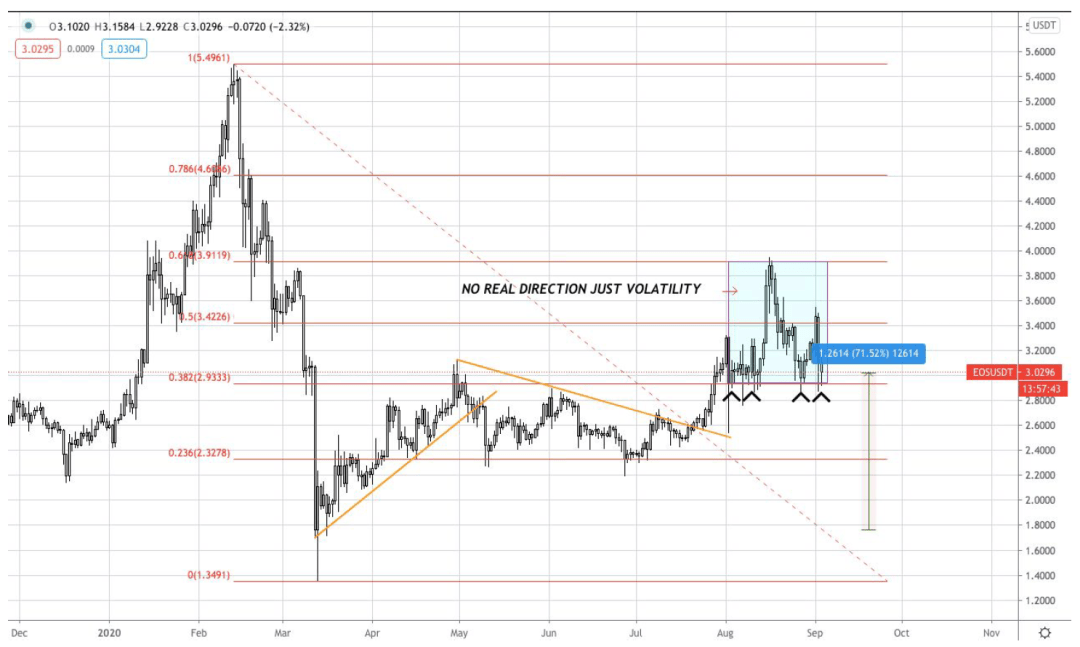
EOS/USD lack of direction
Lately, EOS has been looking a bit out of place on the charts, with a lot of volatility but no real direction. EOS failed to sustain gains above the 0.5 Fibonacci retracement level. This means that the price increase since March was likely part of a corrective wave rather than impulsive.
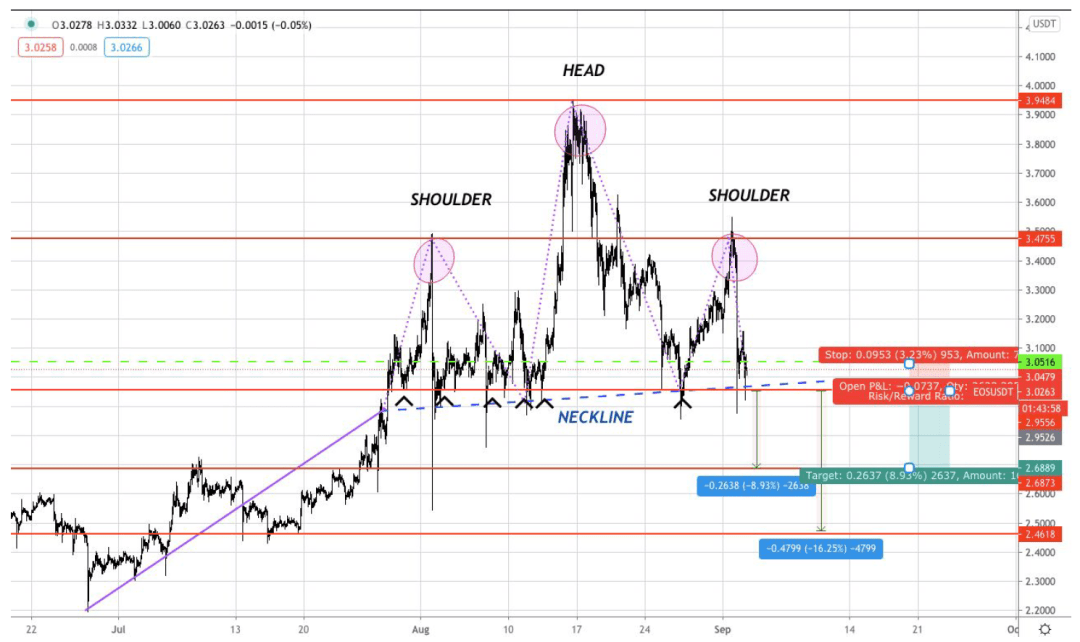
EOS/USD
XRP
Out of all the alt coins XRP is looking like one of the more promising options.
However, judging by the recent volatility, a really large underlying short position has built up. This has seen a head and shoulders pattern form. We are currently fast approaching the neckline. If the neckline breaks, then a drop towards $2.6 and then $2.4 is likely. A drop towards $2.4 would cause us to lose 16% from the current price.
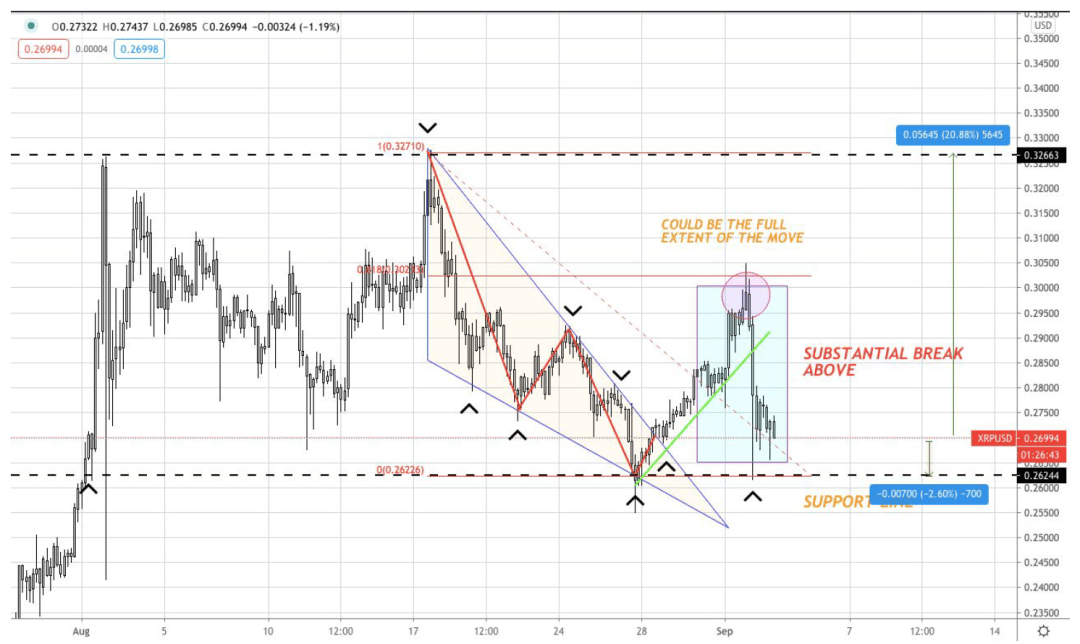
Many altcoins have been bearish in the near term, including XRP, although it appears to be one of the better performers. XRP has recently broken above the recently created descending triangle. If XRP can hold above the $0.26 support level, then XRP will also try to push the $0.30 resistance level again.
However, the MACD for XRP is bearish as seen in the chart below. Beyond that, the QQE MT4 and SAR are bearish, all of which pose a threat to XRP’s ability to hold above $0.26.
XRP has support at $0.245, and while XRP is one of the more established cryptocurrencies, this support has more historical correlation, which is why should a potential sell-off occur, XRP should be one of the better-performing cryptocurrencies.
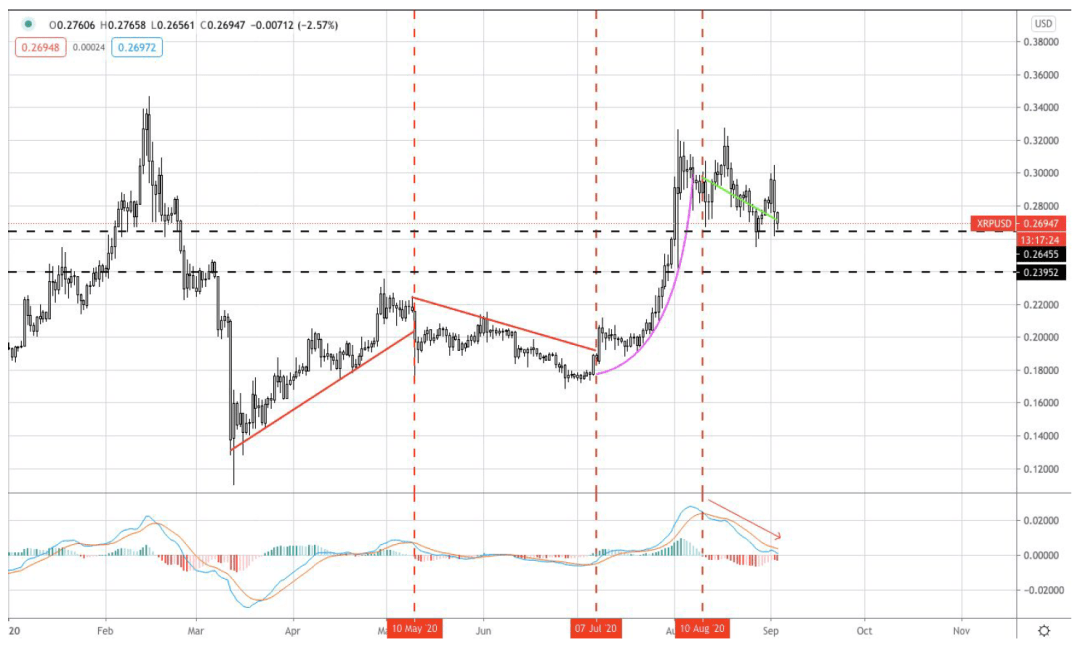
XRP/USD
QTUM
A drop towards $0.245 would represent an 8.5% loss from our current price.
QTUM has performed very well since March, however as demonstrated below QTUM's bullish trend has come to an end. The recent trumpet pattern has been broken and the coin is also supported by the lower half of the Bollinger Bands.
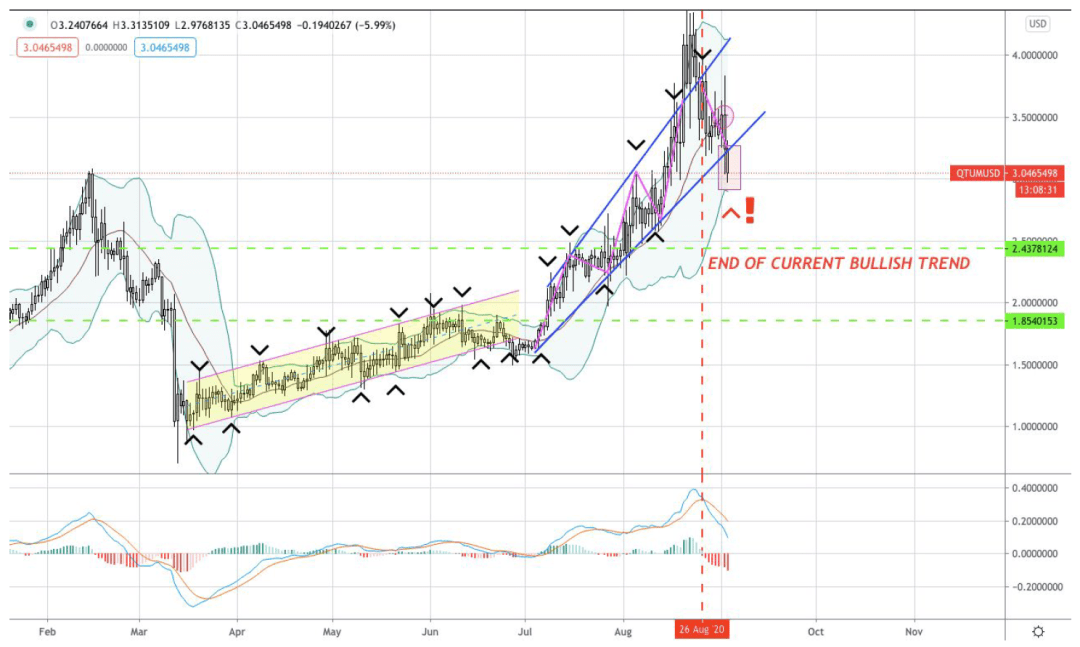
QTUM/USD daily chart TA
ETH
The QTUM indicator is currently bearish and the MACD for QTUM is super bearish, further declines seem highly likely.
The last cryptocurrency we will look at is ETH.
About AAX Academy
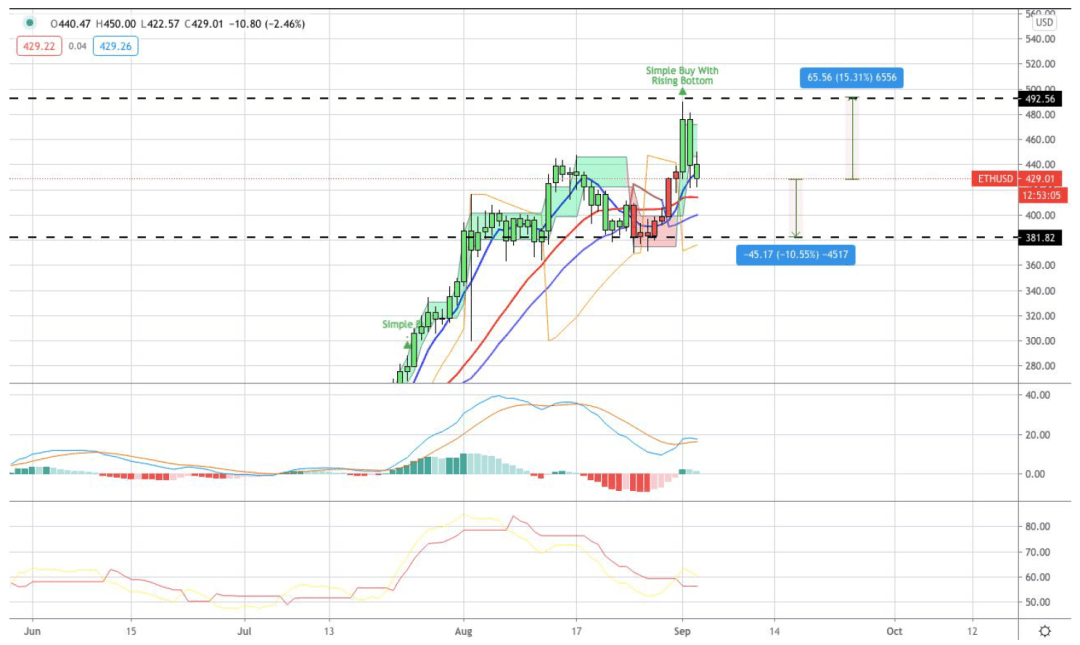
ETH/USD TA
*This research report is for marketing and educational purposes only. Opinions, analyzes and forecasts are based on independent research and do not constitute investment advice.
About AAX Academy
AAX is a digital asset exchange powered by LSEG Technology. AAX Academy is a user education channel created by AAX, which aims to help more users learn novice tutorials and understand the basics of blockchain.





