OKEx Investment Research: The bullish sentiment is still high, small adjustments cannot change the general trend


BTC/USDT Perpetual Contract
The nature of each level: daily line - rising, 4 hours - consolidation, 1 hour - rising
secondary title
BTC/USDT Perpetual Contract
The nature of each level: daily line - rising, 4 hours - consolidation, 1 hour - rising
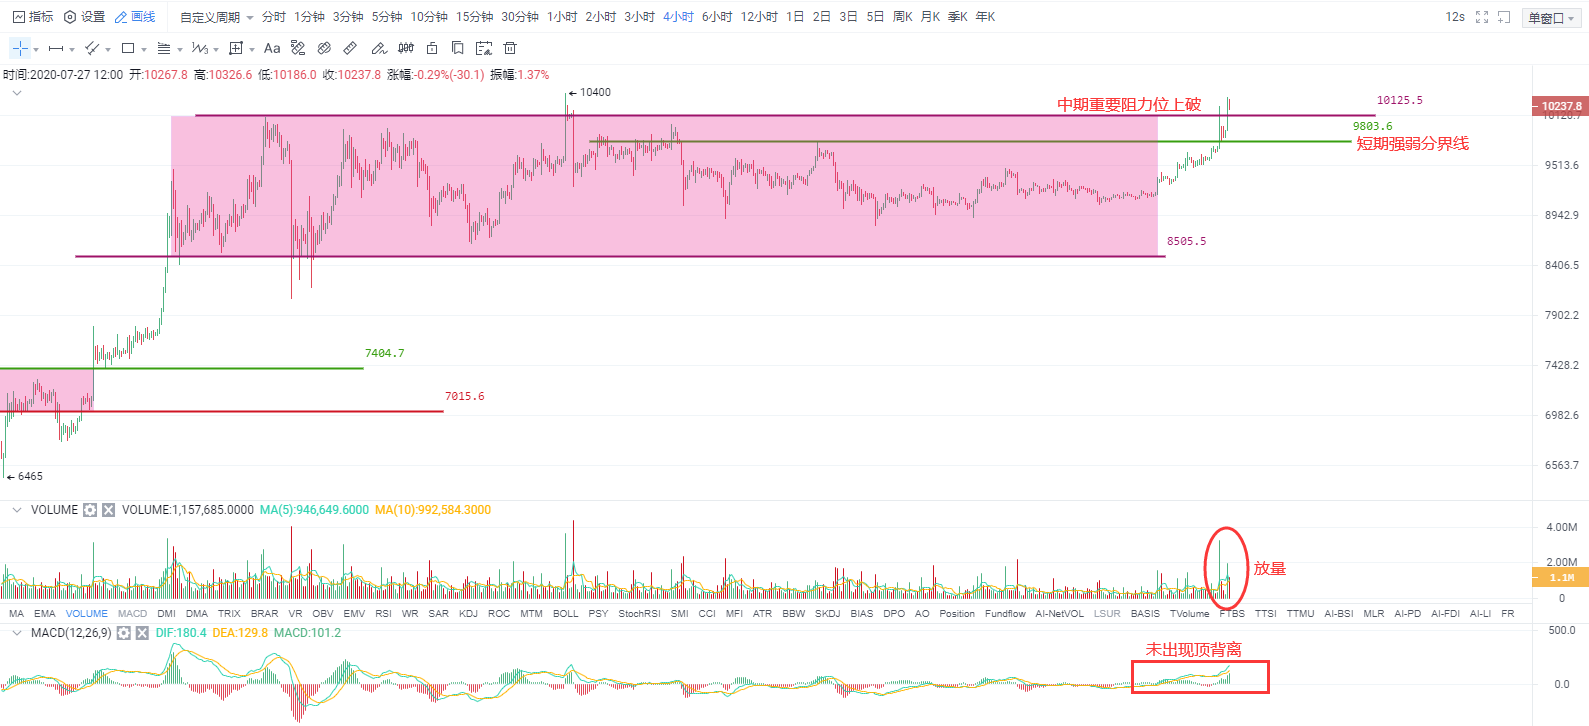
The screenshot is from the 4-hour chart of the OKEX BTC/USDT perpetual contract: For the market, there are two perspectives, one is the objective trend status and the coping strategies formulated according to the objective trend, and the other is the subjective prediction based on experience. Actual trading is mainly based on coping strategies under objective trends. Subjective forecasting is more of a prospect or entertainment for future development. It cannot be used directly as a trading strategy. The main purpose is to prepare psychologically for potential risks and opportunities in advance .
The current objective trend and coping strategies: It is obvious that the market has risen like a rainbow in recent days. Bitcoin has once again reached the 10,000 mark after nearly two months. A new high for the year. Although it is said that interpretation of the past is an afterthought (however, our recent views on the market are actually all behind the scenes, and the direction is clearly bullish, but the rise is stronger than expected), but it is still necessary to do a review. We need to know what is the logic behind the rise, so that we can better grasp the market when such situations reappear in the future.
Well, that’s all for the content of the replay, what I said may not be right, it’s just for reference. Now let's get down to business and look at the present, and which positions we should pay attention to in the future market. Judging from the current trend structure, the mid-to-short-term trend is still clearly in a bullish pattern, temporarily breaking through the upper resistance of the consolidation range (8500-10100) formed in the past three months, and from the 4-hour and 1-hour levels There is no top divergence phenomenon, indicating that the upward momentum has not weakened significantly. At the same time, the volume-price coordination is also relatively healthy. When it rises, the volume increases significantly, and when it falls, the trading volume shrinks. Last Friday's evening review also specifically emphasized this performance of bulls dominating.
resistance and support
Judging from the above phenomena, the probability of the currency price continuing to rise in the market outlook is greater than the probability of turning downward. However, due to the large absolute increase in the short term, the price is approaching the high point in February (10544), and there is a need for adjustment in the short term. However, as long as the adjustment does not break through 9800, it can be regarded as a benign adjustment without excessive interpretation. In other words, as long as there is an adjustment in the market and a stop signal appears above 9800 (such as a moderate increase in volume after a pullback, a downward pin appears in the 1-hour chart, etc.), it will still be treated as a buying opportunity.
Support: 10000--9800--9450
ETH/USDT Perpetual Contract
The nature of each level: daily line - rising, 4 hours - rising, 1 hour - rising
secondary title
ETH/USDT Perpetual Contract
The nature of each level: daily line - rising, 4 hours - rising, 1 hour - rising
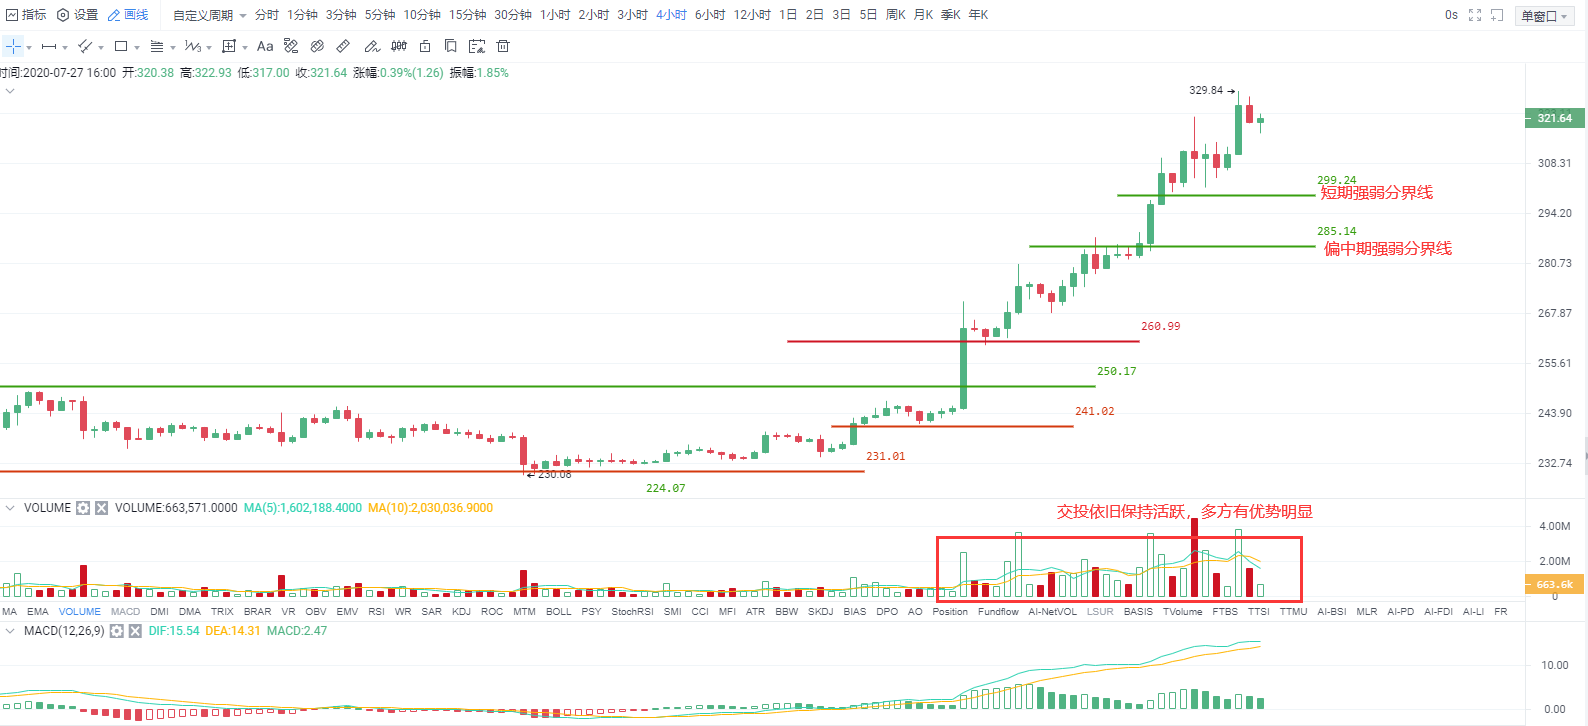
The current trend is still strong, and the volume-price coordination is very healthy recently. Most of the time, the price has been increasing and the volume has been increasing, and the price has been falling. It was followed by an example of a decline, which shows that the bulls are still strong in undertaking power. It is recommended to refer to the 299 first-line support in the next short term, and regard this support as the short-term strength and weakness dividing line. As long as the adjustment trend does not break through this price, the short-term trend is still a strong pattern. Investors who focus on mid-term operations can focus on 285, and temporarily regard the sub-price as the dividing line between strength and weakness in the mid-term.
resistance and support
ETH is the market leader in this round, and the upward trend is good. It is not easy to talk about the top, and it is mainly to do long after it falls back and stabilizes, and it is not easy to short.
Support: 310--299--285
EOS/USDT Perpetual Contract
The nature of each level: daily line - down, 4 hours - up, 1 hour - up
secondary title
EOS/USDT Perpetual Contract
The nature of each level: daily line - down, 4 hours - up, 1 hour - up
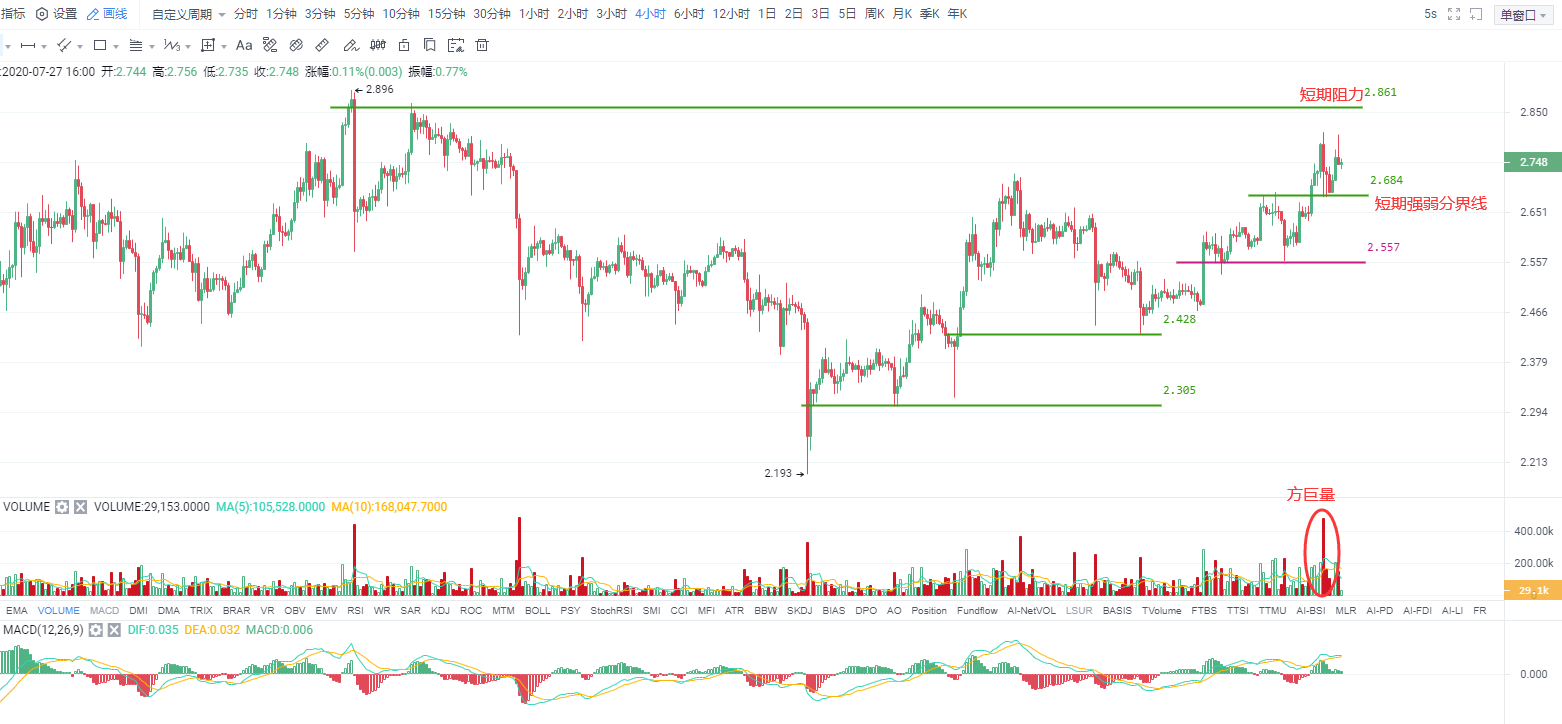
As shown in the figure, the current short-to-medium-term trend is on the bullish side, and the positions circled in the figure have not caused the price to continue to fall, which shows that the strength of multi-party commitment is acceptable. It is recommended to focus on the low point of this huge K-line -2.68 line, and regard this price as the short-term strength and weakness dividing line, and continue to be cautiously bullish before it falls below. For such weaker currencies, you must not chase the rise when you are long, only consider buying low when the callback is close to the key support level, and set a strict stop loss at the same time.
resistance and support
The upper resistance line focuses on the 2.86 line. If the currency price shows obvious stagflation when it is close to this price, you can consider playing short-term empty orders. If it does not appear, don’t blindly sell short. After all, the overall bullish atmosphere in the current market is still strong.
Subjective expectations (for entertainment only): It is estimated that the currency price is expected to continue to rise in the short term, but it is still difficult to see a sustained rise like BTC and ETH, or a stagflation and fall in the 2.86-2.9 area. This paragraph is not intended as a trading strategy reference.
resistance and support