Breaking down to no avail, can it go up in the later stage?


market analysis
market analysis
Today, Bitcoin opened higher and lowered, fluctuating all the way down, but the lower support at 9080 has not been effectively broken, and then the market touched the support and rebounded at 9140, and then went down to touch the 9080 position. Overall, it was in a range shock, four hours Looking at it, the market has always been in the middle of the Bollinger Bands, but they are all in the middle and lower. From the current point of view, the market is on the upper edge of the second trial. If it can effectively rise, there is a high probability that it will rise in the later stage, and the four-hour energy will gradually shrink. But Fangyang has not changed much, and we need to pay attention to this position in the later stage. The one-hour Bollinger Bands shrink and rise, and have been supported by the 60-moving average. In 30 minutes, the market is in a state of wanting to cross the golden cross. If the golden cross can be successfully crossed, there is a high probability that the market may rise in the later period. And in terms of shape, there are rudimentary head-shoulders bottoms in 30 minutes and one hour. If they can continue to form, after the shocks in the later stage are complete, there will be a wave of pullback.
If the market breaks through 9200, you can't step down and enter the market with more orders, stop loss at 9140, and take profit around 9300. If you can break through 9300, then look at around 9400.
If the market breaks 9080, it will not be able to pull back, so enter the market with an empty order, stop loss at 9150, take profit around 8950, and look at around 8000 for a break.
BCH opened in a narrow range in the early morning and formed a double-top pattern, and then the market fluctuated downward. At present, it hit the lower support near 218 and began to rebound upward. After a wave of large declines on the 20th, the BCH volume is now very small, and the market needs to make up for this in the later period. The gap, all need to pay attention to the later stage of large-scale upward movement, and the strength may be very strong. Now it hits the middle track of the Bollinger Band in 30 minutes, and the Bollinger Band closed and rose in an hour. It is currently around the middle track in four hours, and failed to reach it twice. Then fell.
The market breaks below 218 and cannot pull back, so enter the market with an empty order, stop loss at 219.40, take profit around 216, and look at around 214 for a break.
The market breaks through 222, and if you can't step back, take advantage of the trend to enter the market with more orders, stop loss at 220.60, take profit around 225, and look at around 230 if you break up.
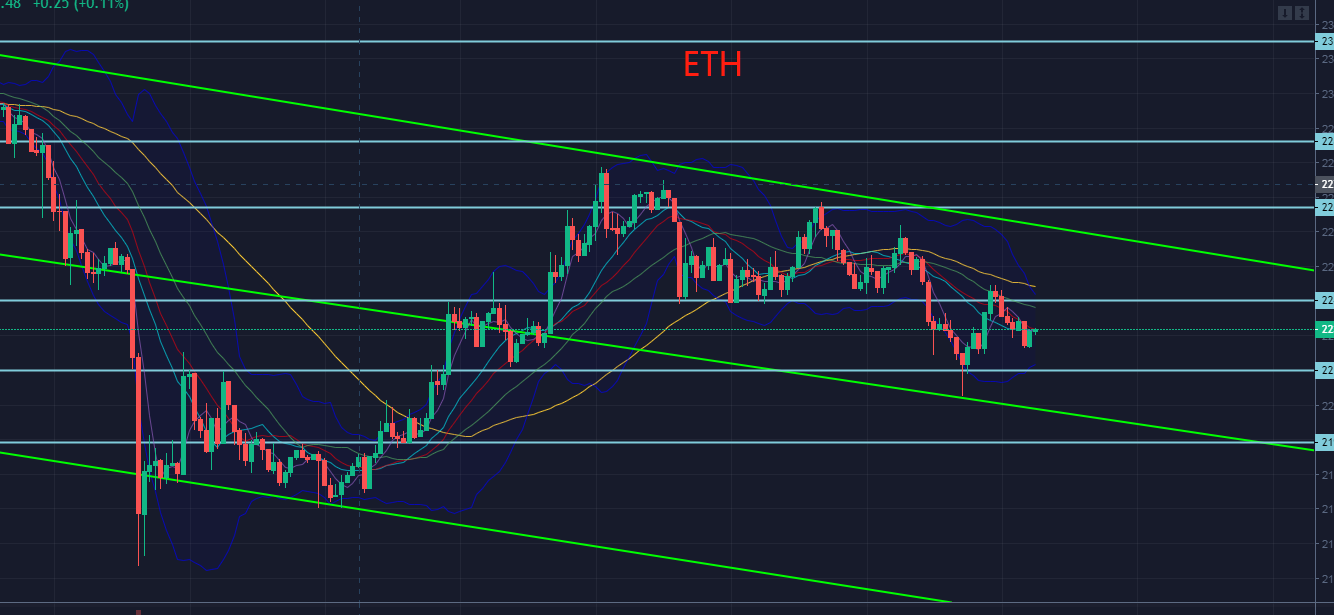
ETH also fluctuated all the way down at the opening. At present, it has been oscillating back and forth in the 15-minute down channel and down. At present, the Bollinger Bands are in an open state in 1 hour, but the strength is not so strong. It is at the bottom of the channel in 30 minutes, and there is a signal that the range has bottomed out. In the later stage, there may be a wave of stretching, and then oscillating for a period of time. Four hours is now a golden cross, and the upper and lower shadow lines are relatively long. The competition between long and short is still relatively strong at this position. The direction has not yet been chosen. If it can break through the pressure level, the market will repair the gap.
If the market breaks through 222, the callback cannot be made, so enter the market with an empty order, stop loss at 223, take profit around 220, and look at around 218 if you break the position.
The market breaks through 224 and cannot be stepped on. Take advantage of the trend to enter the market with more orders, stop loss at 223, and take profit around 225.70.