OKEx investment research: BTC mid-line main contradiction 8550, short-term main contradiction 9700


Disclaimer: The content of this column does not constitute any investment advice, and the content is not prepared for any individual investor's specific investment objectives, financial situation and individual needs. Investors should not only invest according to the contents of this column. Before making any investment decision, investors should consider the characteristics of the product, their own investment objectives, acceptable risk level and other factors, and seek professional advice as appropriate.
The screenshot is from the 4-hour chart of the OKEX Bitcoin quarterly contract: For the market, there are two perspectives, one is the objective trend status and the coping strategies formulated according to the objective trend, and the other is the subjective prediction based on experience. Actual trading is mainly based on coping strategies under objective trends. Subjective forecasting is more of a prospect or entertainment for future development. It cannot be used directly as a trading strategy. The main purpose is to prepare psychologically for potential risks and opportunities in advance .
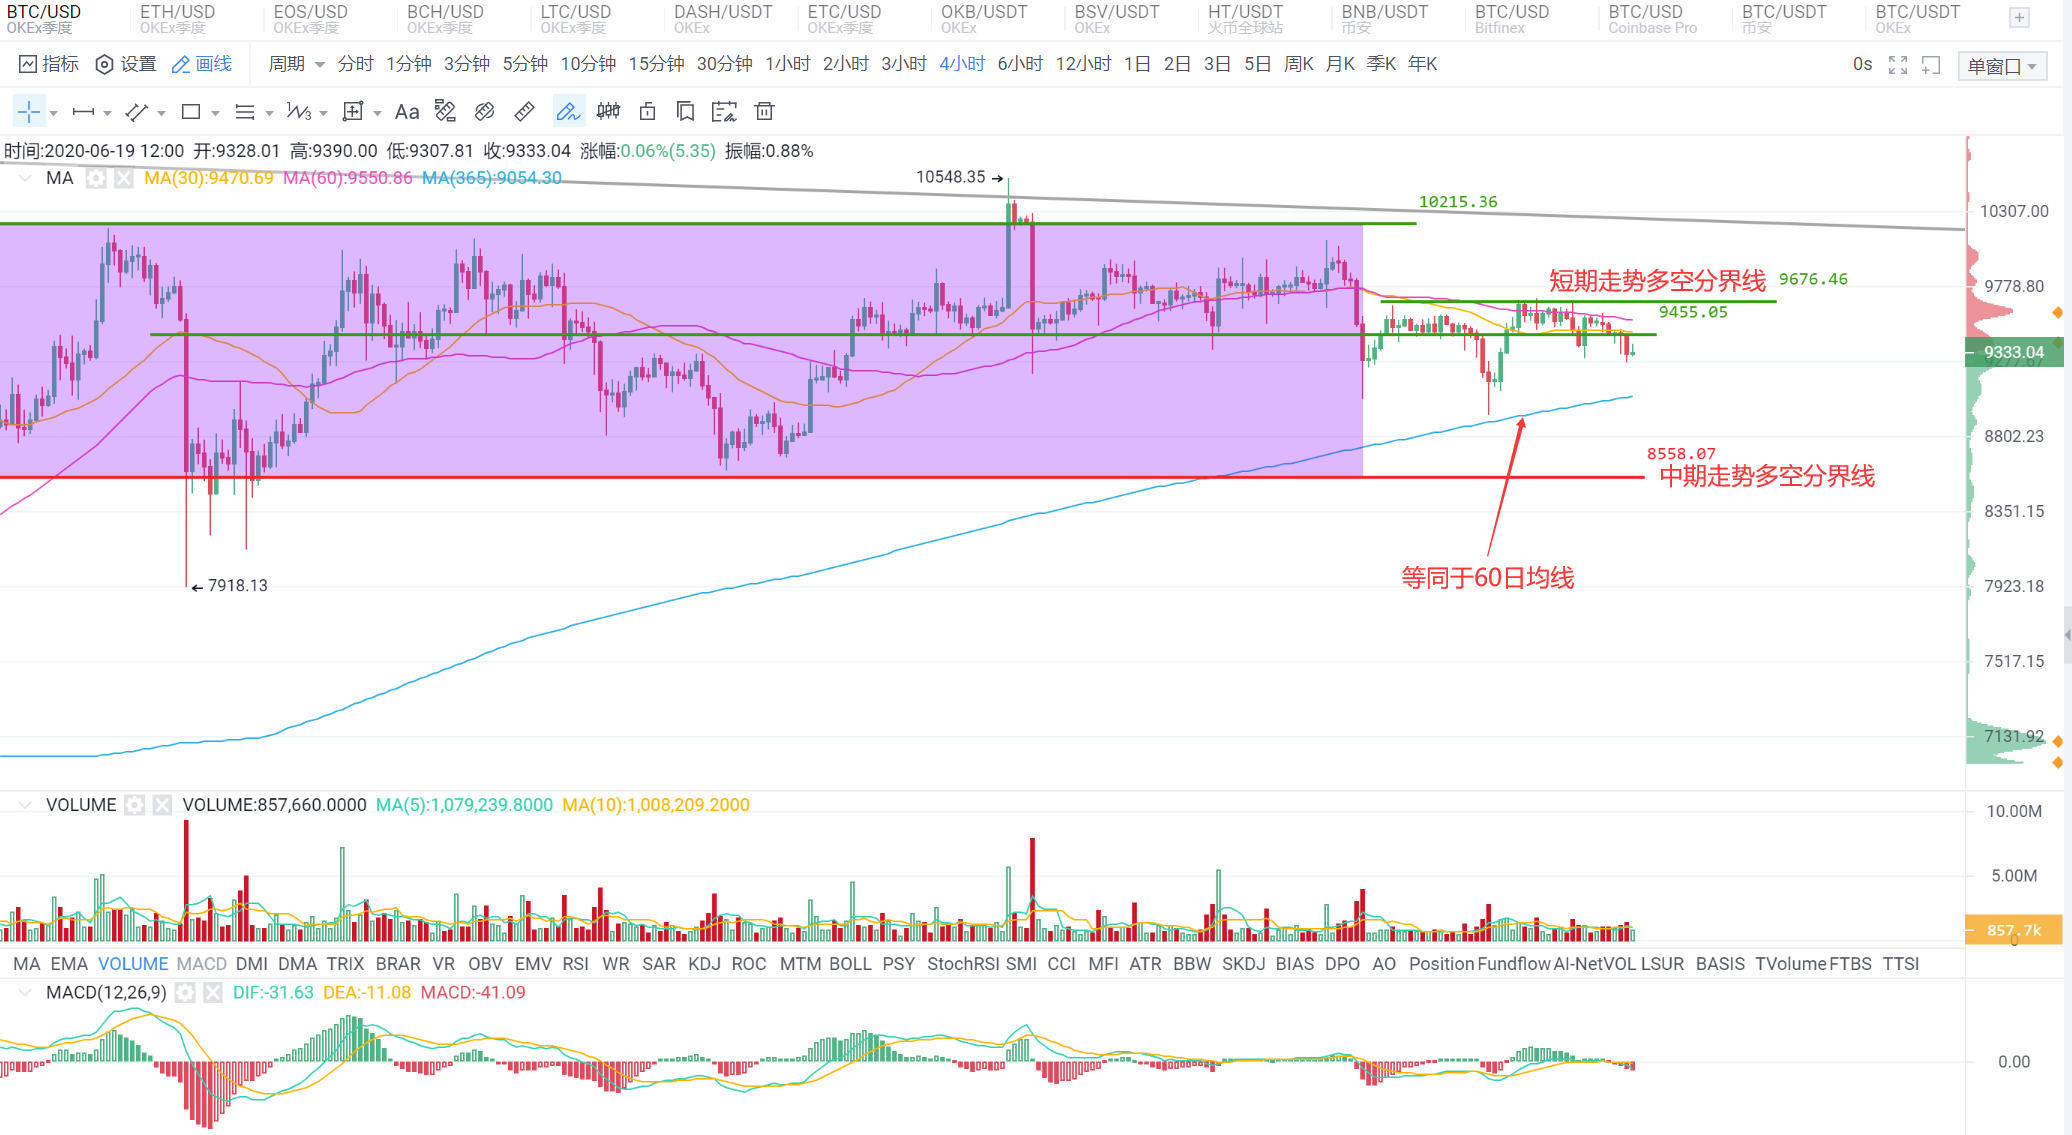
The nature of each level: daily line - consolidation, 4 hours - consolidation, 1 hour - consolidation
The screenshot is from the 4-hour chart of the OKEX Bitcoin quarterly contract: For the market, there are two perspectives, one is the objective trend status and the coping strategies formulated according to the objective trend, and the other is the subjective prediction based on experience. Actual trading is mainly based on coping strategies under objective trends. Subjective forecasting is more of a prospect or entertainment for future development. It cannot be used directly as a trading strategy. The main purpose is to prepare psychologically for potential risks and opportunities in advance .
The current objective trend and coping strategies: As shown in the figure, the trend has once again fallen into a dilemma in recent days, and the operation is still very difficult. Zoom in to see the medium-term trend, because the currency price is above the 8550 line, which has the meaning of long-short boundary line, so the medium-term trend pattern is still bullish. Investors who mainly trade in the mid-term or even long-term should continue to hold positions and wait for growth. . However, since the short-term trend is in a weak pattern, and this situation cannot be reversed for a long time, the position should be appropriately reduced.
Investors who mainly focus on short-term trading focus on the resistance near 9700. This price is regarded as the short-term long-short dividing line. The above should be empty. However, it should be noted that in terms of price patterns, the currency price has not yet left the consolidation range (8550-10200) for nearly a month and a half. In terms of market news, there is a lack of strong news stimulation, so it is difficult to get out of the unilateral market and chase the rise Slump is still the most need to avoid the operation strategy.
For short-term support, it is recommended to pay attention to the 60-day moving average. The current price is around 9150. If you have a short position in your hand, when the currency price is close to the moving average and there are obvious signs of stopping the decline, you can consider taking profit and leaving the market, or backhand the multi-order game. In the event of a rebound in the market, at the same time strictly control the position and set a strict stop loss.
resistance and support
resistance and support
Resistance: 9500--9700--10000
Support: 9100--8600--8150
The nature of each level: daily line - consolidation, 4 hours - consolidation, 1 hour - down
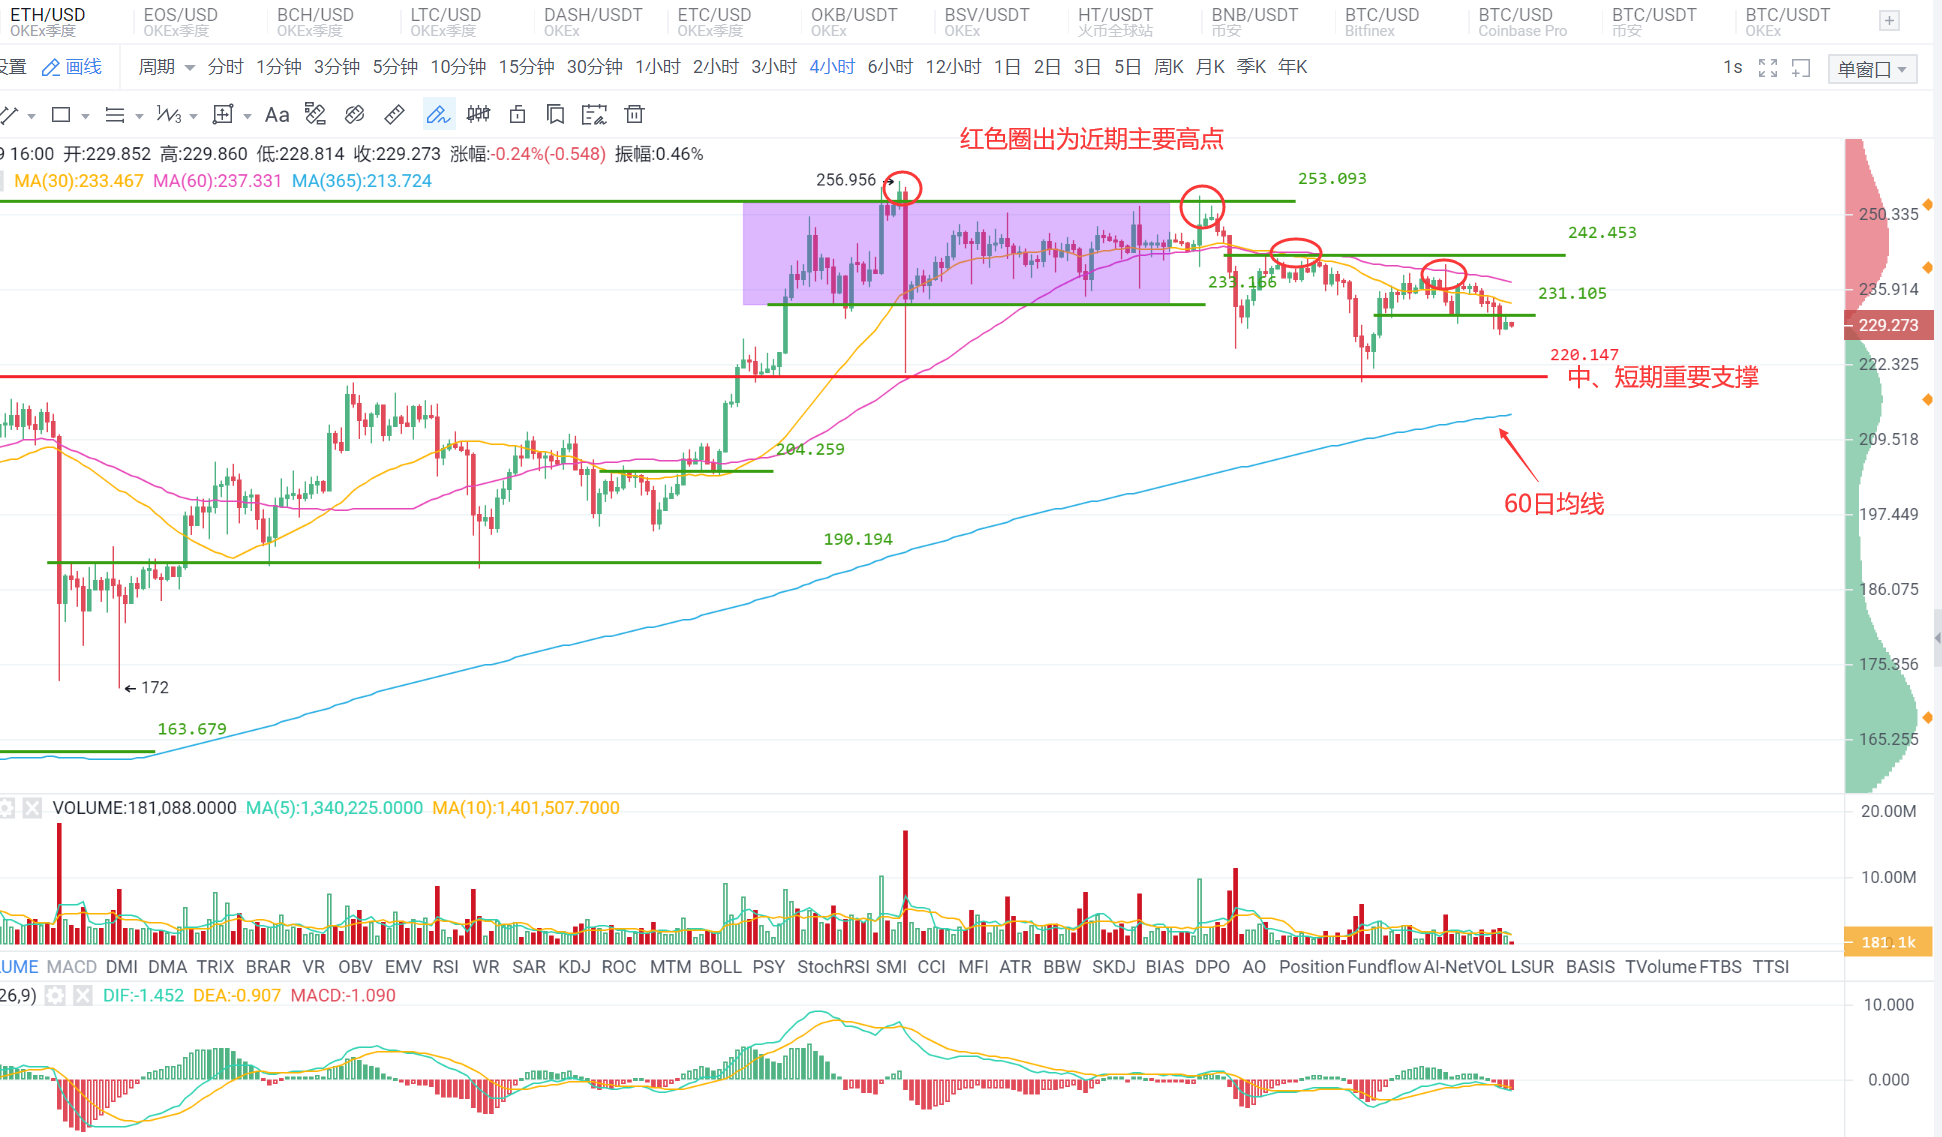
The nature of each level: daily line - consolidation, 4 hours - consolidation, 1 hour - down
The screenshot is from the quarterly 4-hour chart of OKEX Ethereum: the current objective trend and coping strategies: Compared with BTC, the trend of ETH in the past two days is relatively more regular and easier to judge. As shown in the figure, in the decline pattern of the past half month, each major high point has maintained a gradual downward trend, and there has been no false breakthrough of key resistance several times like BTC.
The idea we have been giving in recent days is to focus on the 242 resistance. Before breaking through this resistance, it will be mainly empty. I gave an operation idea yesterday, and I saw such a short-term trading opportunity around 6:00 last night, and the short-selling signal appeared around 235. Of course, this trading method is also based on a certain probability, but the probability of success is relatively high.

At present, the short-term trend of the currency price is still in a downward trend, and the momentum of active decline is not strong. If the weak situation continues, it will probably still fluctuate slowly downward, and it is difficult to experience a sharp decline. It is recommended to focus on the 239 line for resistance in the next two days. It is best to only consider the low-buying opportunities near the key support level before going long before breaking through this price, rather than chasing up. Support focuses on the angle between 220 and the 60-day moving average (213-220 range). If the currency price gives an opportunity in this range, and there is a long shadow on the 1-hour chart, after a combination of bullish engulfment and other stop-falling K-lines, you can consider Do long-single games, and at the same time pay attention to position control and strictly do a good job in risk control.
resistance and support
resistance and support
Resistance: 235--239--242
Support: 225--220--215
The nature of each level: daily line - down, 4 hours - consolidation, 1 hour - down
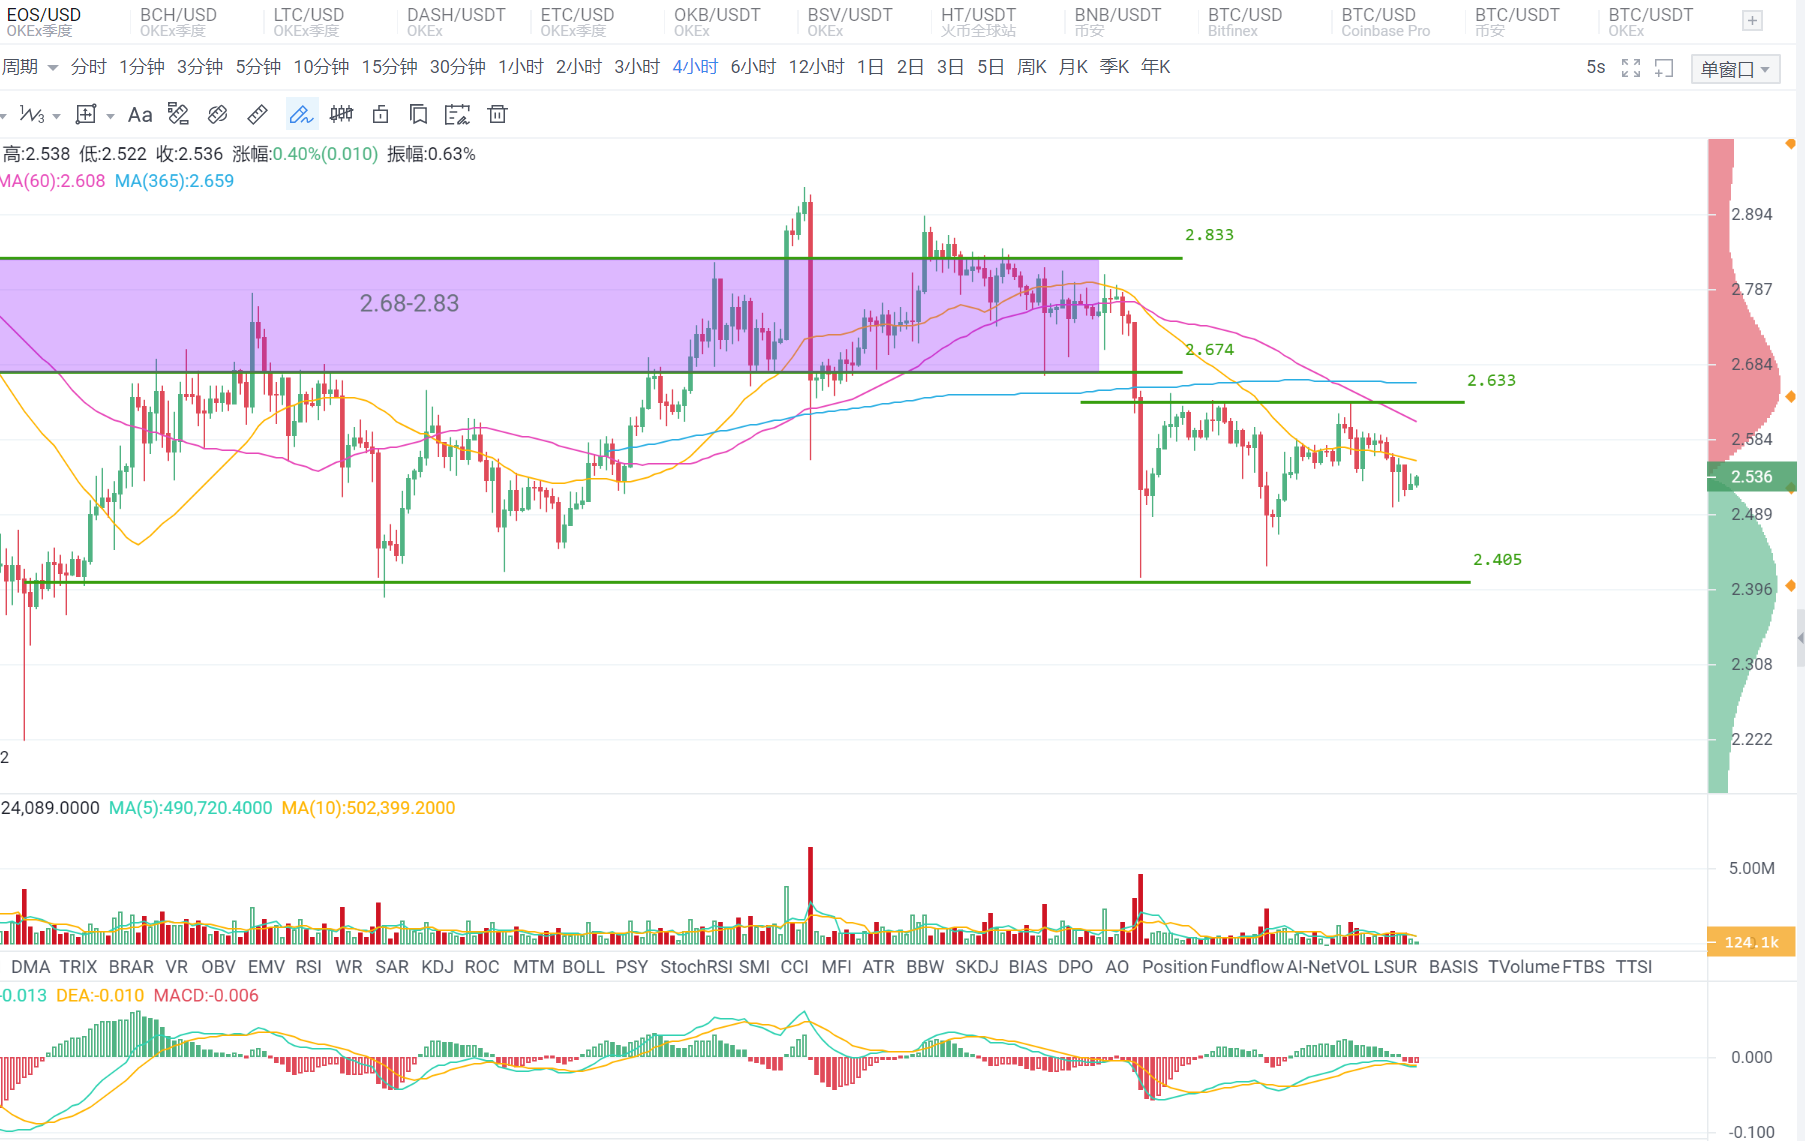
The nature of each level: daily line - down, 4 hours - consolidation, 1 hour - down
The screenshot is from the OKEX EOS quarterly 4-hour chart: the current objective trend and coping strategies: EOS also continues to be in a weak situation, but judging from the volume-price coordination (falling without heavy volume) and the short kinetic energy represented by the red histogram of the MACD indicator, The active downward momentum is limited, so it is difficult to have a sharp decline in the market, and continued shocks may still be the main rhythm.
In the next two days, we will focus on the 2.4-2.63 range. In terms of operation, we will focus on selling high and buying low near the upper and lower edges of the range, and avoid chasing ups and downs.
resistance and support
resistance and support
Resistance: 2.58--2.63--2.68
Support: 2.48--2.40--2.25