BTC long counterattack encounters suppression


【Market review】
【Market review】
【Market analysis】
【Market analysis】
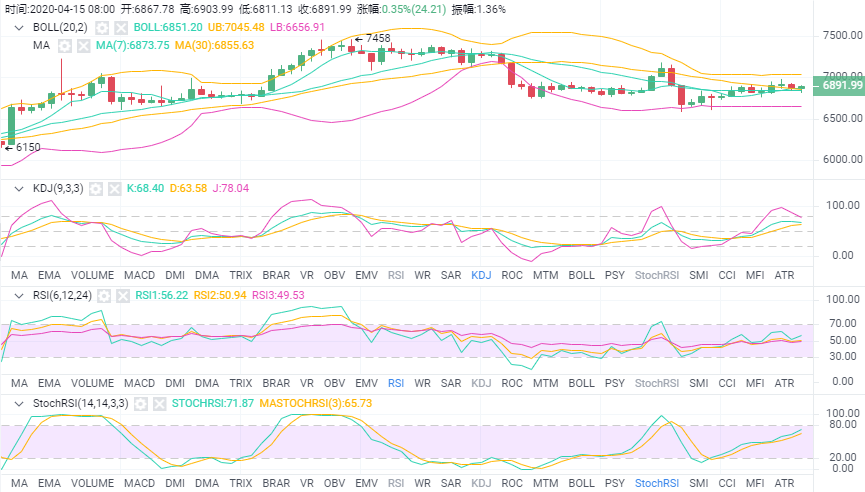
BTC:In the four-hour level chart, the opening of the Bollinger Bands is flat, and the market is running near the upper middle rail of the Bollinger Bands, and is now at 6864; the five-day moving average and the ten-day moving average are running smoothly, and the currency price is constantly approaching it, and there are attempts to break it completely ; In the attached picture, the MACD fast-slow line runs near the zero axis, presenting a golden cross state; RSI and Stoch both maintain a gentle posture; it can be seen that the short-term market should be dominated by shocks, but attention should be paid to the effective support below , Once the position is broken, it will be empty. In terms of operation, it is recommended to be high-altitude, short around 6900, take profit at 6750 and stop loss at 7020.
 ETH:Looking at the hourly line, there is support near the lower line of the upward channel, and in line with the shape of technical indicators, the price fell back in the early morning and the market rebounded in the morning. The two fast and slow lines of MACD are above the 0 axis, and the green column is shortened; the third line of KDJ, the oversold area of J line turns upward, and the third line is about to form a golden cross. In the early trading, it fell to test around the 155 line, and the market's mid-yang line reversed around the mid-track line. In terms of operation, it is recommended to short around 160, with a stop profit of 156 and a stop loss of 163.
Points are time-sensitive, and I will give specific operation points in real positions. The market fluctuates rapidly, and opportunities are caught by ourselves, not by waiting. My analysis is just to give a trading idea. I want to For more real-time and specific market trends and precise points, you can follow me so that you have greater confidence to make long-short choices in the follow-up market.