OKEX Investment Research: The classic drama of Jincha smashing the market is staged again in the early morning, looking back at the similar trend in history


Written by: OKEx analyst Yan Song
image description
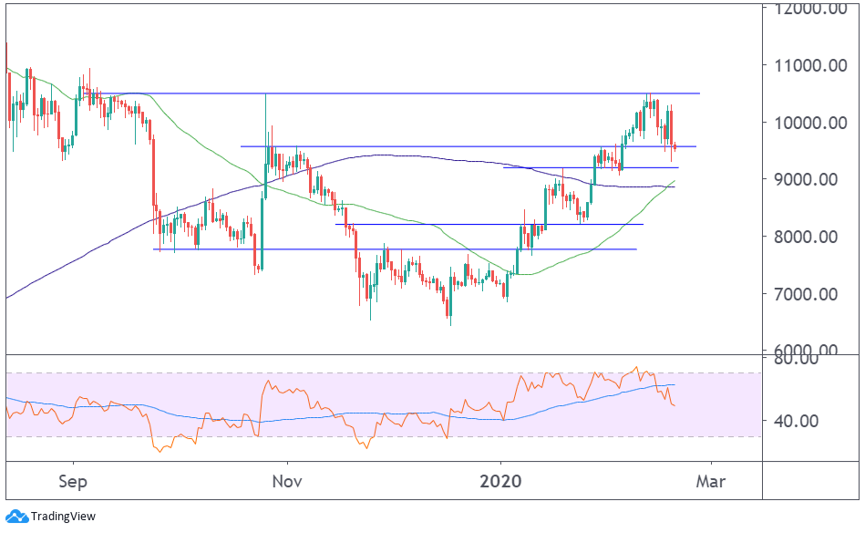
Figure 1: OKEX BTC Index Price Daily Chart vs MA 50,200 (Green/Purple) vs 14-day RSI - Tradingview
OKEX Investment Research released the "weekly market watch"The article also mentioned that "Bitcoin's daily line forms a bullish golden cross, but historical data does not support direct stud." Because after carefully observing the currency price trend after the formation of the same golden cross three times before, although the sample is limited, the similarities are worthy of our vigilance for the sharp correction of the currency price.
image description
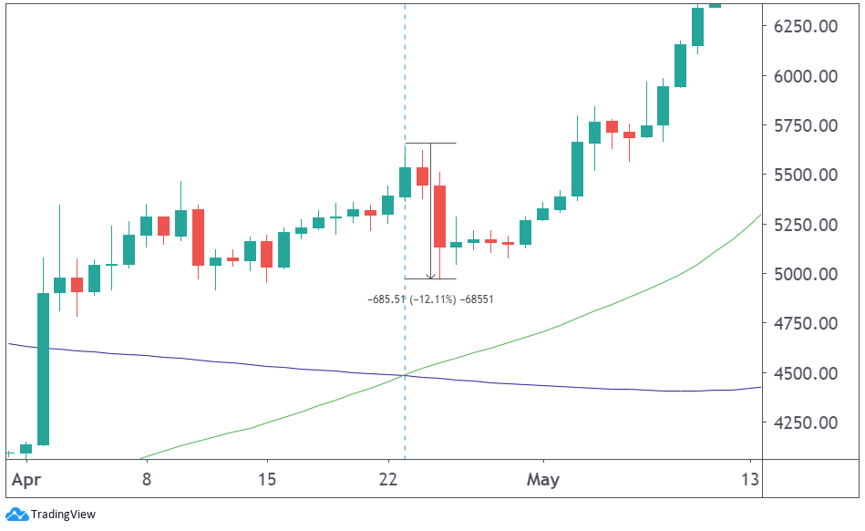
Figure 2: BTC Price Daily Chart vs MA 50,200 (Green/Purple) April-May 2019 - Tradingview
image description
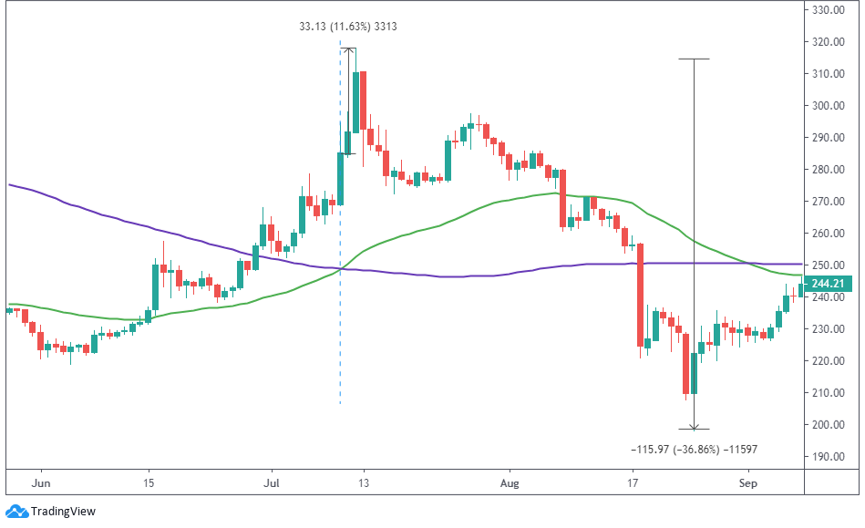
Figure 3: BTC price daily chart vs MA 50,200 (green/purple) from July to September 2015 - Tradingview
image description
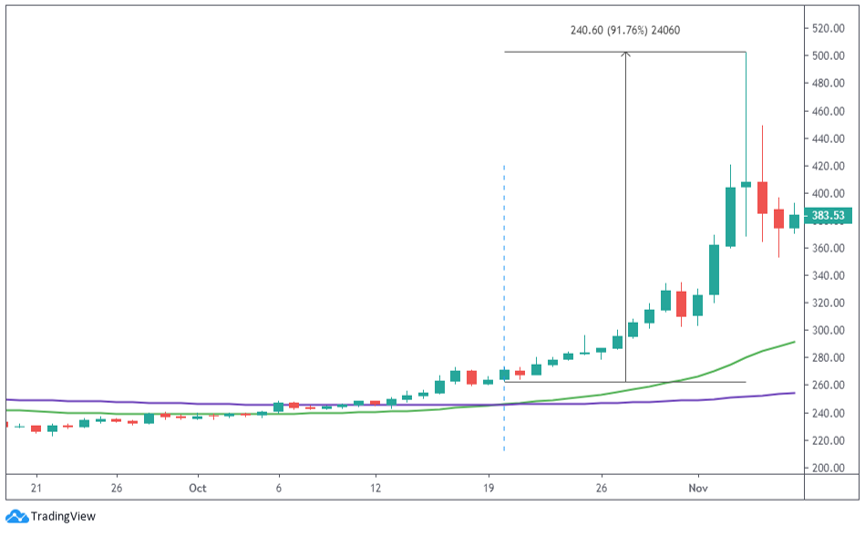
Figure 4: BTC price daily chart vs MA 50,200 (green/purple) from October to November 2015 - Tradingview
image description
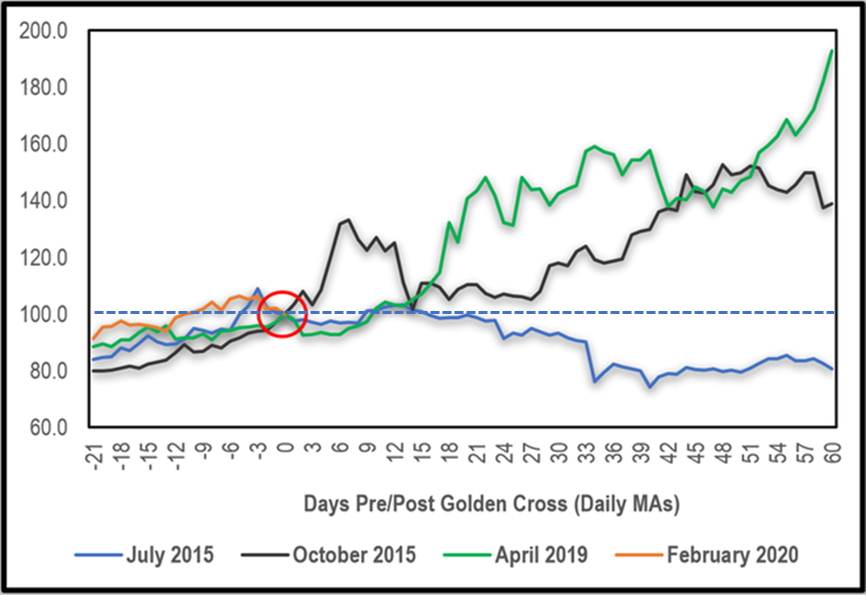
image description
2015/7 – Purple; 2015/10 – Black; 2019/4 – Green; 2020/2 – Orange
image description
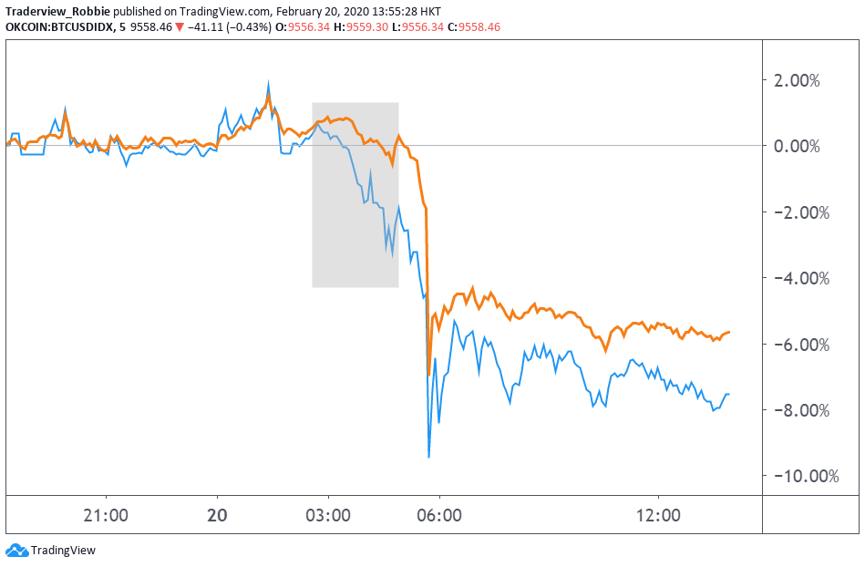
Risk warning: This article does not constitute an investment recommendation. Investment is risky. Investment should consider personal risk tolerance. It is recommended to conduct an in-depth investigation of the project and carefully make your own investment decisions.
Risk warning: This article does not constitute an investment recommendation. Investment is risky. Investment should consider personal risk tolerance. It is recommended to conduct an in-depth investigation of the project and carefully make your own investment decisions.