
Bank of America's Hartnett: Brace for a 'June Storm,' US CPI Will 'Prick the Bubble'
- Core Viewpoint: Bank of America strategist Michael Hartnett warns that if the upcoming US CPI data exceeds expectations, it will trigger a sell-off in risk assets. Combined with a hawkish shift by global central banks and the draining of liquidity by mega IPOs, the tech bubble is facing an extremely fragile moment, with US stocks facing a severe stress test in June.
- Key Factors:
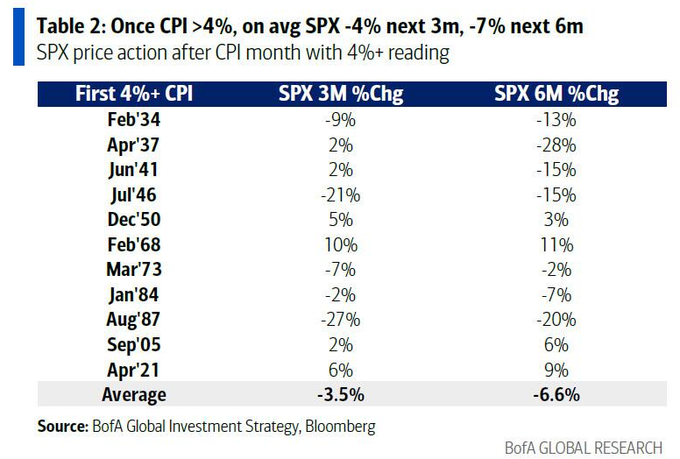
- Historical data shows that once CPI breaks above 4%, the S&P 500 index has averaged a 4% decline over the following 3 months and a 7% decline over the following 6 months.
- Bank of America's Bull & Bear indicator rose from 8.5 to 8.7, issuing a strong "sell signal." Historical data indicates that global stock markets subsequently experienced an average loss of 2%-3% over the following 2-3 months.
- Inflation exceeds targets in 46 of the world's 68 central banks. The probability of interest rate hikes by the European Central Bank and the Bank of Japan stands at 98% and 83%, respectively, potentially causing bond yields to surge.
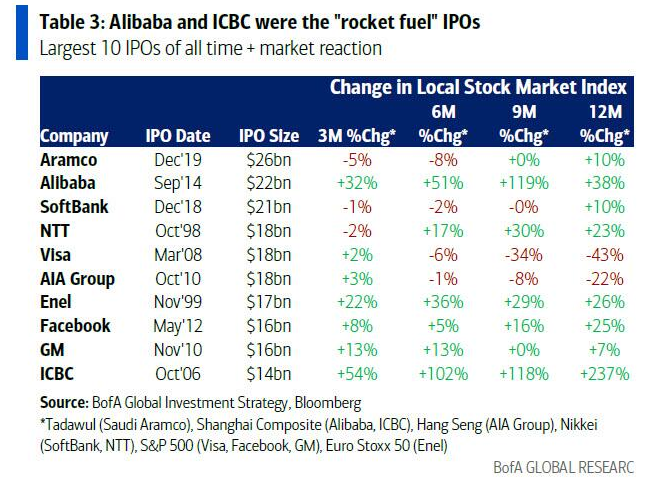
- Mega IPOs like SpaceX are set to drain a record amount of liquidity from the market. Historically, the listings of Visa and AIA served as market "topping" signals.
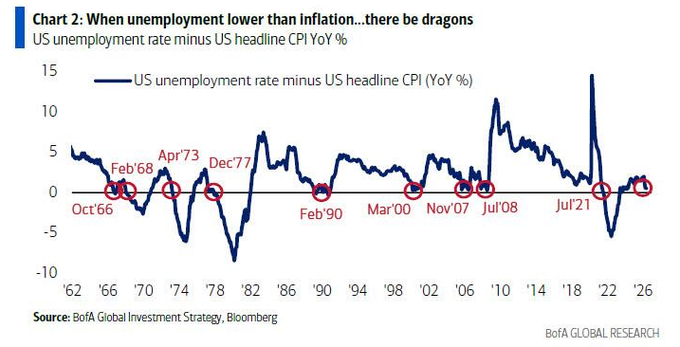
- The "extremely low probability" event of the unemployment rate crossing with CPI may reappear. Similar years like 1966 and 1973 bring back painful memories of Fed rate hikes triggering market downturns.
Original Author: Ye Zhen, Wall Street News
Bank of America strategist Hartnett issued a warning: If inflation data exceeds expectations in the coming period, it will directly trigger a sell-off of risk assets. Historical data shows that over the past 100 years, once CPI breaks above 4%, the S&P 500 index has averaged a decline of 4% over the following 3 months and 7% over the following 6 months.
Furthermore, the market's "sell signal" continues to strengthen. Mega IPOs like SpaceX will drain record liquidity, combined with the risk of hawkish pivots by global central banks, creating an extremely fragile moment for the tech bubble.
The U.S. stock market is facing a severe stress test in June. Bank of America strategist Michael Hartnett warns that a series of dense macro event risks and a sharp withdrawal of market liquidity could drive global bond yields significantly higher, thereby puncturing the current tech asset bubble.
According to Chase Trading Desk, Hartnett stated in his latest report that the upcoming U.S. CPI data is the core catalyst for this "June Storm." If the latest inflation data exceeds expectations, it will directly trigger a sell-off mechanism for risk assets. Historical data indicates that when inflation breaks through a critical warning line, it often triggers a deep correction in U.S. benchmark stock indices over the subsequent months.
Meanwhile, the dense decisions and statements from global central banks are steering market direction. Notably, the upcoming Federal Open Market Committee (FOMC) meeting, potentially chaired by new Fed Chair Warsh, will see its hawkish or dovish policy stance determine the fate of U.S. stocks and long-term bond yields. Any unexpected tightening signal will severely impact investors.
Against a backdrop of extremely exuberant bullish sentiment, Bank of America's internal sentiment indicator has flashed a strong "sell signal." Combined with the unprecedented drain on market liquidity from upcoming mega-cap tech IPOs, current risk assets are in an extremely vulnerable position.
Key Inflation Data Approaches, U.S. Stocks Face Historic Drawdown Risk
The primary test for the market is the U.S. CPI data to be released on June 10th.
Over the past three months, this data averaged a month-over-month increase of 0.6%, and 0.4% over the past six months. If May's CPI month-over-month growth rate exceeds 0.4% (current market expectation is 0.5%), it means the U.S. CPI year-over-year growth rate will break above 4%, potentially heading towards 5% before the U.S. midterm elections. This trend will cause extreme unease for risk assets.
Historical data shows that over the past 100 years, once CPI broke above 4%, the S&P 500 index averaged a decline of 4% over the following 3 months and 7% over the following 6 months.
Another inflation indicator that cannot be ignored is the intersection of the unemployment rate and CPI.
In May, there is a "very small probability but significant impact" possibility that the U.S. unemployment rate (consensus estimate 4.3%) could equal or fall below the inflation rate (consensus estimate 4.2%). This would be the 7th occurrence since 1960. In years when inflation is near or above the unemployment rate (e.g., 1966, 1973, 2008, and 2021), the Federal Reserve typically raises interest rates, and Wall Street's memories of these years are often painful.
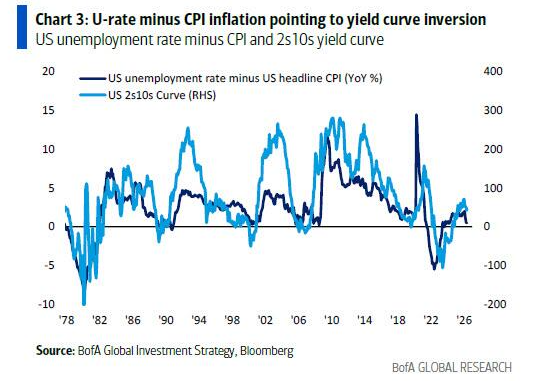
Furthermore, the difference between the unemployment rate minus CPI is highly correlated with the U.S. yield curve and is currently pointing towards a near-term curve inversion, another negative signal for risk assets.
Dense Global Central Bank Decisions, Bond Yields May End the Boom
"Booms and bubbles are ultimately ended by bonds," Michael Hartnett reiterated this logic in his report.
He warns that a series of events in June could push the UK 30-year bond yield above 6%, the US 10-year yield above 5%, and the Japan 10-year yield above 4%. With the market currently full of bullish positions and optimistic earnings expectations, a surge in yields is undoubtedly negative for risk assets.
Global central banks are currently significantly behind the inflation curve. Among 68 global central banks, 46 currently have inflation levels exceeding their target or the absolute median of their target range. Against this backdrop, the European Central Bank (ECB) has a 98% probability of raising rates by 25 basis points, while the Bank of Japan (BoJ) has an 83% probability of a 25 basis point hike, the latter needing this urgently to prevent the yen from breaking through the 160 per dollar "Maginot Line."
The June 17th FOMC meeting, potentially led by Warsh, is considered one of the two most important events of the month.
The market currently faces a policy dilemma: if Warsh is too dovish, long-term yields will head towards 6%; if too hawkish, the S&P 500 index faces the risk of correcting back to the 7000 point level. A "Goldilocks" moderate stance could push the NYSE Composite Index (NYA) to break through the 24000 point all-time high.
As Warsh stated in 2024, global central banks seem complacent about inflation rates near 3%, and the 2% inflation target is no longer taken seriously, a compromise he considers extremely dangerous.
Wealth Effect Fuels Inflation, Extreme Sentiment Triggers "Sell Signal"
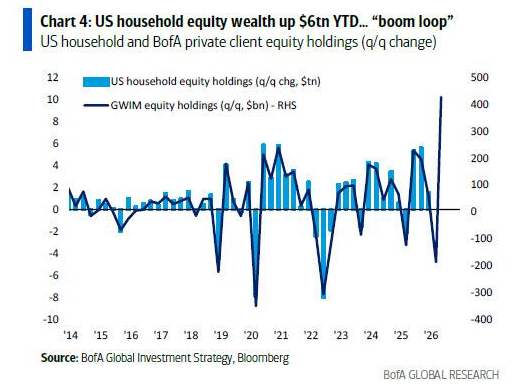
From a macroeconomic perspective, the U.S. is experiencing a K-shaped recovery driven by a "boom cycle" of wealth and the stock market.
American household stock wealth has increased by $6 trillion year-to-date. This "wealth-price spiral" directly exacerbates inflationary pressures. Despite the economic boom, voter sentiment is mixed, and Trump's inflation approval rating has already fallen below Biden's lowest level.
In terms of fund flows, investors have recently shown an extreme tendency to chase the tech bubble. Last week's data showed a massive $122 billion flowing into cash, $390 billion into bonds (a record high), and $23.1 billion into stocks. Meanwhile, $2 billion flowed out of cryptocurrencies and $3.1 billion out of gold, indicating investors are selling other assets to chase tech and semiconductor sectors.
These extreme fund flows caused Bank of America's Bull/Bear indicator to rise further from 8.5 to 8.7, strengthening the "sell signal" triggered two weeks ago.
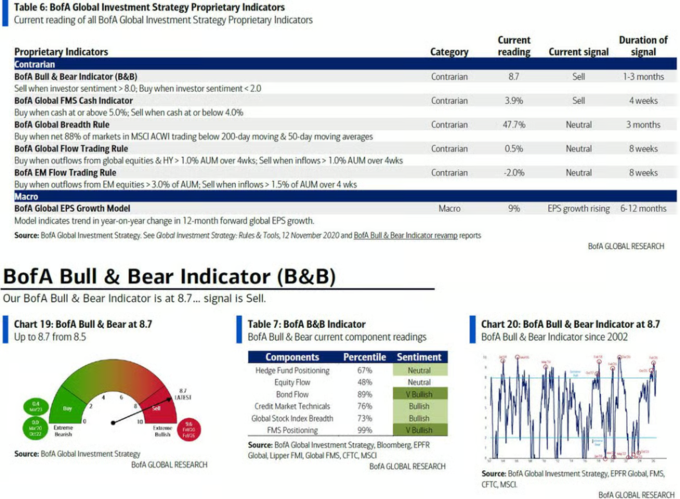
Historical data shows that in 17 instances of the "sell signal" since 2002, global stocks averaged a loss of 2% to 3% over the subsequent 2 to 3 months, with maximum drawdowns potentially reaching 15% to 20%. Additionally, global breadth indicators show 48% of global stock markets are in overbought territory.
Mega IPOs Drain Liquidity, Non-Economic Events Heighten Market Turmoil
Beyond macroeconomic data, the biggest non-economic event risk in June comes from massive supply in capital markets.
SpaceX's Initial Public Offering (IPO) is expected to start trading next Friday. Together with offerings from Anthropic, OpenAI, and the expiration of related lock-up periods, this will drain record liquidity from the market. The tightening of liquidity at this scale may have a catalytic power surpassing even the decisions of central banks.
Opinions on the market impact of historical mega IPOs are divided.
While the IPOs of Alibaba and ICBC acted as market catalysts, the listings of Visa and AIA served as market "top" signals. The S&P 500 index and the Hang Seng Index both declined substantially in the 9 to 12 months following these IPOs.
Hartnett believes this political shift is the core reason Latin American bond yields and spreads are at historic lows (falling to 217 basis points, the lowest since November 2007). Similar political rightward trends are also evident in Europe.
For investors, this means a profound and substantive reassessment of recent global economic policy preferences is underway.


