**Hướng dẫn tự kiểm tra các đồng coin "ma" trong thị trường gấu**
- Quan điểm cốt lõi: Trong thị trường tiền mã hóa, các token có lượng lưu thông thấp thường tồn tại hành vi thao túng do các nhà tạo lập thị trường chi phối, chủ yếu thông qua hai kịch bản là "ép giá tăng (short squeeze)" và "đẩy giá lên cao để xả hàng (pump and dump)" để thu gom các nhà đầu tư nhỏ lẻ. Nhà giao dịch cần sử dụng các công cụ như dữ liệu phái sinh, phân tích on-chain và cấu trúc vi mô của sổ lệnh để nhận diện sớm các tín hiệu, tránh trở thành "kẻ tiếp nhận cuối cùng".
- Các yếu tố chính:
- Hai mô hình thao túng điển hình: Loại "ép giá tăng" đại diện bởi MYX thông qua tích trữ, nhử bán khống, bẫy, đẩy giá lên thanh lý lệnh short rồi quay đầu bán khống để thu gom; loại "đẩy giá lên cao để xả hàng" đại diện bởi COAI tận dụng lượng lưu thông cực thấp để trực tiếp đẩy giá lên rồi phân phối.
- Điểm chung cốt lõi: Lưu thông ban đầu thấp (<20%), phần lớn được triển khai trên BNB Chain, thu hút dòng tiền thông qua Binance Alpha dẫn đến hợp đồng tương lai của Binance (nơi kiếm lợi), thường được khoác áo tường thuật AI, sử dụng các ví phối hợp (đôi khi hơn 60 ví) để tích trữ và kiểm soát thị trường.
- Cảnh báo dữ liệu: Tỷ lệ Vol/OI cao bất thường (>20 lần), tập trung OI trên nhiều sàn giao dịch (ví dụ một sàn nhỏ chiếm >60%), tỷ lệ funding fee âm sâu liên tục (ví dụ -2%/4 giờ) là tín hiệu của việc tạo khối lượng giả và bố trí "ép giá tăng".
- Giám sát thời gian thực: Sự mất cân bằng dương kéo dài của sổ lệnh (>0,4), độ sâu phía bán liên tục mỏng đi cùng với tần suất đặt/hủy lệnh bất thường cao (>15.000 lần/giờ) có thể phát hiện sớm hành vi tích trữ.
- Công cụ chính: CoinAnk (dữ liệu phái sinh), Arkham (liên kết ví on-chain), Bubblemaps (trực quan hóa cụm ví) và Coinglass (OI/phí/thanh lý) có thể được sử dụng để nhận diện các hành vi thao túng ở từng giai đoạn.
Compiled by: @tradinghoex @0xBenniee
Translated by: @0xBenniee
For the vast majority of people entering crypto, the sole purpose of stepping into this world is that it's one of the few places left where ordinary individuals can truly take control of their own financial destiny. Most come here seeking "life-changing trades" and profits, not just out of a passion for the underlying technology.
But the problem is: the rules of this game are set so that there is only one winner – the Market Makers.
This article will thoroughly dismantle how this manipulation works, what tools you need to identify it early, and how to avoid becoming the "exit liquidity." All conclusions are based on real cases of several manipulated tokens over the past 7 months.
Two Scripts, One Outcome
Not all "criminal pumps" follow the same playbook. After studying 7 manipulated tokens over 7 months, we discovered two distinct patterns. Both rely on low-float tokens on Binance, and both end with retail/exchanges taking losses, but the underlying mechanisms for extracting capital are fundamentally different.
MYX: The Squeeze Play
Phase 1 — Set Up
According to CoinMarketCap historical data, the "big move" that eventually pushed MYX to a $19 high began around late August 2025. It broke out from below $0.10 to around $1.20, then continued climbing to several dollars over the following weeks.
In-depth analysis reveals this rally was orchestrated by 6 wallets. They executed 2,240 small buys on PancakeSwap, accumulating a total of $3.92 million worth of MYX tokens, which were later consolidated into a centralized exchange deposit address.
Research on Arkham also uncovered multiple wallets systematically injecting USDT into MYX liquidity pools in a "rotating pattern" during August-September 2025: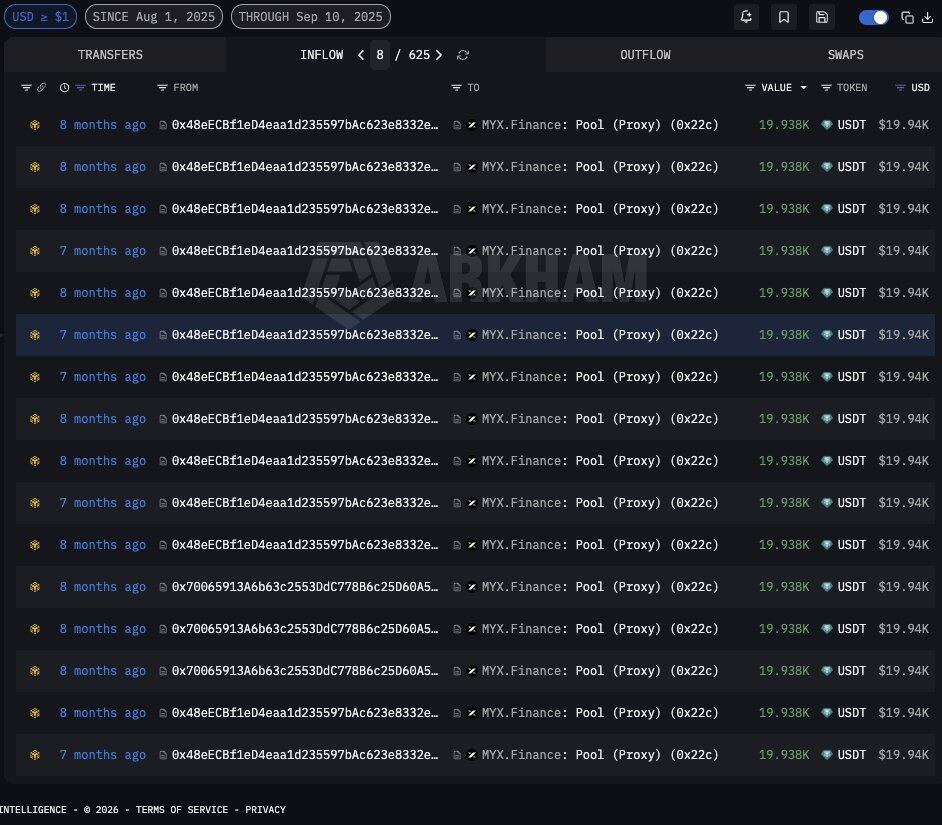
- One wallet injected funds in batches of $90,000–$108,000;
- A second wallet in batches of $20,000–$67,000;
- A third wallet executed dozens of nearly identical injections of $19,938 each.
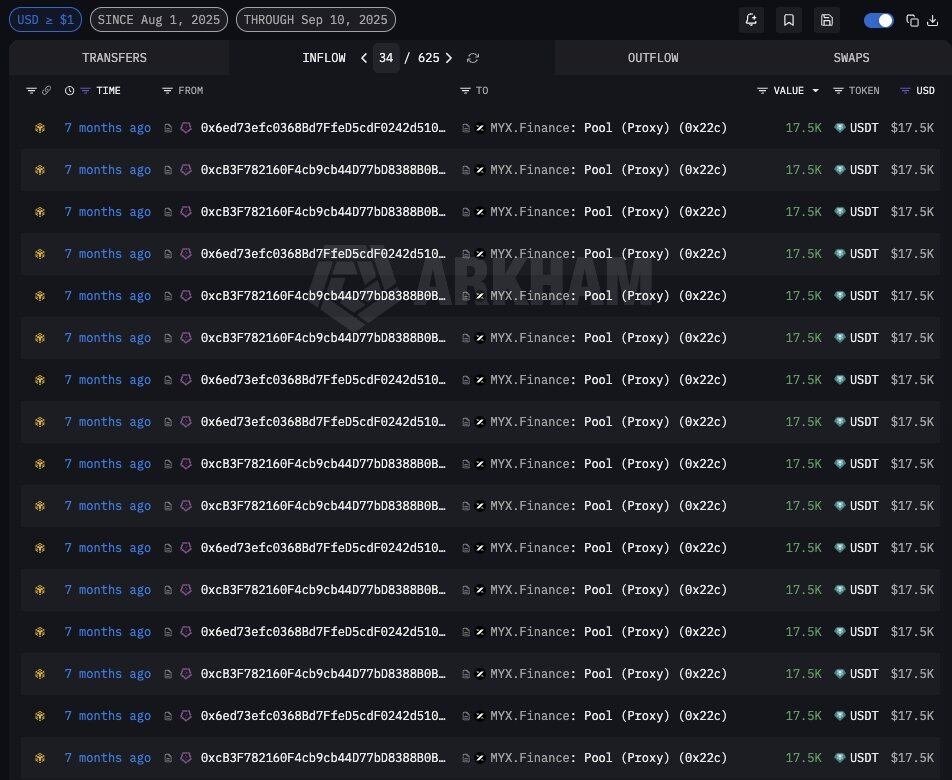
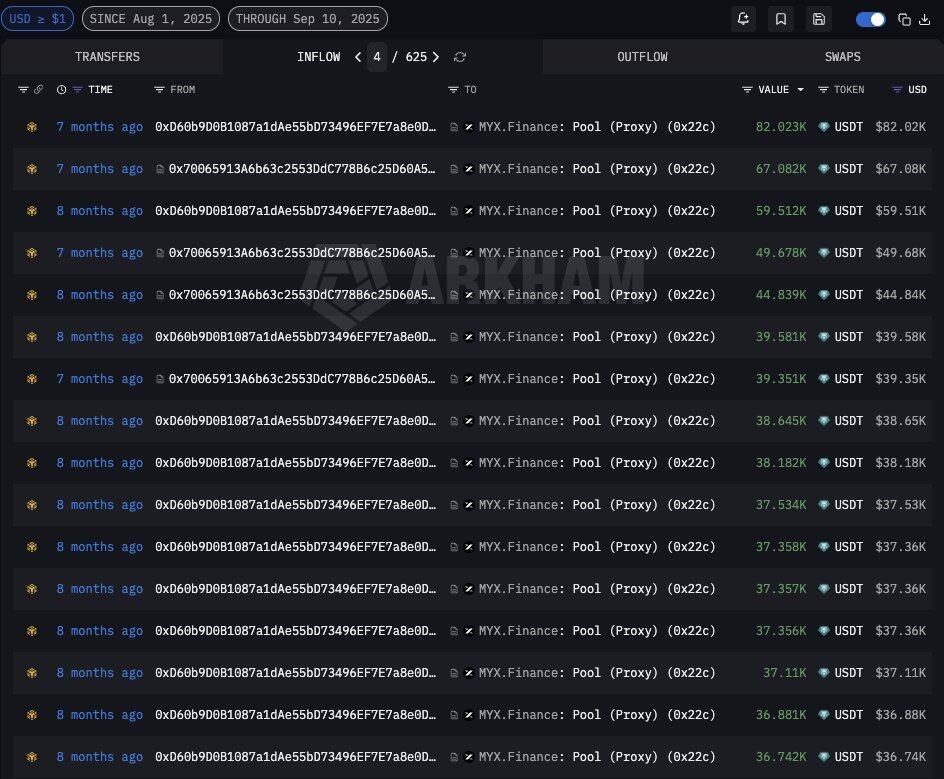
These wallets made multiple small purchases on-chain and split the holdings. This operation gained early control of circulating supply off-exchange before the pump, while avoiding the risk controls of whale monitoring. Through this covert accumulation phase, market makers achieved significant control without detection, laying the foundation for subsequent manipulation.
Phase 2 — Luring Shorts
CoinGecko historical data shows MYX's price range from late July to early August 2025 was $0.10–$0.11:
- August 3: Jumped to $0.168;
- August 4: Surged to $0.398;
- August 5: Reached $1.29 – a 1,190% increase in 5 days.
The unlock of 39 million tokens occurred exactly on August 6, when the price was $1.65, right in the middle of this initial rally.
This pump was deliberately made to look "unsustainable." Every cautious trader looking at the fundamentals, seeing a micro-cap token with no users skyrocket 1,550%, had the same thought: "Shorting this is a sure thing."
Over the next month (August 6 – September 6), MYX consolidated between $1.05–$2.00, hitting $2.00 exactly on August 16 before retreating, dropping to $1.31 by September 6. This month-long consolidation looked exactly like a top had formed. More shorts entered.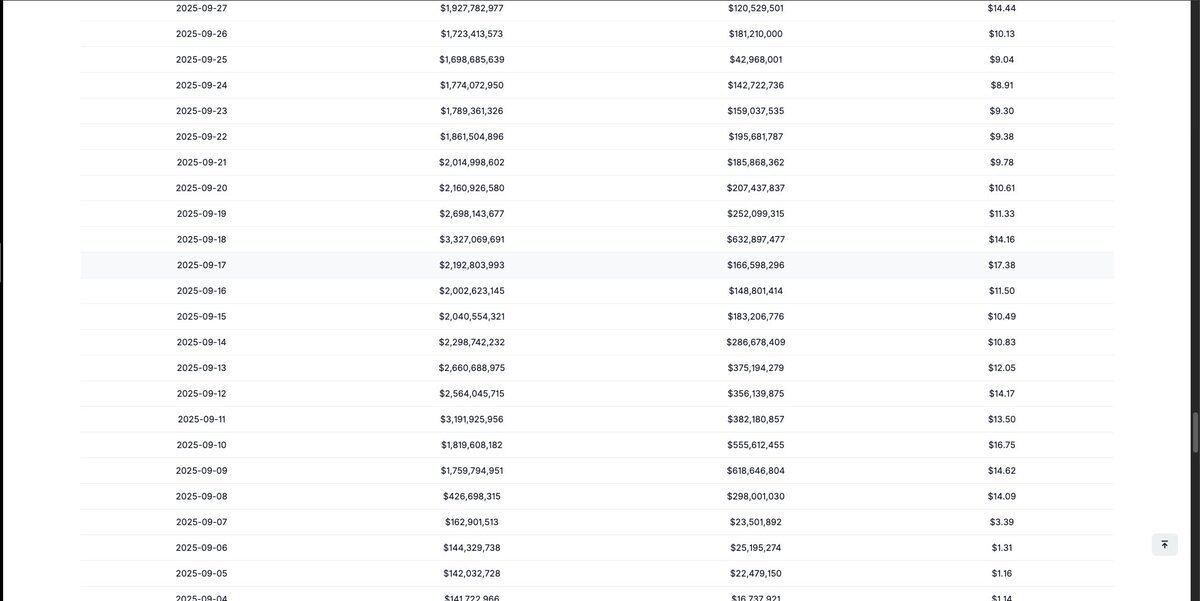
As of April 2026, only 28.18% of MYX's total supply had been unlocked, with 71.82% still locked or in linear release. During the August-September 2025 pump, the circulating supply was even smaller, with project teams typically controlling 95% or more.
There's a common misconception here regarding Market Cap & Fully Diluted Valuation (FDV)
Market cap = Current price x Circulating supply
Fully-diluted value (FDV) = price x max supply
Typically, initial circulating supply for strongly controlled tokens is around 10-20%. The actual cost of market control depends on market cap, not FDV. This leads some to fear high FDVs and short, when the true circulating supply is only reflected in the market cap and actual off-exchange float.
Phase 3 — The Trap (Deepening the Setup)
During that month of consolidation, funding rates turned deeply negative – shorts paid -2% every 4 hours, meaning holding a position for just one day cost -12%, not even factoring in stagnant or rising prices.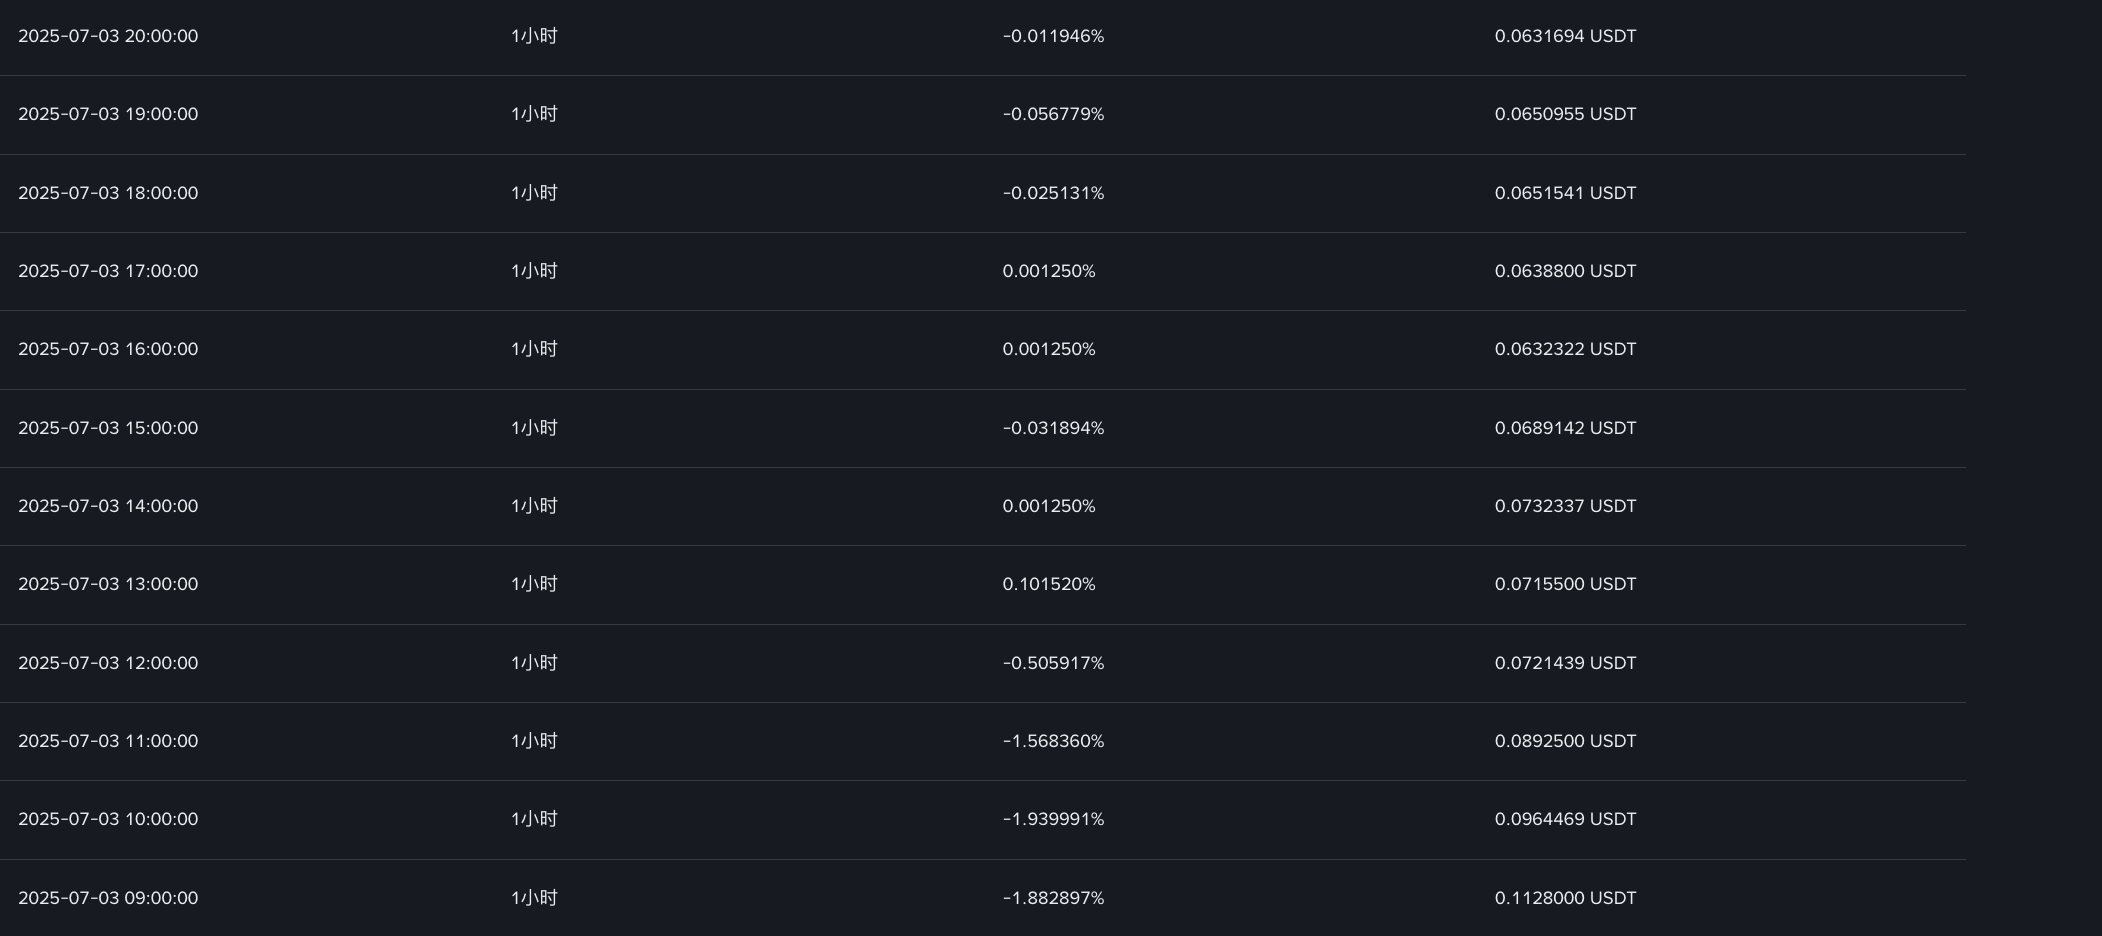
The manipulators used this phase to close their initial long positions and re-enter. The $1–$2 range with deeply negative funding rates looked like a "token that had already topped." More shorts jumped in, convinced "the dump is imminent."
Phase 4 — The Squeeze
Coinglass data confirms this setup:
- September 6: OI (Open Interest) $95.15M, price $1.31;
- September 7: Price nearly tripled to $3.39, the first wave of shorts liquidated, OI surged as new positions flooded in from both sides;
- September 8: MYX ripped from $3.39 to $14.09 in a single day. According to WEEX exchange analysis, $16.53M was liquidated on this day alone, with $13.68M coming from short positions. Each liquidation triggered a mandatory buy-back, pushing the price higher and triggering the next wave of liquidations. OI surged to over $370M;
- September 9: Pushed to $14.6;
- September 10: Hit $16.75. Coinglass shows daily contract volume soared to $9–10B+ during this period.
The squeeze continued until mid-September, with prices grinding between $10–$17, systematically hunting down the remaining shorts.
Phase 5 — The Exit
Once the shorts were exhausted and prices peaked, the manipulators flipped their positions: opening shorts at the high, slowly unwinding their original long positions, then transferring tokens to centralized exchanges for spot holdings, without immediately selling.
This is where the second trap caught seasoned on-chain players. Seeing "wallet → exchange" transfers, they instinctively shorted, expecting "the dump is coming." However, those transfers were just a trap. Before the actual dump, the manipulators would squeeze these new shorts one more time, making a final harvest before truly exiting.
COAI: The Pump and Dump
COAI launched in September 2025 at an opening price of $0.22. Within two days, it dropped to $0.17 due to airdrop recipients selling. Over the next 7 days, it traded quietly between $0.17–$0.39 – this was the accumulation window.
On October 6, COAI launched 5x leverage futures on the Aster exchange. The same day, the price jumped from $0.39 to $2.42. Binance Alpha was the first platform to list COAI (September 25, same day as TGE), with Bybit following around October 30. The entire BNB ecosystem was in an upward momentum, and the "BNB Season" narrative provided the perfect cover for the pump.
As of April 2026, only 24.86% of COAI's total supply had been unlocked, with 75.14% still in linear release. This means during the October 2025 pump, the actual circulating supply was even smaller, and on-exchange control was tighter.
Bubblemaps' on-chain analysis revealed 60 wallets: they were funded simultaneously, each receiving exactly 1 BNB from Binance on March 25 at 11:00 UTC, then executing identical automated trading strategies via Binance Alpha. This high degree of behavioral uniformity led Bubblemaps to directly point out centralized manipulation or high coordination behind these addresses.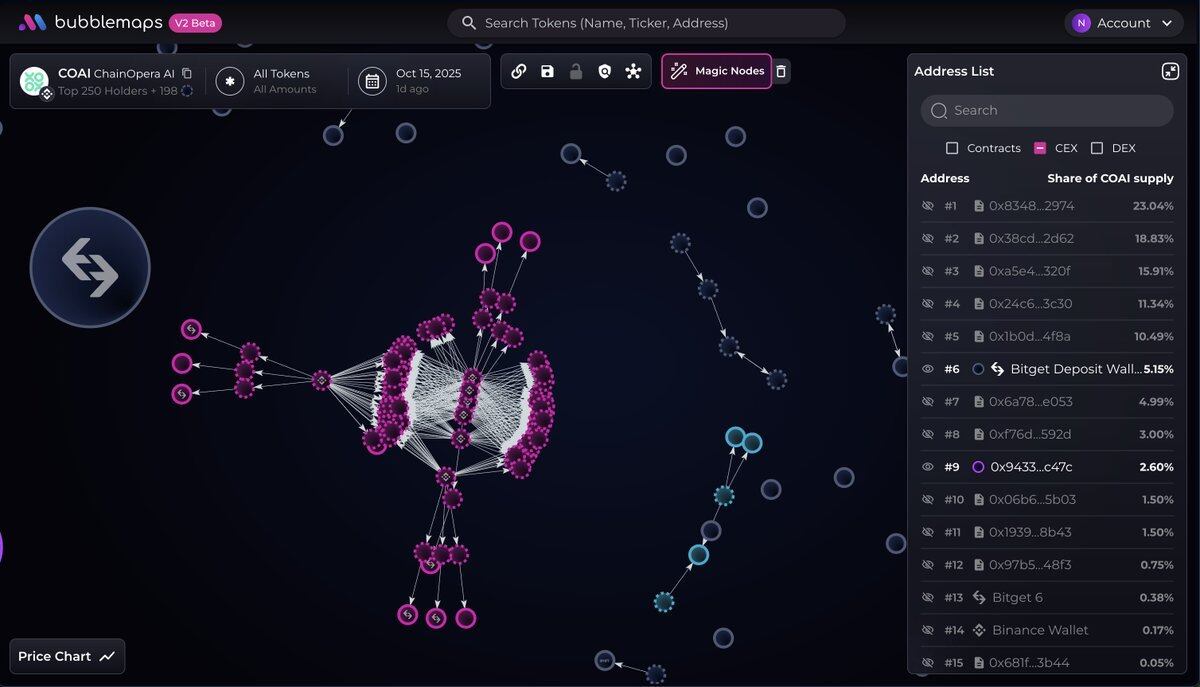
Bubble maps:https://x.com/bubblemaps/status/1978865917552660795
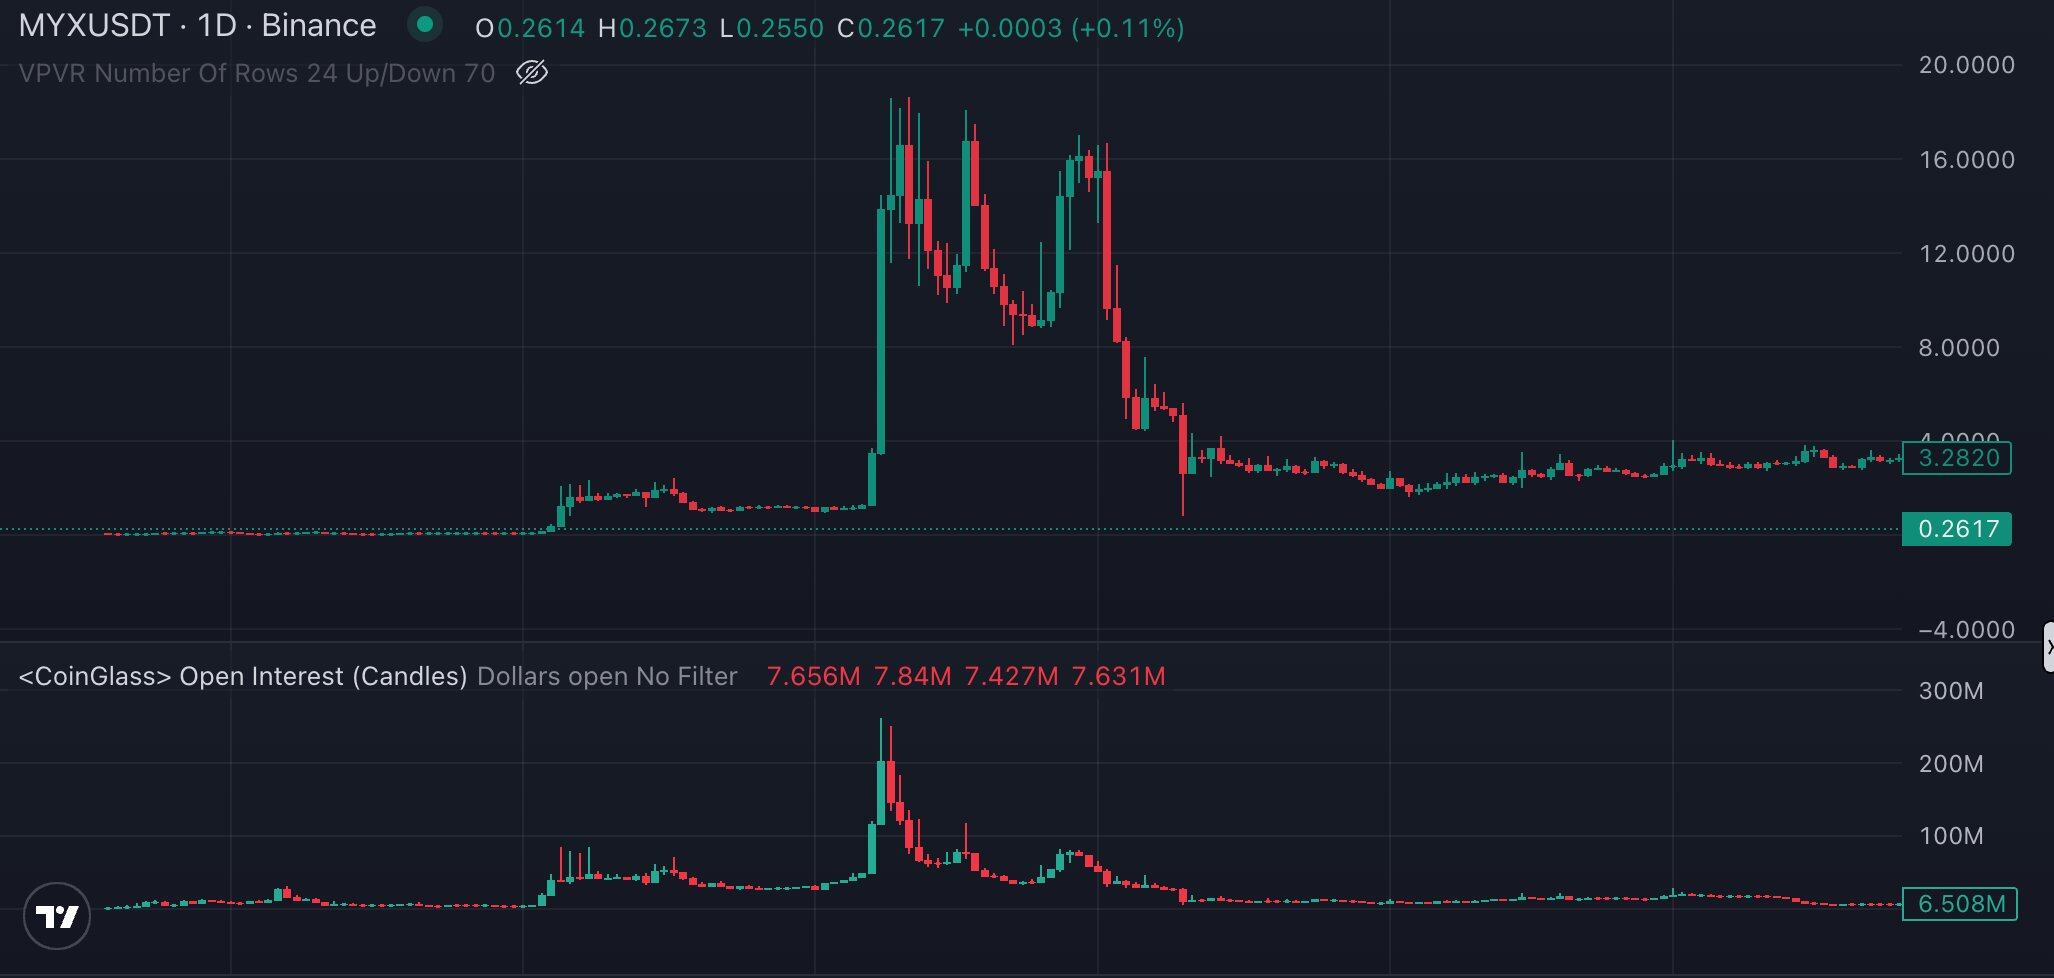
After that, the rally accelerated. Coinglass data shows:
- Pre-Aster listing: OI ~ $30.2M;
- October 7: OI surged to $207.6M, price $2.99;
- October 9: OI $350.93M, price $5.82;
- October 12: Intraday ATH of approximately $44–45.
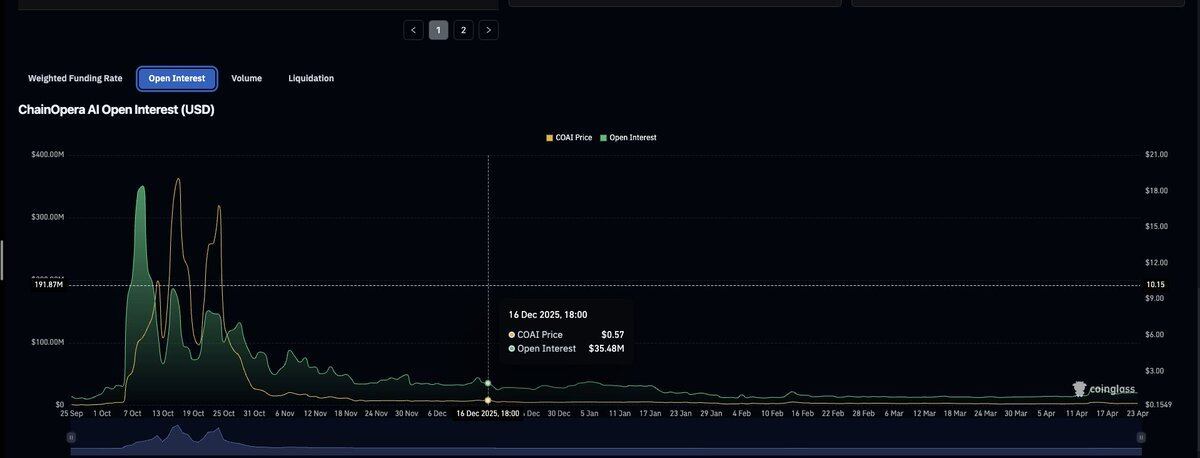
Data from Coinglass
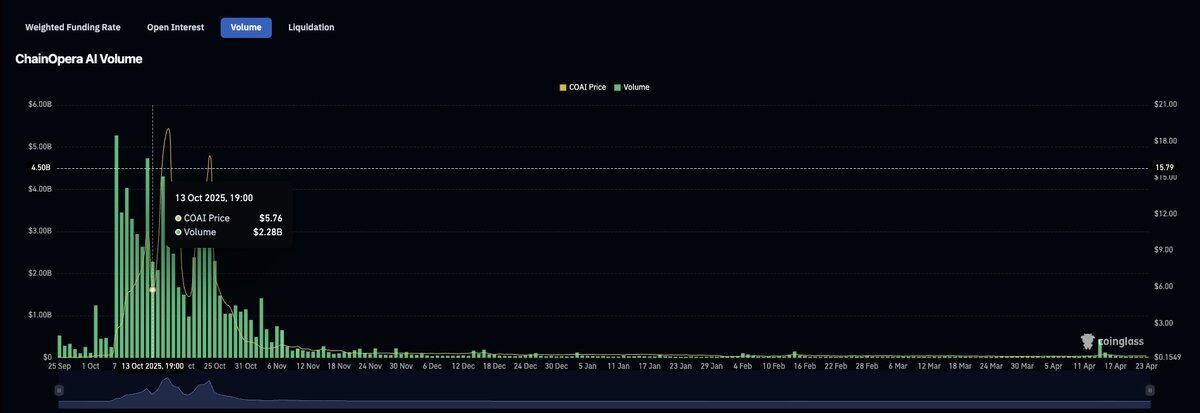
Coinglass:https://www.coinglass.com/currencies/COAI
After the ATH, OI on Coinglass showed a series of rapid declines.
Difference from MYX
COAI didn't follow MYX's five-phase script. MYX had a clear one-month consolidation period between the initial pump and the squeeze – a deliberate "bait + trap" cycle: market makers waiting for shorts to enter, letting funding rates turn deeply negative, then triggering a cascade of liquidations.
COAI was different. From launch to ATH, it was almost seamless, with no pause. With over 75% of the supply locked since day one, the tradable float was already razor-thin. Highly controlled pairs don't need to construct a squeeze; they can dominate prices on this small float and harvest remaining liquidity through off-exchange capital allocation.
Commonalities Among These Tokens
1. Low Float
- COAI unlocked 19.65% at TGE;
- MYX unlocked 9.21%.
- Low initial circulation, low float + high control
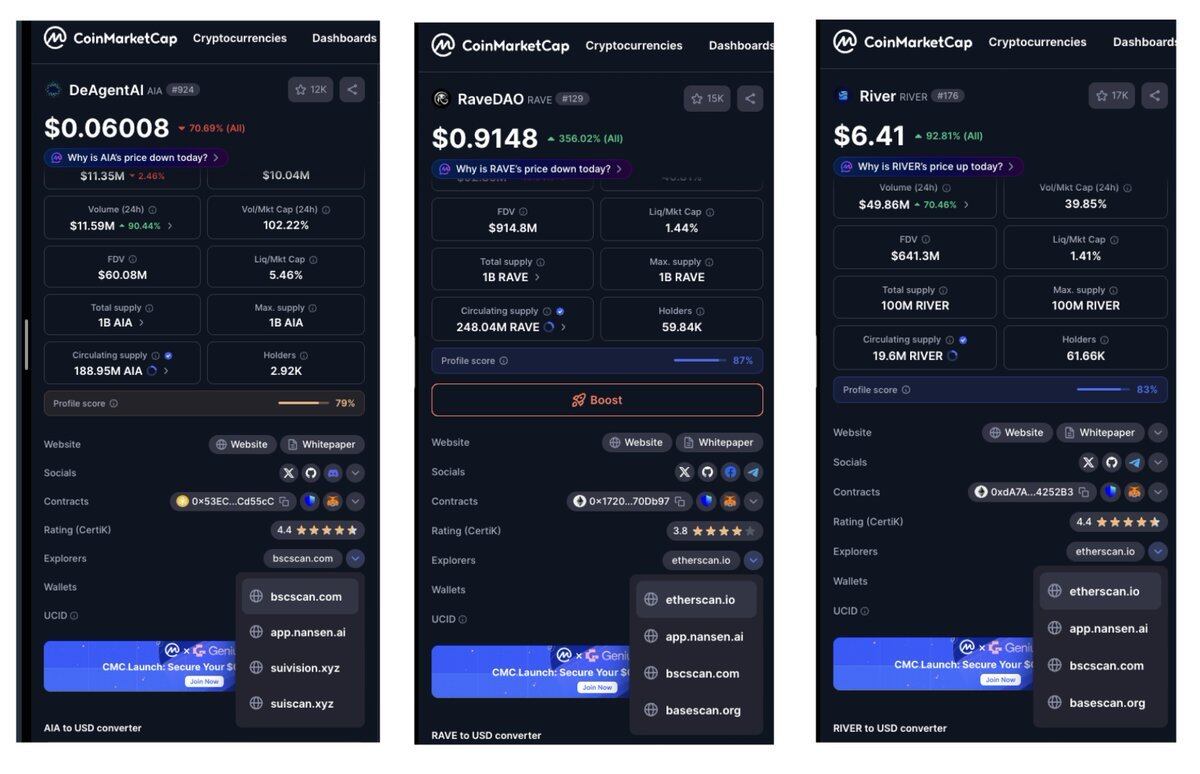
2. BNB Chain All involved tokens have a BNB Chain contract, including AIA (marketed as the "largest AI agent infrastructure," deployed simultaneously on SUI/BSC/BTC at launch). BNB Chain offers cheaper fees and a direct path to Binance Alpha.
Some tokens were deployed on multiple chains:
- AIA: SUI, BNB Chain;
- Rave: Ethereum, Base, BNB Chain;
- River: Ethereum, Base, BNB Chain.
 Multi-chain deployment gives manipulators more angles to exploit: they can move tokens to chains with the thinnest liquidity, create price discrepancies for arbitrage, use bridge mechanisms for manipulation opportunities (like Power exploiting the Ronin bridge pause), and spread tokens across multiple liquidity pools during the distribution phase. More chains mean more venues for manipulation.
3. Binance Alpha → Binance Futures BNB Chain listing → Binance Alpha → Binance Futures. The futures listing is the most critical step – it provides the venue for leveraged liquidations, and futures are the primary profit center.
4. AI Narrative (Mostly)
Most tokens covered here were packaged as AI projects – AI agents, AI infrastructure. MYX is a perpetual contract protocol, and PIPPIN is the sole exception (a pure meme coin with zero AI packaging). But as long as the AI label exists, every pump has a story to tell.
Retail is more willing to enter a token with an AI story than a random BNB Chain token with no narrative.
5. Coordinated Wallet Accumulation
- COAI: 60 wallets, each with 1 BNB;
- PIPPIN: 50 wallets funded from HTX, controlling 44% of supply;
- MYX: 6 wallets, 2,240 small buys on PancakeSwap;
- SIREN: 200 wallets, controlling 50% of total supply.
These operations are typically spread out over weeks or months.
How Order Book Manipulation Works
OI Brushing
"Brushing OI" refers to market makers artificially inflating OI numbers by wash trading or using coordinated accounts to open and close positions on illiquid exchanges, without creating real market risk exposure. This inflated OI makes the token appear more active than it is, attracting more retail and creating an illusion of "ample liquidity."
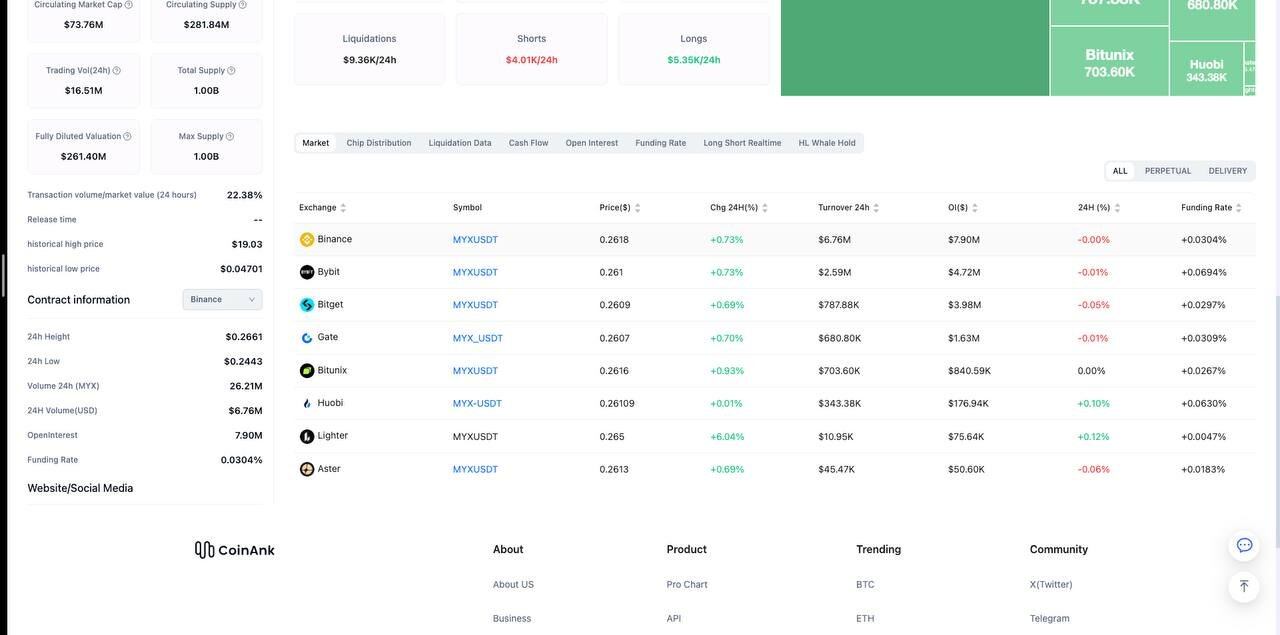
MYX is a clear example. Coinglass shows that during the September squeeze, daily contract volume spiked to $9–11B, while OI fluctuated between $95–396M, resulting in a Vol/OI ratio of 24x. Normal tokens have a ratio between 3–8x, and anything above 20x indicates a significant portion of volume is fake.
According to WEEX analysis, two-thirds of MYX's total volume was concentrated on Bitget – a single exchange accounting for most activity in a micro-cap token. This concentration itself is another wash-trading signal: when a token listed on multiple exchanges has most of its volume on one, that exchange's volume is likely artificially amplified to attract attention and influence other exchanges' listing decisions.