
从全球流动性到机构布局,7大核心指标解读牛市信号
原文编译:深潮 TechFlow

我将运用我在传统金融和企业领域十年的经验,帮助你将复杂的问题分解成易于理解的小块内容。
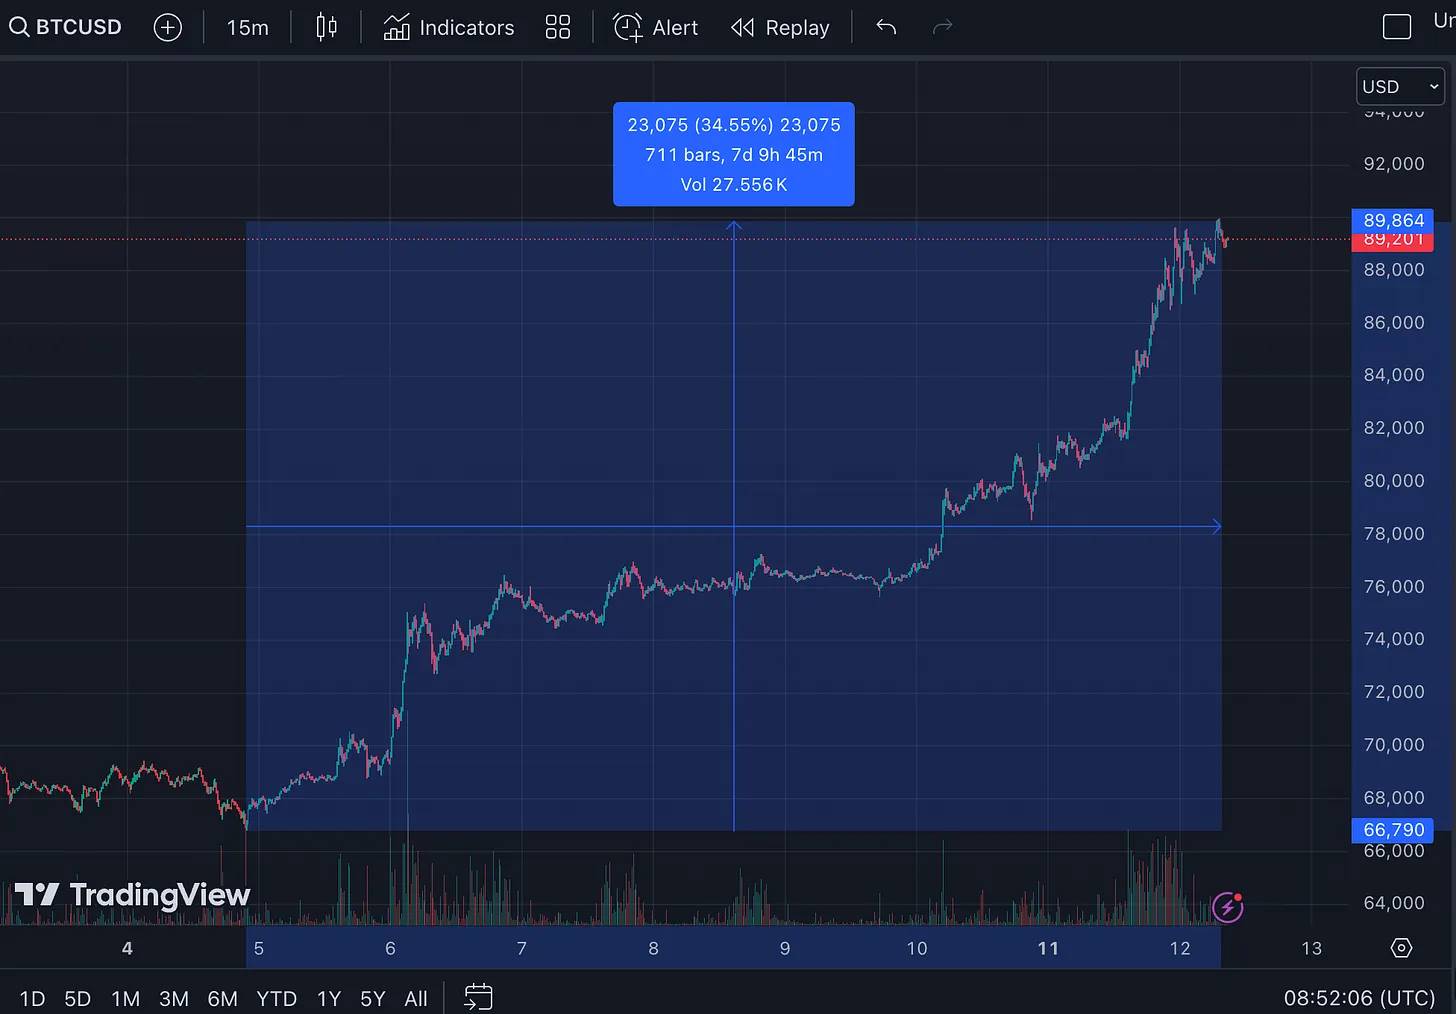
在总统选举结果公布后,比特币价格走势急剧上升,预计特朗普将于一月就职。
上周比特币价格上涨了 35% ,达到 9 万美元后略有回落。数据来源于 Trading View。
在企业方面:
MicroStrategy 目前持有超过 200 亿美元的比特币,并以市场价格再购入了价值 20 亿美元的比特币。
政府方面,有提案建议美国政府在未来五年内每年购买 20 万比特币,这将使他们到 2030 年时持有总供应量的 6% 。
目前,美国已经是持有 21.3 万比特币的国家,政府持有的比特币占总供应量的 2.2% ,但这一比例可能会增加。
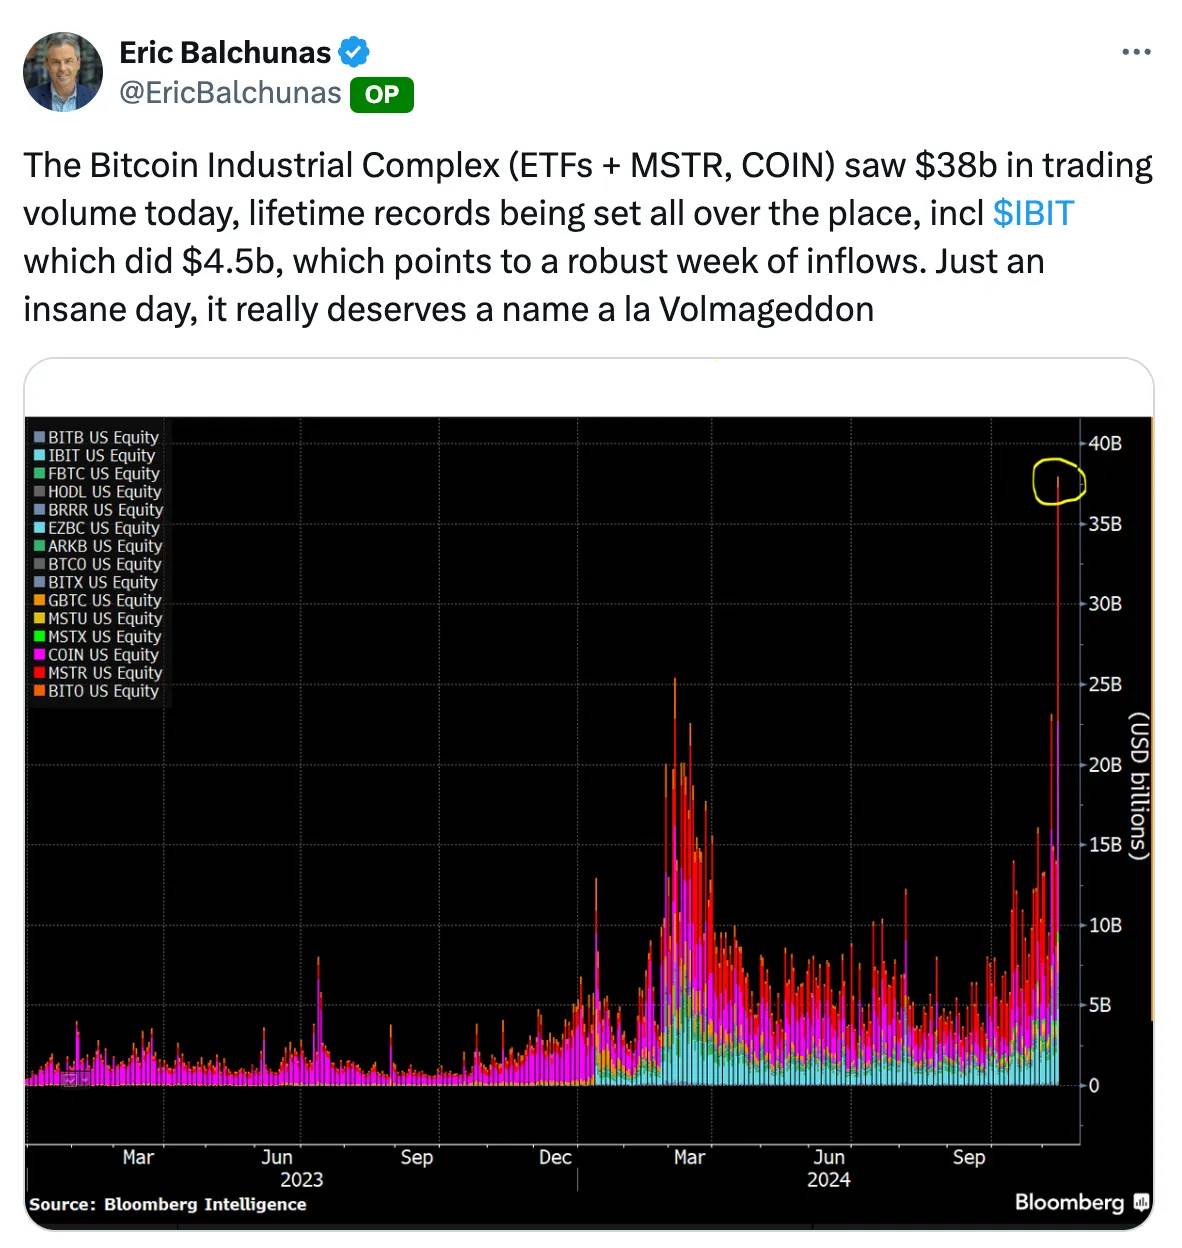
加密市场的总市值达到新的历史高点,达到 2.9 万亿美元——加密货币市场中的资金从未如此之多。
需要关注的市场指标:
市场动态从熊市转向牛市,投资策略已转变为大多数资产只会上涨。
要注意市场转向迹象的客观指标:
全球流动性(以 M 2 供应为参考)
跟踪某些相关资产或指标——M 2 供应(3 个月偏移)与比特币价格高度相关。
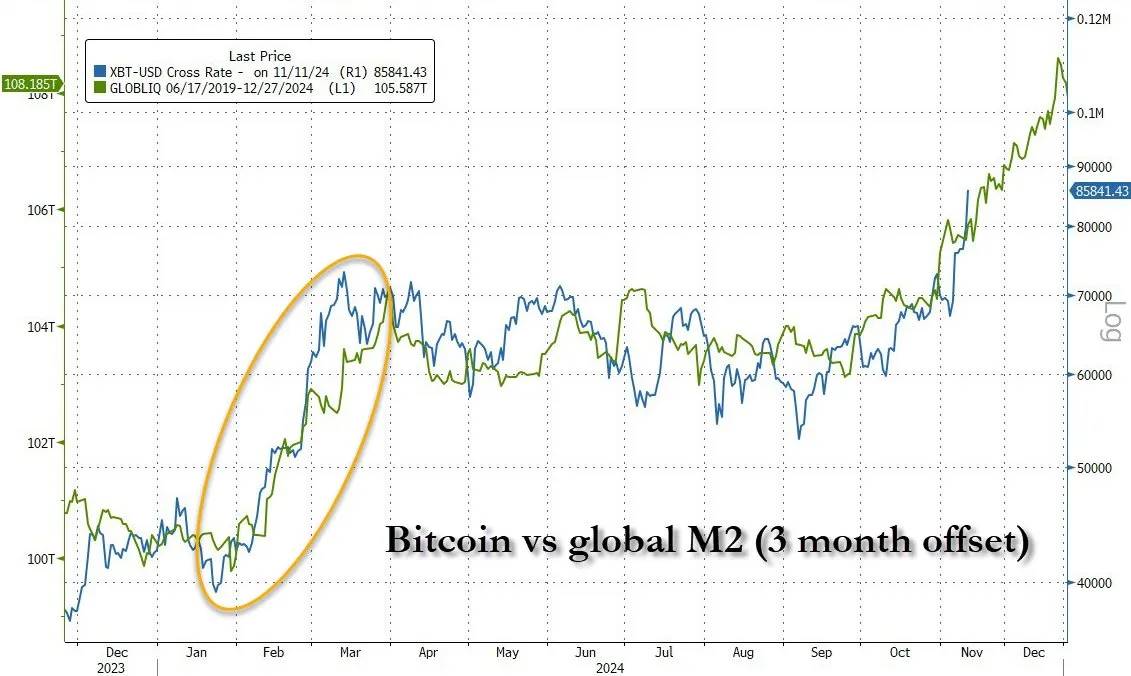
数据来源于 Zero Hedge。
这意味着什么?这实际上是全球流动性的一个参考指标。Lyn Alden 和 Raoul Pal 的理论认为,市场上的流动性变得充裕并投资于资产,因此这些经济决策有 3 个月的滞后期。这种相关性表明,如果比特币继续跟踪 M 2 并且没有显著偏离,我们可能会在年底前看到比特币价格达到 10 万美元。
恐惧与贪婪指数(69 ,Nice)
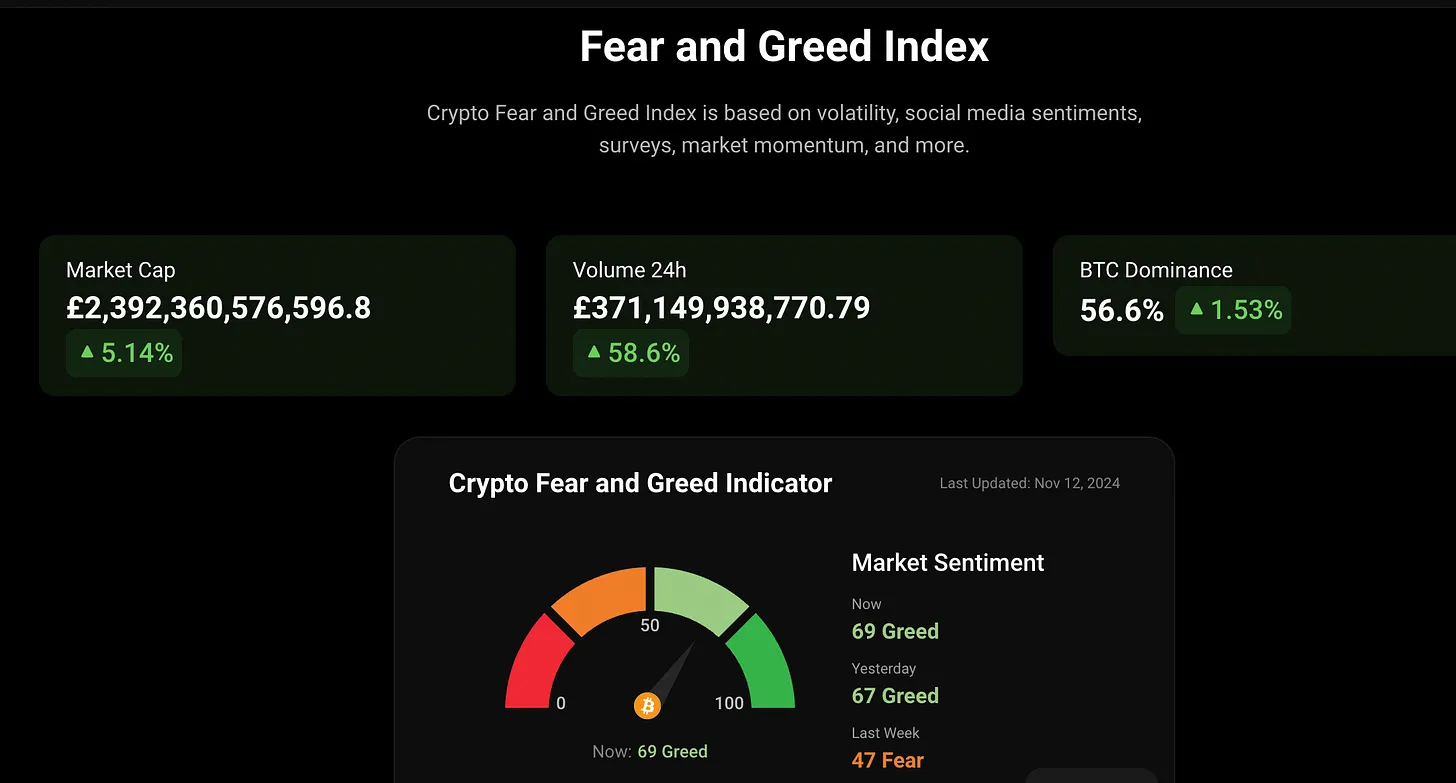
来源:Coin Glass
在使用各个指数时,要注意其方法论的差异,因为有些指数比其他指数更为敏感。Coin Stats 提供了一种相对合理的解决方案,与市场的实际情况相匹配。
Coinbase 钱包的下载量在过去 24 小时内增加了 12%
历史上,当 Coinbase 成为苹果商店或 Google Play 的热门应用时,这通常是一个重要的市场指标,因此值得关注。
比特币的谷歌搜索趋势指数为“ 79 ”
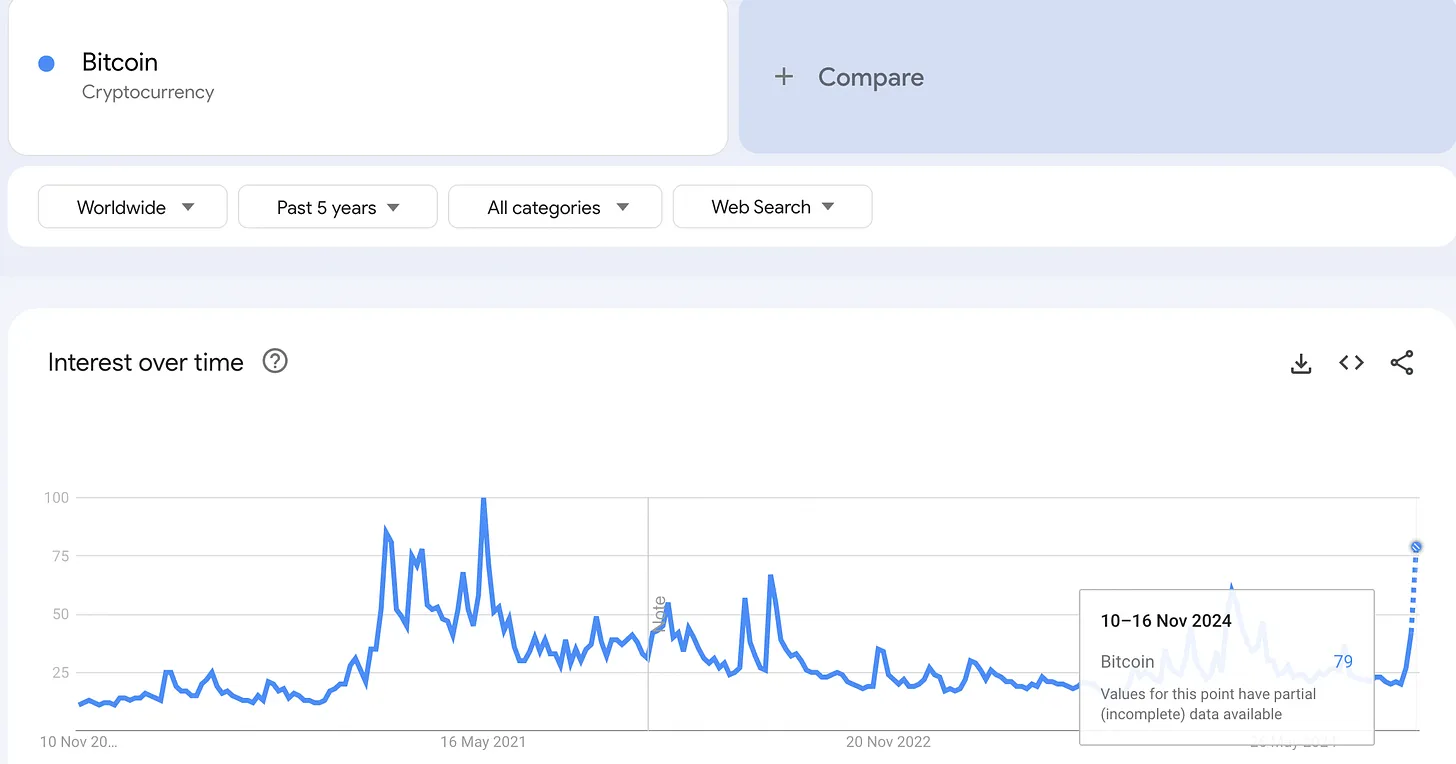
来源:Google Trends 这是一个值得关注的指标,因为我们无法确定“新的 100 ”将达到何种水平——尽管目前的搜索量是 2021 年 5 月高峰的 79% ,但随着更多用户进入加密市场,这一周期可能会有显著增长。
风险投资在加密领域的融资水平
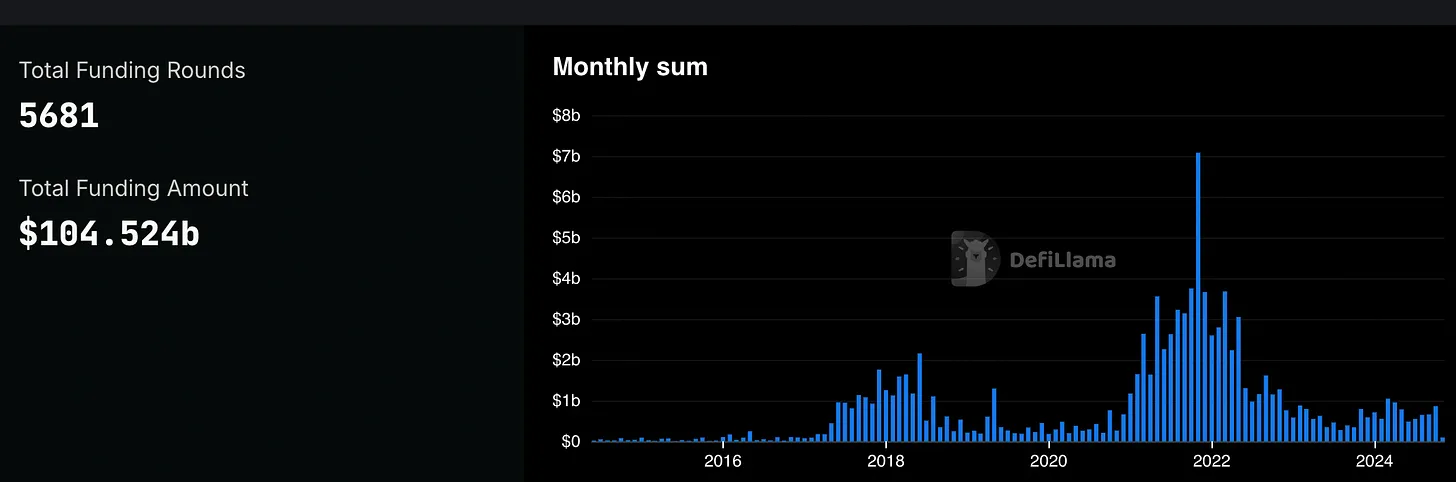
来源:Defi Llama 我们至少可以看到融资的整体趋势在上升,因此当这些融资水平接近或超过 2021 年 10 月的 70 亿美元时,可能接近市场顶部。比特币在 2021 年 11 月达到顶峰,这可能意味着市场会有几个月的滞后。
交易所的资金流动保持中性
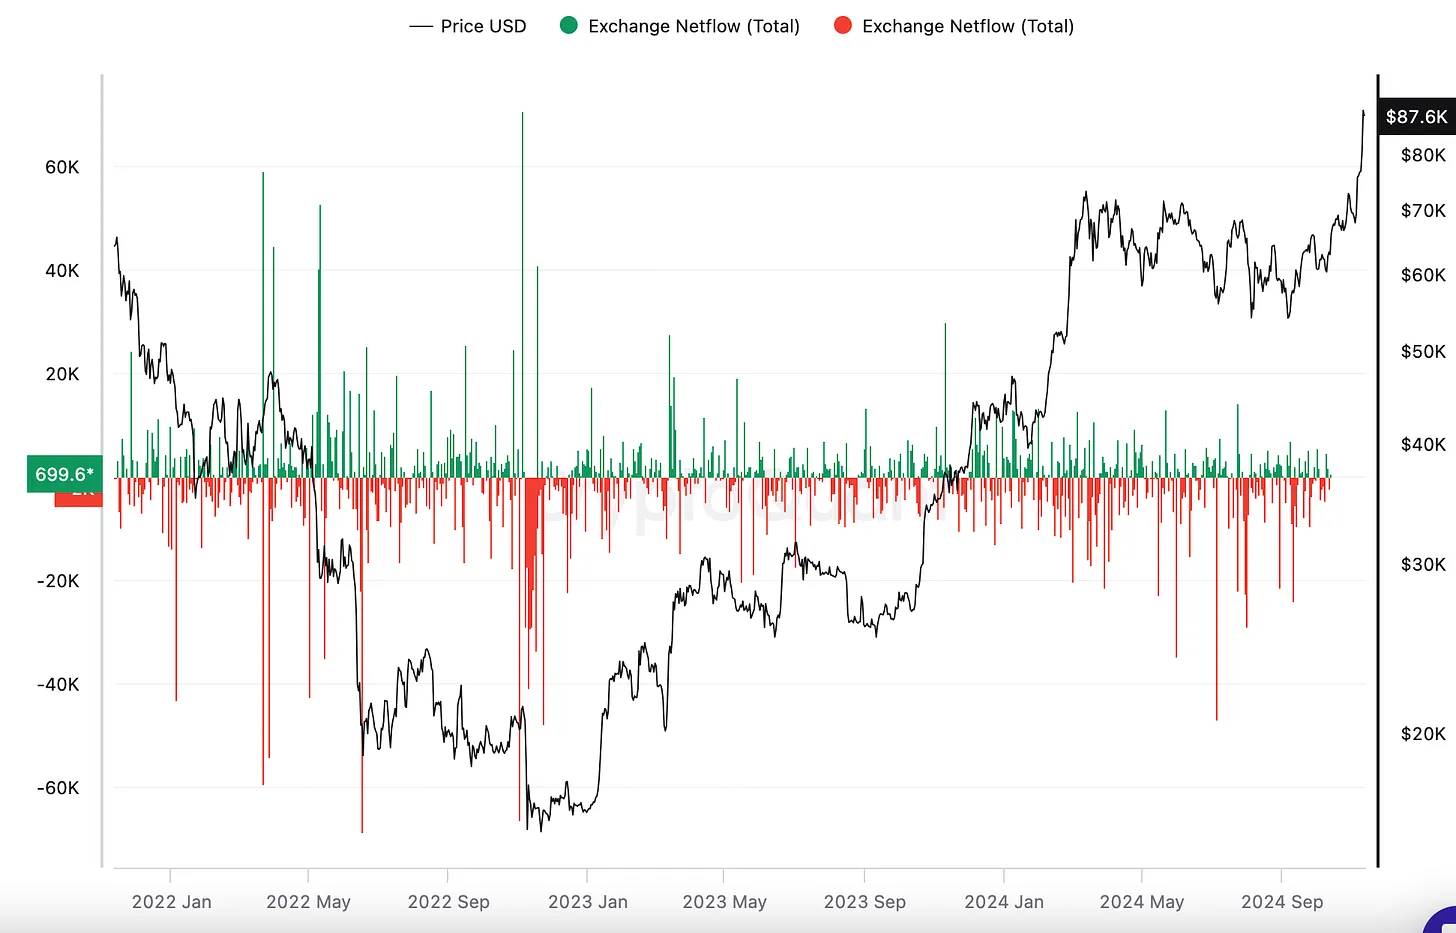
在市场顶部或底部时,交易所的净流动通常会有剧烈波动。目前,资金流动保持中性,表明许多投资者对持有现货或在链上保持投资感到满意。
加密货币相关的 YouTube 观看量
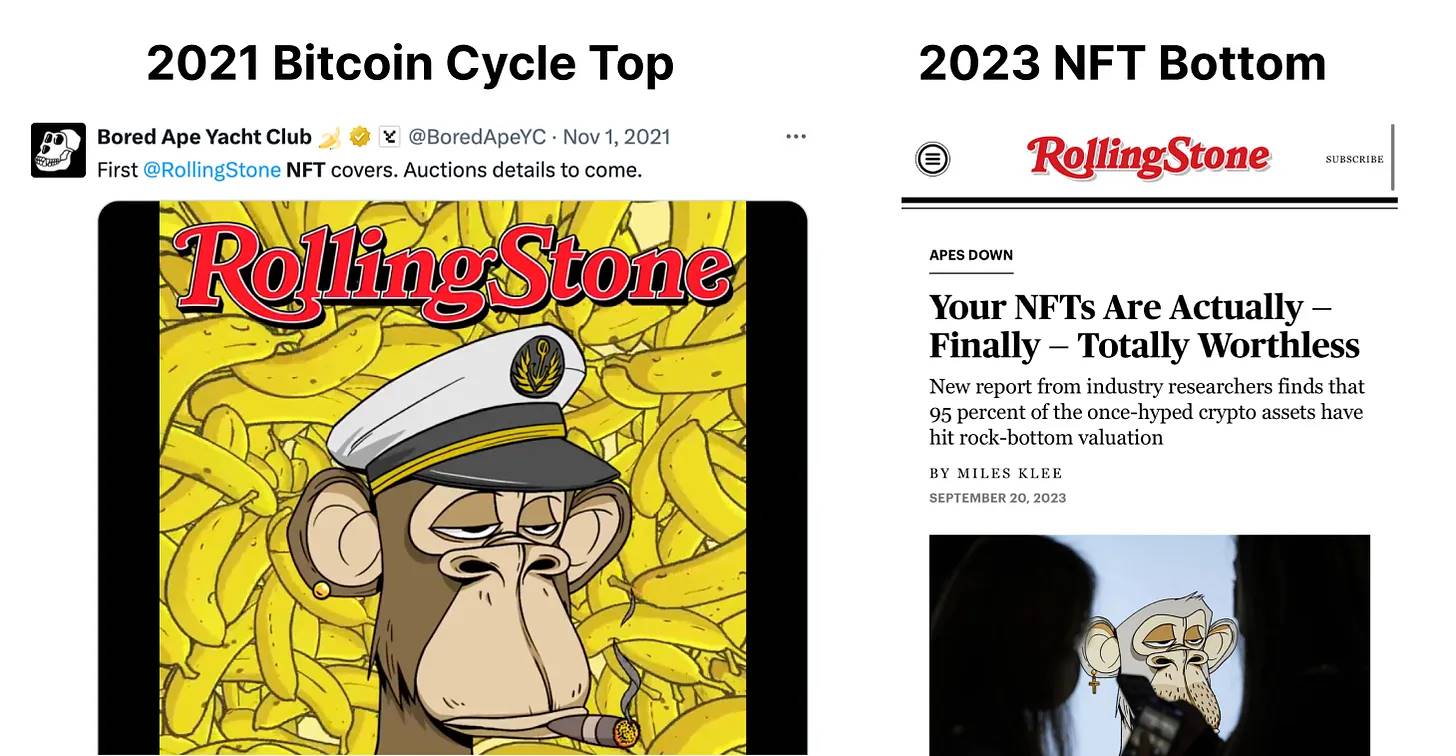
随着普通交易者看到比特币和加密货币在主要新闻频道的普及,加密货币频道可能成为非加密用户获取信息的主要来源。反向操作主流媒体信息也可能是接近市场顶部时出售的有效策略——《滚石》杂志在 NFT 熊市底部时就曾是一个很好的指示。
其他需要关注的指标:
比特币减半事件与历史最高点之间的时间差——供应冲击已被嵌入市场的需求动态中,比特币矿工也持有大量库存。
技术分析指标如 RSI、Pi 和 MACD 表明某些加密资产可能被超卖或低买。
市场价值与实现价值比率:通常 3.7 的比率意味着加密市场的周期顶部。需要将市场价格与实现价值(即最后一次链上交易价格的加权平均值)进行比较。
请查看最新的现代市场节目以获取更广泛的讨论。
我将逐步整理一份分析报告来追踪这些指标,并会每周为您提供更新——请持续关注。


