
为什么ETF每日数据值得关注,和市场有何关系?
原创 | Odaily星球日报
作者 | jk
近日,比特币 ETF 市场的活跃度引起了投资者的广泛关注。众多产品如 BlackRock 的 IBIT、Grayscale Bitcoin Trust 的 GBTC、Fidelity 的 FBTC、以及 Ark Invest/21 Shares 的 ARKB 等,均在交易所上表现出完全的波动特征。在比特币一路走高,加密市场进入牛市之际,各大比特币 ETF 的成交量数据成为了市场情绪的晴雨表。
Odaily星球日报一直持续跟踪比特币现货 ETF 的相关数据。可以看到,近日的 ETF 随着比特币价格表现持续走高,出现大量的资金流入,势头完全盖过了 GBTC 的净流出量。同时,随着购买热情增长,各大管理公司所持有的比特币也完全是水涨船高。CoinShares 研究主管 James Butterfill 表示,数字资产 ETF / ETP 今年迄今的净流入资金超 120 亿美元,打破了 2021 年全年净流入 106 亿美元的历史纪录,然而今年仅仅过去了一个季度而已。
同时,比特币 ETF 相关的数据已经实现了数个新高:贝莱德现货比特币 ETF(IBIT)持仓量达到 223, 645.98255 BTC(超过比特币 2100 万枚理论最大供应量的 1% ),市值超过 160 亿美元,创下新高;美国当地时间时间 3 月 12 日比特币现货 ETF 总净流入 10.5 亿美元,创下 ETF 首个交易日以来的单日净流入历史新高,相较于次高点(2 月 28 日单日净流入 6.73 亿美元)增加约 56% ;比特币 ETF(包括现货和期货 ETF)总市值为 601.43 亿美元,总资产管理规模(AUM)为 553.74 亿美元。
数据概览
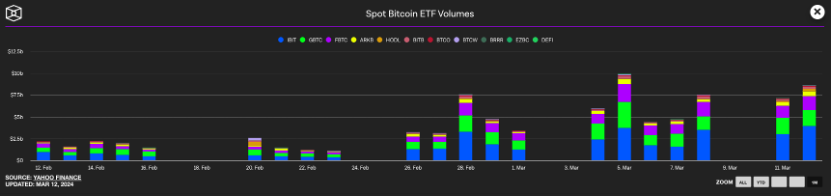
现货比特币 ETF 每日成交量,来源:The Block
图中涵盖了新批准的比特币现货 ETF 进一个月的全部成交量。可以看到,自二月底以来,也就是比特币从五万美元左右的价格坐火箭般上涨之前,每日的交易量就开始攀升,且以贝莱德的 IBIT 为最高(图中蓝色部分),GBTC 排在第二(图中绿色部分),据估计是大部分投资人获利出货,因为在意管理费的投资者可能在刚批准的时候就已经离场了。富达的 FBTC 排在第三位。
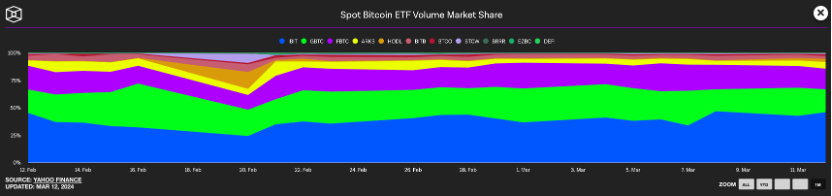
现货比特币 ETF 市场占有率,来源:The Block
从市场占比来说,也很符合我们从成交量里看到的比例:从二月中开始有一段明显的下滑,其中 VanEck 的 HODL 占比逐渐上升;但自那之后,就恢复了 IBIT 第一,GBTC 第二,FBTC 第三的位置,Ark 等小玩家紧随其后,且在牛市之后,贝莱德的 IBIT 占比还出现了大幅提升,从此前的 33% 左右跃升至如今的 45% 左右。
综合来看,比特币现货 ETF 自推出以来累计净流入 118.288 亿美元。其中:
-IBIT 累计净流入 120.278 亿美元;
-FBTC 累计净流入 67.033 亿美元;
-BITB 累计净流入 14.313 亿美元;
-ARKB 累计净流入 19.705 亿美元;
-GBTC 累计净流出 114.026 亿美元。
就这个数据可以看出,净流入的势头已经明显盖住了 ETF 刚获得批准的时候从灰度出现的净流出,仅仅 IBIT 一家的净流入就已经能够覆盖 GBTC 的流出数据了。按照每日流量的数据来看,是这样的:
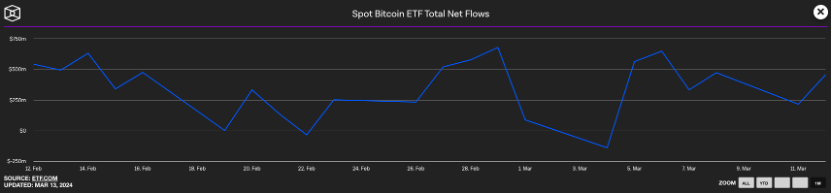
比特币总净流入数据,来源:The Block
可以看到,在最近一个月的单日净流入数据中,仅有寥寥几天出于净流出的状态,且幅度较小。其他时候,整个市场均处于净流入状态,基本上之前对于 GBTC 是否会大幅度抛售砸盘并影响价格的问题已经少有人再提起了。
据链上分析师余烬统计,目前十支 BTC 现货 ETF 的 BTC 总持有量突破 80 万枚,占 BTC 总量的 3.8% 。灰度(GBTC)在十支 BTC 现货 ETF 中的体量占比已经下降到 50% 以下,BTC 持仓跌破 40 万枚。灰度(GBTC)对市场的影响力已经越来越小。贝莱德(IBIT)和富达(FBTC)两家的 BTC 持有量就已经达到 32 万枚(231 亿美元),即将超过灰度(GBTC)。
其次,目前市场上就比特币现货 ETF 和比特币现货价格的关系出现了两种理论:到底是 ETF 的资金流入推高了比特币价格,还是比特币价格因为其他原因的升高带动了 ETF 的资金流入?两者显然是相辅相成的,但是目前这个类似于先有鸡还是先有蛋的问题显然还没有一个定论。从时间上看,比特币价格开始上扬和交易量开始增高都开始于美国当地时间的 2 月 26 日,相差非常小,很难从时间上得出结论。但是,在牛市中若 ETF 数据的增速放缓,可能代表目前牛市吸引的投资者的投资热情已经过度被消耗,或预示阶段性高点。
综观当前比特币 ETF 的成交量趋势,从各类数据的波动中,我们可以一窥投资者信心和市场热度的微妙变化。虽然未来的市场表现充满不确定性,但通过紧密跟踪这些关键数据,投资者和分析师们可以更好地洞察市场脉络,把握投资时机。比特币 ETF 的表现将持续成为 Odaily星球日报观察的重点。


