
加密市场情绪研究报告(2024.02.16-02.23):探寻WLD与JASMY背后推动币价飙升的力量
探寻 WLD 与 JASMY 背后推动币价飙升的力量
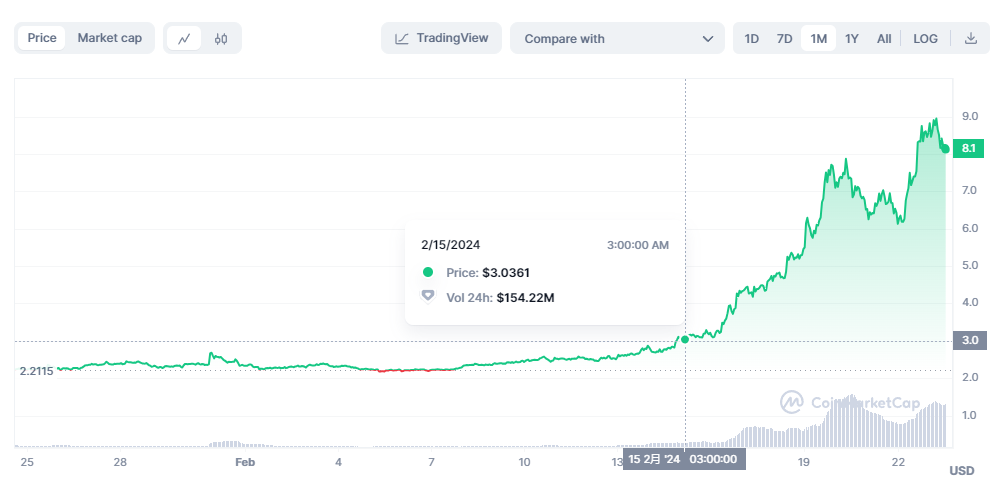
WLD 最近一个月价格走势
WLD 在 2.15 从 3 美金开始启动, 2.22 最高冲破 9 美金。
OpenAI 于 2 月 15 日发布了新的人工智能模型 SORA,能够根据用户输入的文本生成质量惊人的短影片,带动 AI 板块大涨,
英伟达(NVIDIA)在周三盘后公布 2024 财年Q4季度,在 2.21 周三盘前有大量获利了结盘导致股价盘前下跌-2.85% ,随后财报营收全部超预期,Q4季度营收达 221 亿美元(净利 122 亿美元),比上一季度增长 22% ,比上一年增长 265% , 2.22 当日上涨 16.4% 。
总结而言,AI 与高性能计算已成为未来最好的故事,然而主要注意的是实际上 Worldcoin 与 Sora 可说是完全不相同的两个项目,目前 OpenAI 与 Worldcoin 官方也并未宣布任何相关的技术合作。
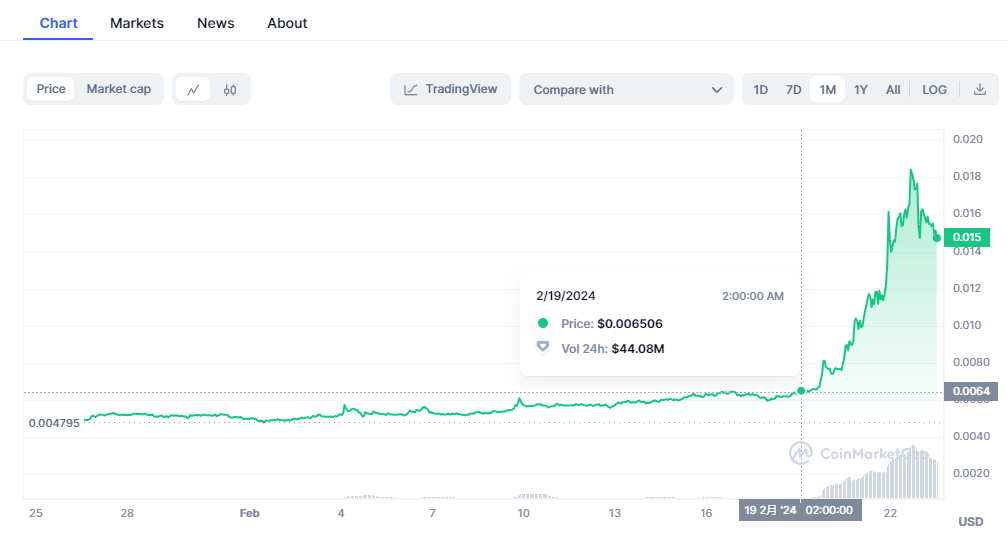
JASMY 最近一个月价格走势
Jasmy(日本的比特币) 从 2.19 的 0.0065 飙升至 2.22 的最高 0.018 ,主要受益于日本政府对区块链的积极扶持和发展。日本出台的法律法规允许合法合规的区块链投资,证明了发达金融地区如美国、日本和香港对加密资产的投资与发展给予了支持。此外,日本的宏观环境也为 Jasmy 的上涨助力,日元持续贬值,日经指数创下了泡沫经济以来的新高,吸引了大量资金追捧 Jasmy。”。
以上属于事件与环境分析,在面对当前市场过热产生的 Fomo 情绪,市场投资者需要做好风险控制与谨慎判断。
比特币减半距离今天(2024.02.23)还有约 61 天
减半倒计时:https://www.nicehash.com/countdown/btc-halving-2024-05-10-12-00?_360safeparam=1289146171
市场技术与情绪环境分析
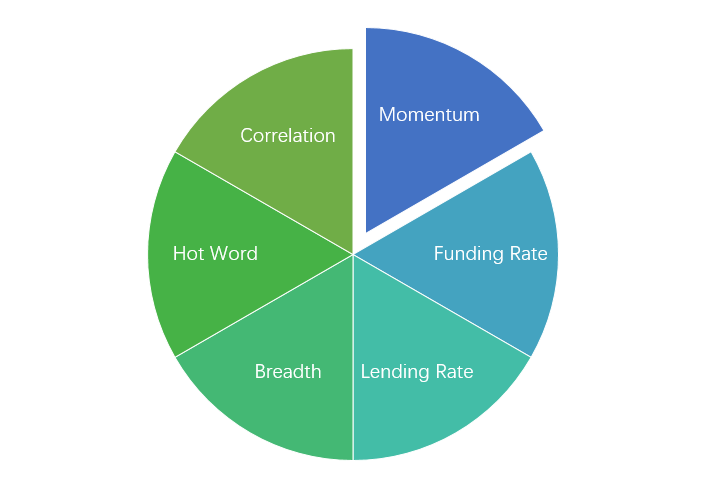
情绪分析组成
技术指标
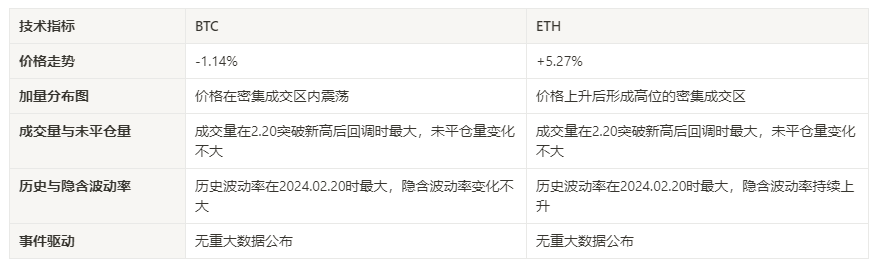
价格走势
过去一周 BTC 价格下跌-1.14% ,ETH 价格上涨 5.27% 。
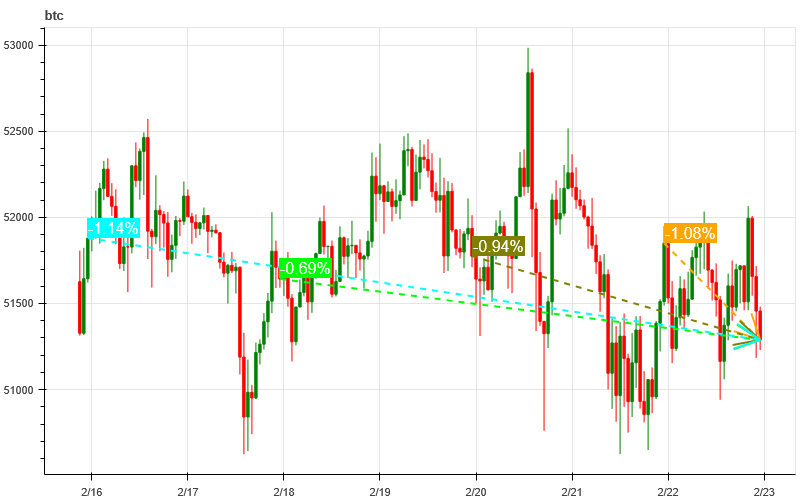
上图是 BTC 过去一周的价格图
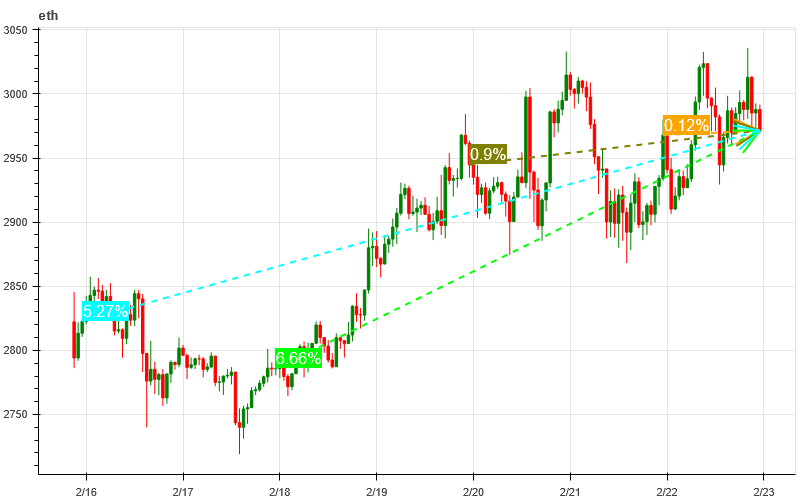
上图是 ETH 过去一周的价格图
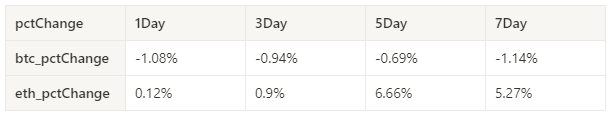
表格显示过去一个周的价格变化率
价量分布图(支撑阻力)
过去一周 BTC 价格在密集成交区内震荡,ETH 价格上升后形成高位的密集成交区。
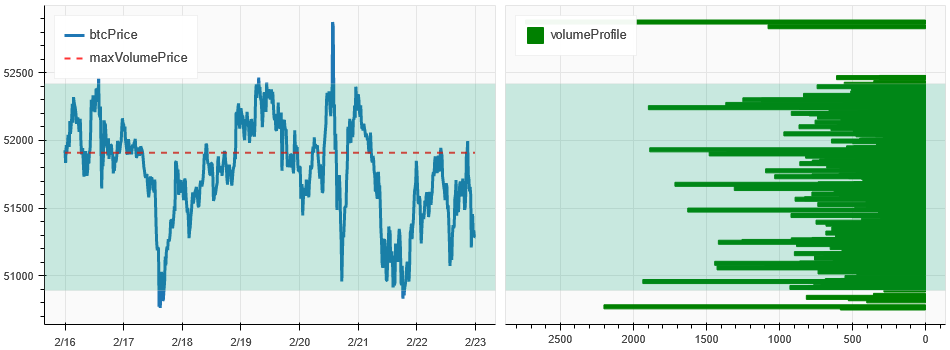
上图是 BTC 过去一周的密集成交区分布图
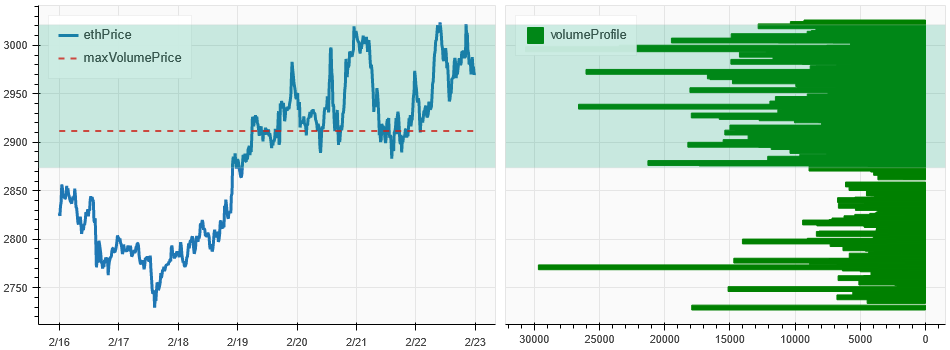
上图是 ETH 过去一周的密集成交区分布图
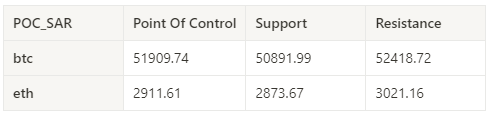
表格显示 BTC 与 ETH 过去一周中每周的密集成交区间
成交量与未平仓量
过去一周 BTC 与 ETH 成交量在 2.20 突破新高后回调时最大;未平仓量 BTC 与 ETH 变化不大。
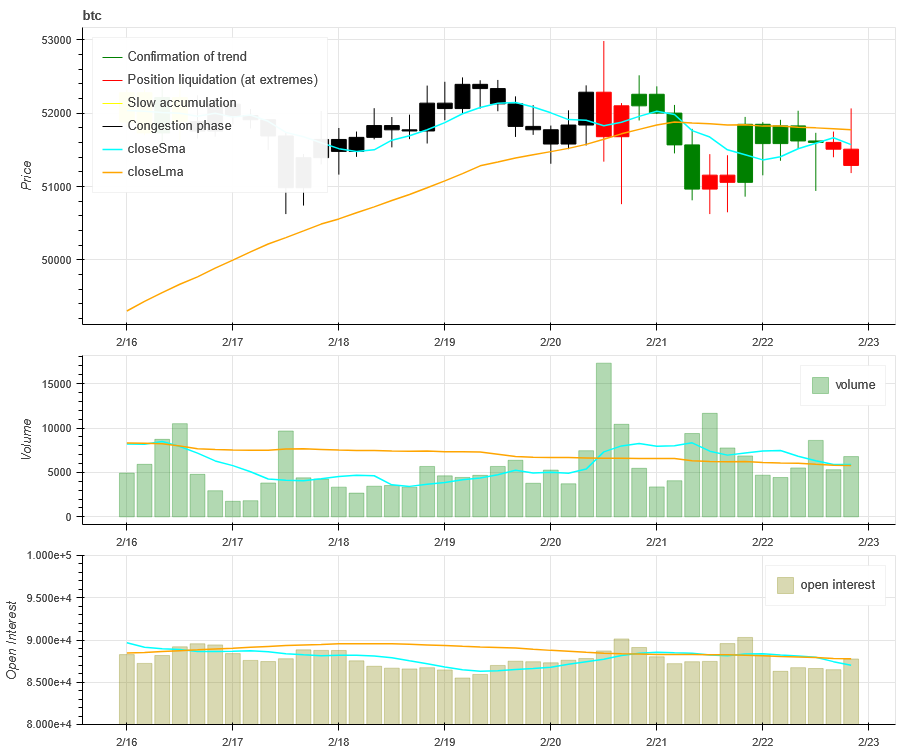
上图最上方 BTC 的价格走势,中间是成交量、最下方是未平仓量、浅蓝色是 1 天均值,橘色是 7 天均值。其中 K 线的颜色代表当前的状态,绿色是价格上升有成交量支持,红色是在平仓,黄色是在缓慢累积仓位,黑色是拥挤状态。
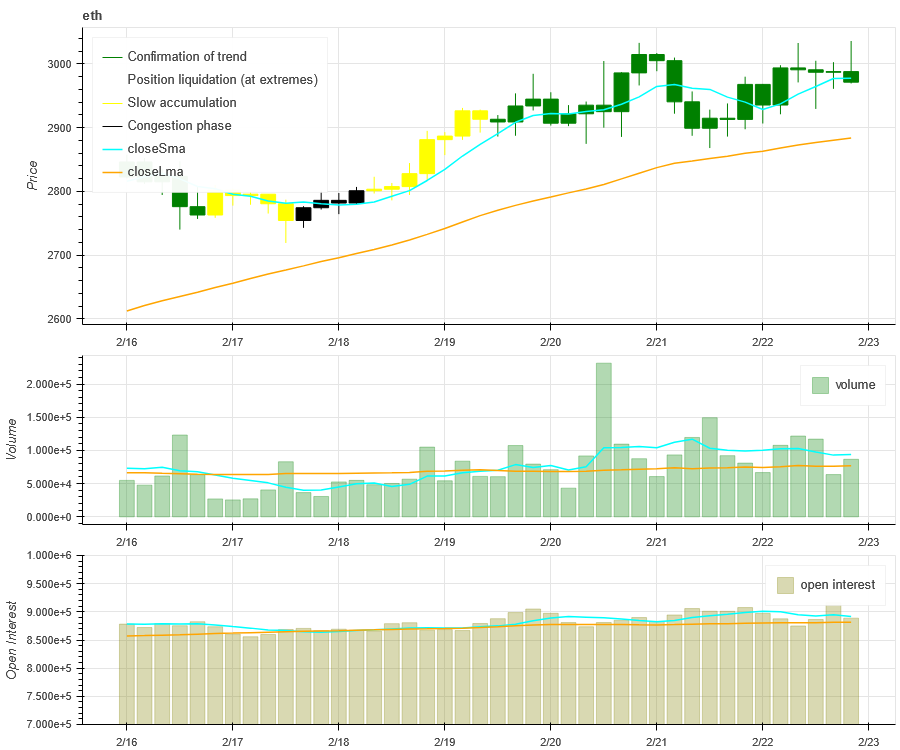
上图最上方 ETH 的价格走势,中间是成交量、最下方是未平仓量、浅蓝色是 1 天均值,橘色是 7 天均值。其中 K 线的颜色代表当前的状态,绿色是价格上升有成交量支持,红色是在平仓,黄色是在缓慢累积仓位,黑色是拥挤状态。
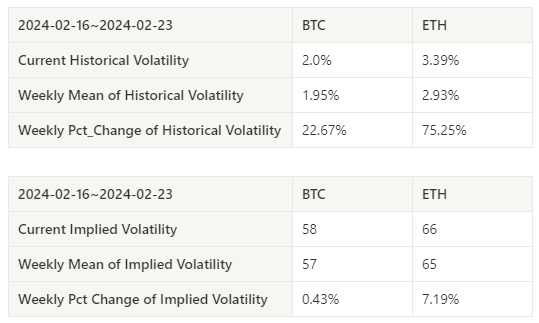
历史波动率与隐含波动率
过去一周历史波动率 BTC 与 ETH 都在 2024.02.20 时最大;隐含波动率 BTC 变化不大,ETH 持续上升。
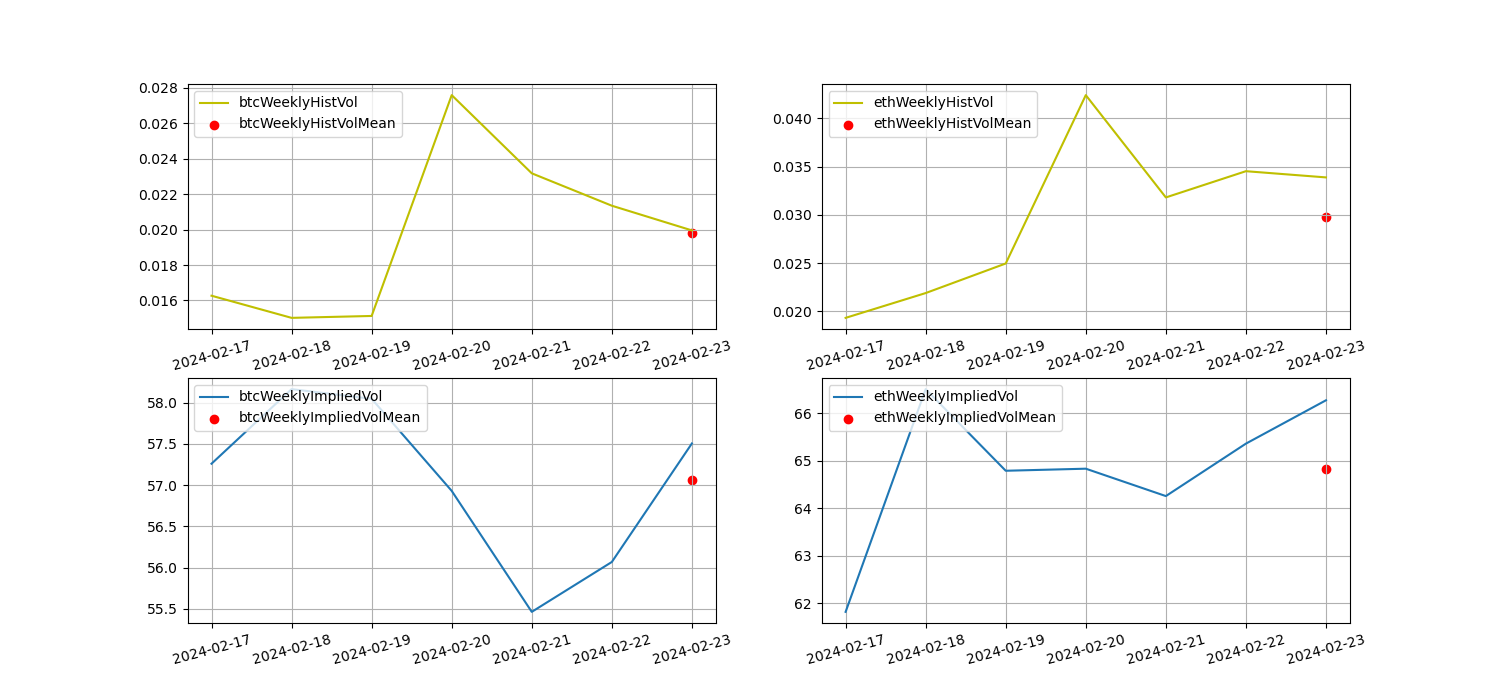
黄色线为历史波动率,蓝色线为隐含波动率,红点是其 7 日平均
事件驱动
本周无事件数据。
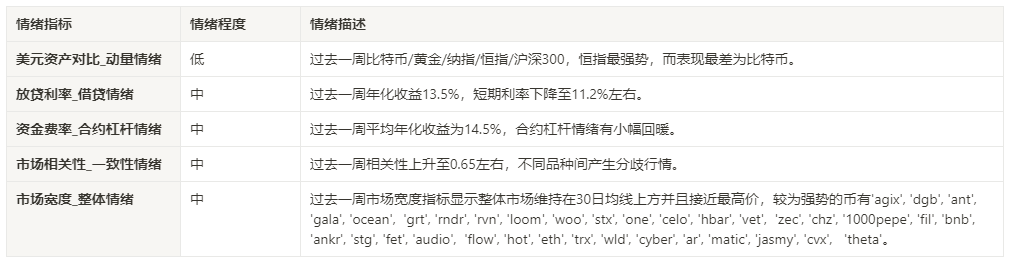
情绪指标
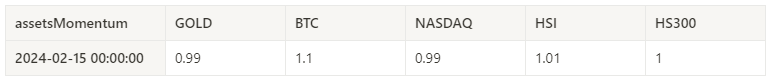
动量情绪
过去一周比特币/黄金/纳指/恒指/沪深 300 中,恒指最强势,而表现最差为比特币。
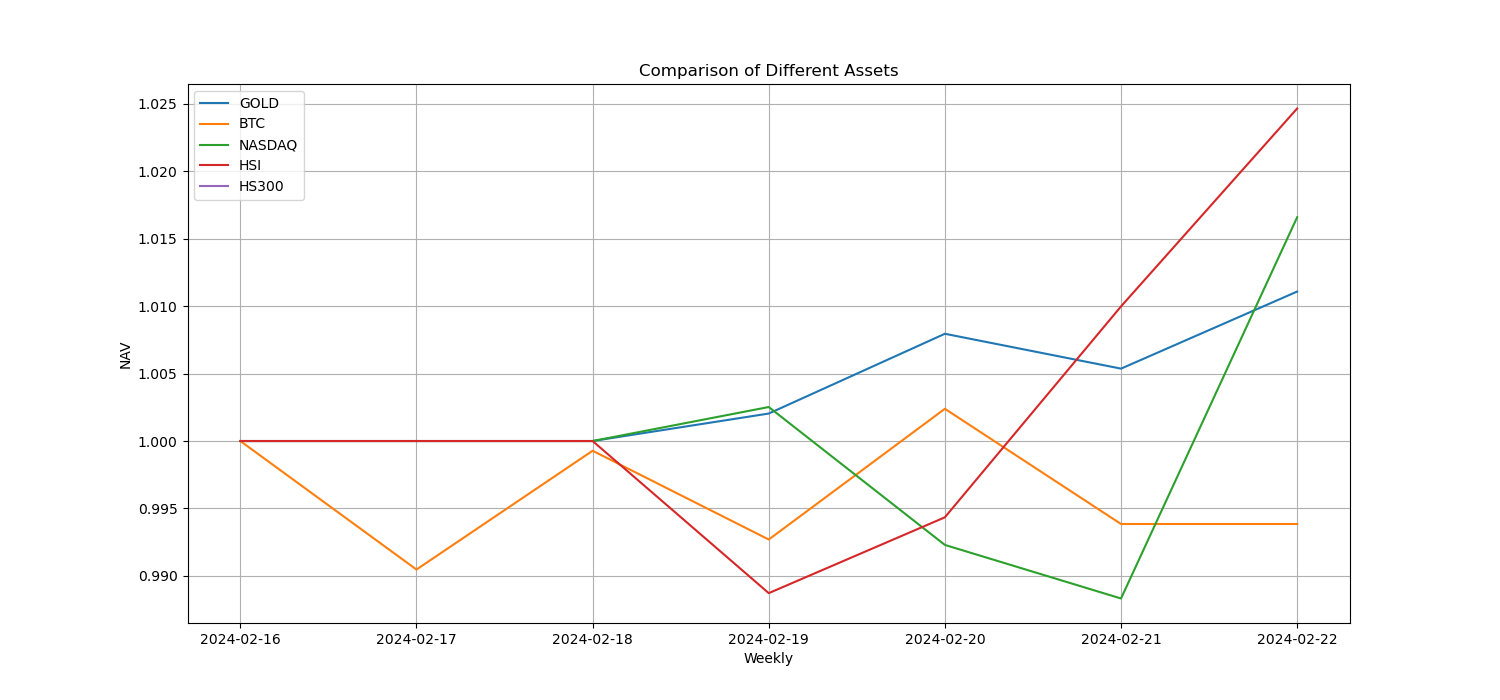
上图为不同资产过去一周的走势
放贷利率_借贷情绪
过去一周 USD 放贷年化收益平均为 13.5% ,短期利率维持下降至 11.2% 左右。
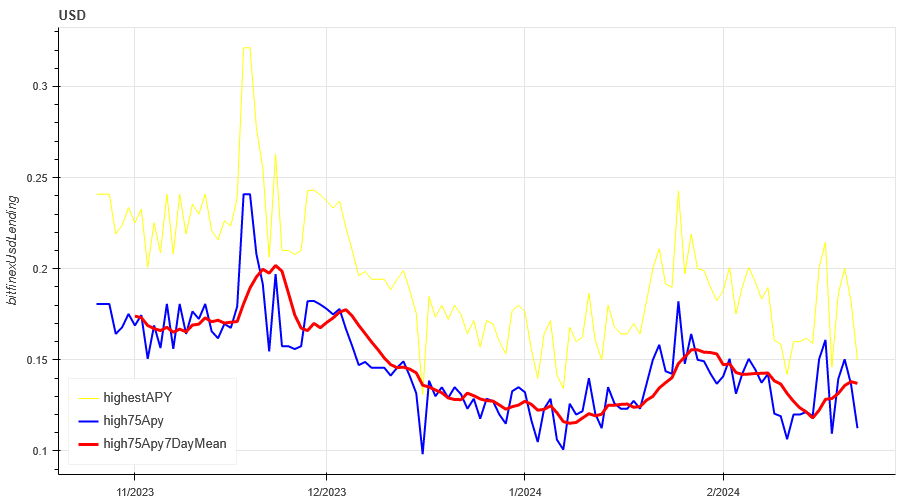
黄色线为 USD 利率的最高价,蓝色线为最高价的 75% ,红色线为最高价的 75% 的 7 天平均值
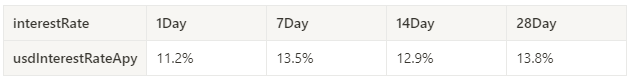
表格显示 USD 利率过去不同持有天数的平均收益
资金费率_合约杠杆情绪
过去一周 BTC 资费平均年化收益为 14.5% ,合约杠杆情绪有小幅回暖。
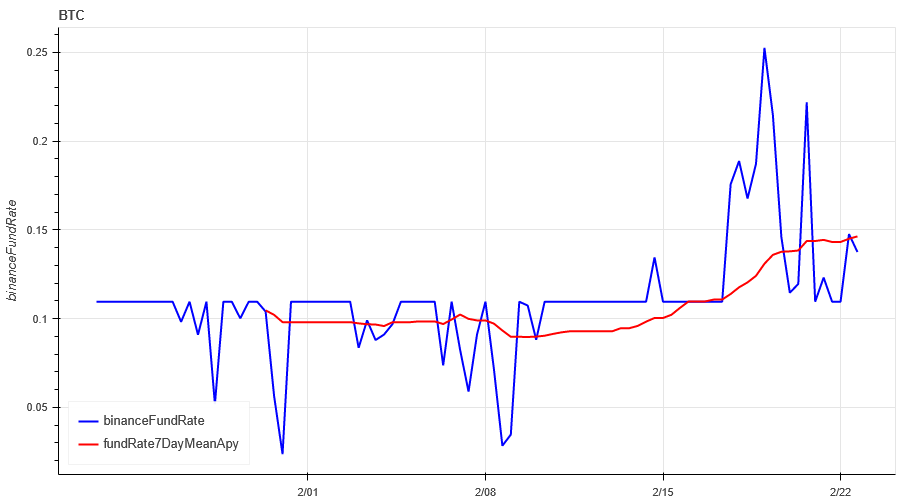
蓝色线为币安上 BTC 的资金费率,红色线为其 7 日平均
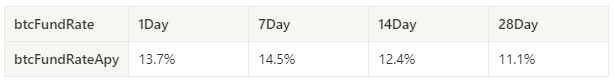
表格显示 BTC 的资费过去不同持有天数的平均收益
市场相关性_一致性情绪
过去一周选中的 129 个币中相关性下降至 0.65 左右,不同品种间产生分歧的行情。
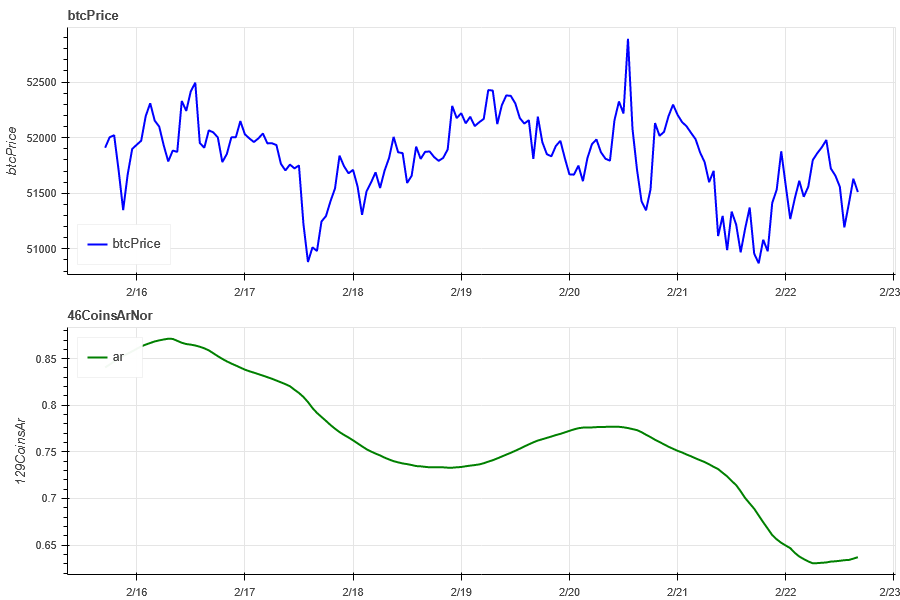
上图蓝色先为比特币价格,绿色线为['1000 floki', '1000 lunc', '1000 pepe', '1000 shib', '100 0x ec', '1inch', 'aave', 'ada', 'agix', 'algo', 'ankr', 'ant', 'ape', 'apt', 'arb', 'ar', 'astr', 'atom', 'audio', 'avax', 'axs', 'bal', 'band', 'bat', 'bch', 'bigtime', 'blur', 'bnb', 'btc', 'celo', 'cfx', 'chz', 'ckb', 'comp', 'crv', 'cvx', 'cyber', 'dash', 'dgb', 'doge', 'dot', 'dydx', 'egld', 'enj', 'ens', 'eos','etc', 'eth', 'fet', 'fil', 'flow', 'ftm', 'fxs', 'gala', 'gmt', 'gmx', 'grt', 'hbar', 'hot', 'icp', 'icx', 'imx', 'inj', 'iost', 'iotx', 'jasmy', 'kava', 'klay', 'ksm', 'ldo', 'link', 'loom', 'lpt', 'lqty', 'lrc', 'ltc', 'luna 2', 'magic', 'mana', 'matic', 'meme', 'mina', 'mkr', 'near', 'neo', 'ocean', 'one', 'ont', 'op', 'pendle', 'qnt', 'qtum', 'rndr', 'rose', 'rune', 'rvn', 'sand', 'sei', 'sfp', 'skl', 'snx', 'sol', 'ssv', 'stg', 'storj', 'stx', 'sui', 'sushi', 'sxp', 'theta', 'tia', 'trx', 't', 'uma', 'uni', 'vet', 'waves', 'wld', 'woo', 'xem', 'xlm', 'xmr', 'xrp', 'xtz', 'yfi', 'zec', 'zen', 'zil', 'zrx’]整体的相关性
市场宽度_整体情绪
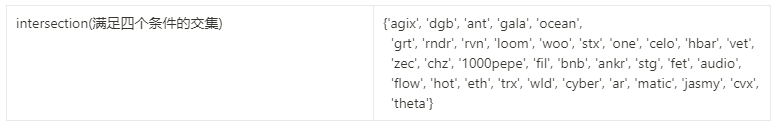
过去一周选中的 129 个币,价格在 30 日均线上方的占比为 85% ,相对 BTC 价格在 30 日均线上方占比为 36% ,距离过去 30 天最低价大于 20% 的占比为 42% ,距离过去 30 天最高价小于 10% 的占比为 73% ,过去一周市场宽度指标显示整体市场维持在 30 日均线上方并且接近最高价,较为强势的币有'agix', 'dgb', 'ant', 'gala', 'ocean', 'grt', 'rndr', 'rvn', 'loom', 'woo', 'stx', 'one', 'celo', 'hbar', 'vet', 'zec', 'chz', '1000 pepe', 'fil', 'bnb', 'ankr', 'stg', 'fet', 'audio', 'flow', 'hot', 'eth', 'trx', 'wld', 'cyber', 'ar', 'matic', 'jasmy', 'cvx', 'theta'。
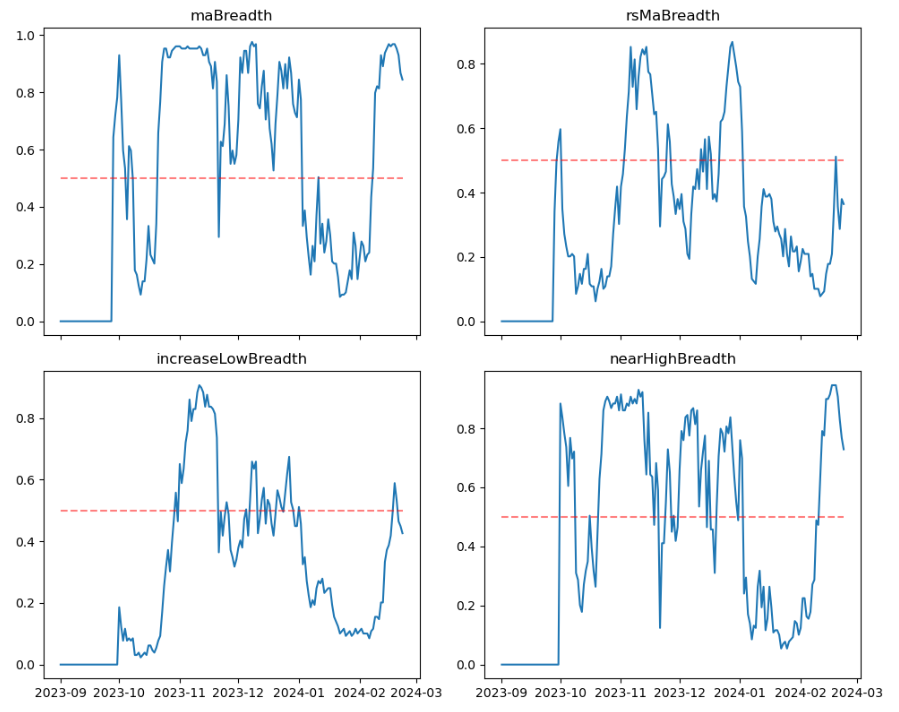
上图为['1000 floki', '1000 lunc', '1000 pepe', '1000 shib', '100 0x ec', '1inch', 'aave', 'ada', 'agix', 'algo', 'ankr', 'ant', 'ape', 'apt', 'arb', 'ar', 'astr', 'atom', 'audio', 'avax', 'axs', 'bal', 'band', 'bat', 'bch', 'bigtime', 'blur', 'bnb', 'btc', 'celo', 'cfx', 'chz', 'ckb', 'comp', 'crv', 'cvx', 'cyber', 'dash', 'dgb', 'doge', 'dot', 'dydx', 'egld', 'enj', 'ens', 'eos','etc', 'eth', 'fet', 'fil', 'flow', 'ftm', 'fxs', 'gala', 'gmt', 'gmx', 'grt', 'hbar', 'hot', 'icp', 'icx', 'imx', 'inj', 'iost', 'iotx', 'jasmy', 'kava', 'klay', 'ksm', 'ldo', 'link', 'loom', 'lpt', 'lqty', 'lrc', 'ltc', 'luna 2', 'magic', 'mana', 'matic', 'meme', 'mina', 'mkr', 'near', 'neo', 'ocean', 'one', 'ont', 'op', 'pendle', 'qnt', 'qtum', 'rndr', 'rose', 'rune', 'rvn', 'sand', 'sei', 'sfp', 'skl', 'snx', 'sol', 'ssv', 'stg', 'storj', 'stx', 'sui', 'sushi', 'sxp', 'theta', 'tia', 'trx', 't', 'uma', 'uni', 'vet', 'waves', 'wld', 'woo', 'xem', 'xlm', 'xmr', 'xrp', 'xtz', 'yfi', 'zec', 'zen', 'zil', 'zrx’] 30 日的各宽度指标占比
总结
本周行情 BTC 在区间震荡,ETH 上升后在高位震荡,历史波动率与成交量在 20 号价格创新高后回调时最大、未平仓量 BTC 无太大变化而 ETH 有小幅上升、隐含波动率 BTC 变化不大而 ETH 持续上升,主流币整体在高位盘整;资金费率有小幅回升;129 个币安市场宽度指标显示整体市场都维持在 30 日均线上方并且接近最高价,较为强势的币有'agix', 'dgb', 'ant', 'gala', 'ocean', 'grt', 'rndr', 'rvn', 'loom', 'woo', 'stx', 'one', 'celo', 'hbar', 'vet', 'zec', 'chz', '1000 pepe', 'fil', 'bnb', 'ankr', 'stg', 'fet', 'audio', 'flow', 'hot', 'eth', 'trx', 'wld', 'cyber', 'ar', 'matic', 'jasmy', 'cvx', 'theta';事件方面,本周无数据公布,等待下个月的非农数据。
Twitter: @DerivativesCN
Website: https://dcbot.ai/


