LD Capital宏观周报(1.15):乐观而又谨慎,QT成为市场焦点

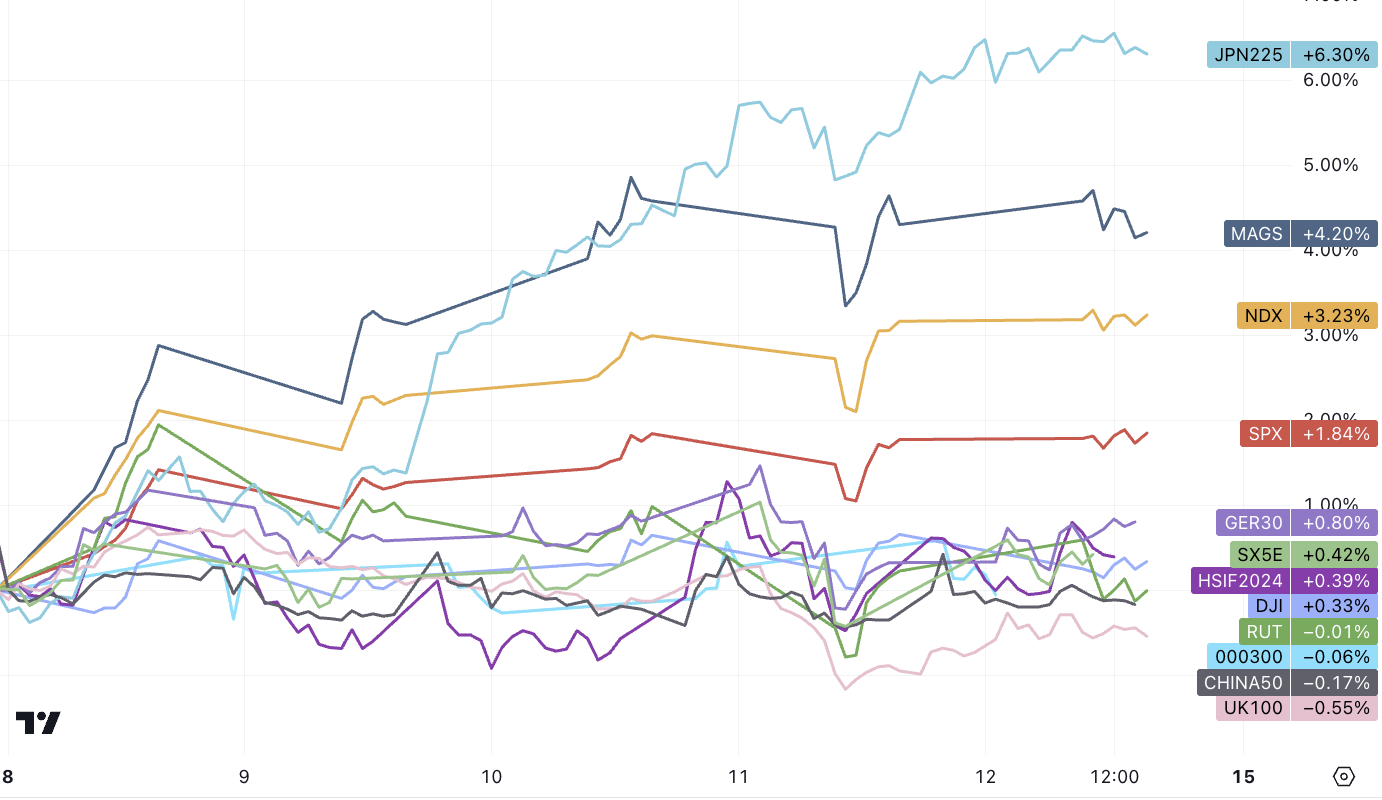
美股市场上周算是假期之后全面复工的第一周,市场转为乐观,标普涨 1.7% ,周五创下历史新高,纳斯达克涨 2.9% 。除了日本和印度外,亚太地区大部分股市下跌。强烈地震和乏善可陈的工资增长数据迫使市场参与者重新评估日银何时会将其货币政策正常化,日股大涨 6% 。欧洲 Stoxx 600 指数上涨约 0.8% ,如果能够维持,这将是自 12 月中旬以来的最大涨幅。宏观主题上降息概念已经过时,QT 缩减成为新的热点。因为再前一周我们观察到机构普遍看跌,尽管回调没有发生,但援引高盛交易台周末观点:我们认为有序的短期风险规避策略仍然有效。
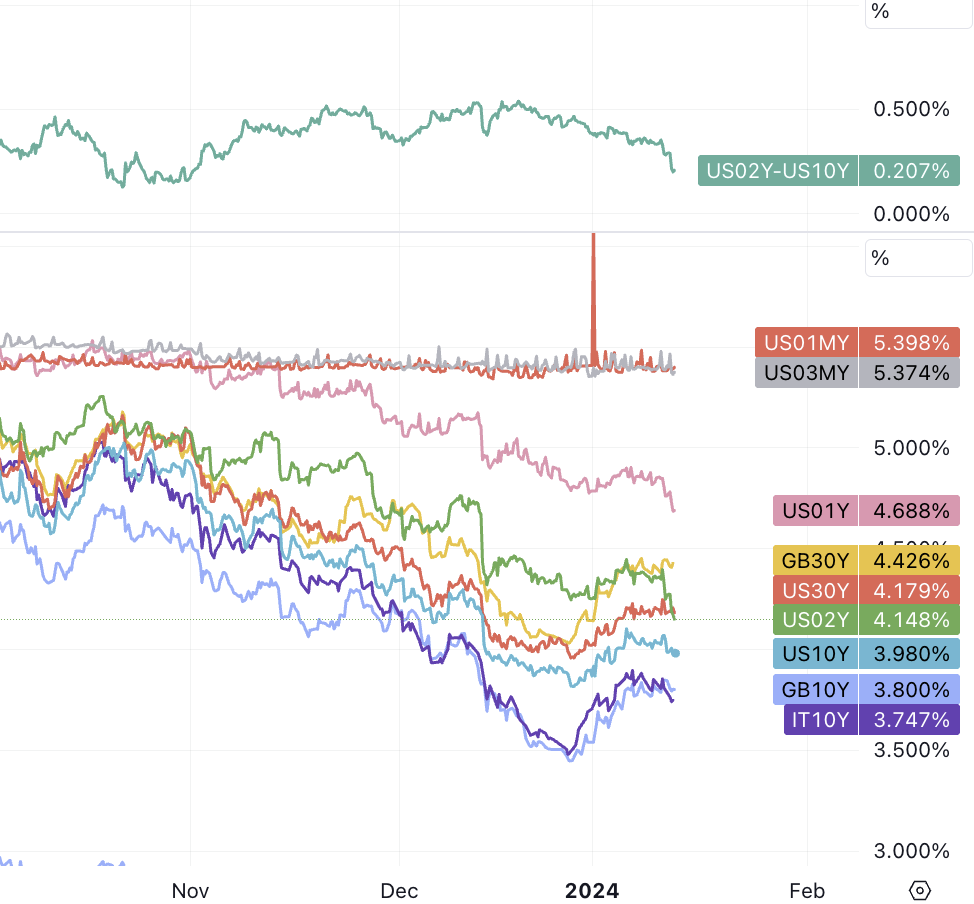
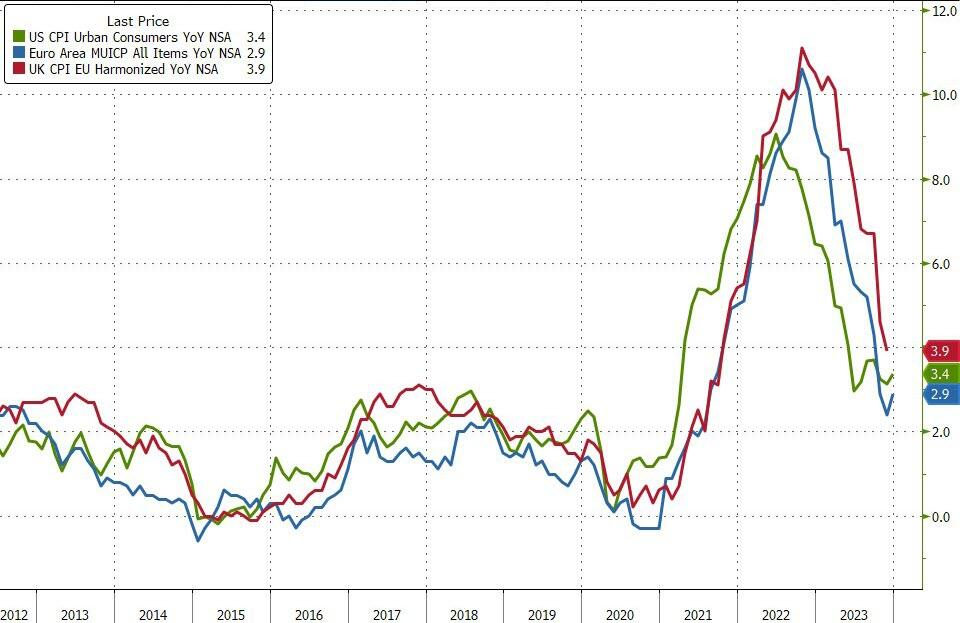
US CPI 超预期,PPI 不及预期,美国国债市场价格总体上涨,短久期收益率降幅大于长期,短期利率会下降的预期依旧高涨,利率期货预期 3 月降息概率为 77% ,较前周提升约 10 个百分点,隐含降息次数 6.5 次。过去 90 年里,美联储只有 5 次在核心 CPI(目前为 3.9% )高于失业率(3.7% )时降息。在这 5 次中,触发一次是战争(42 年 10 月),四次是经济衰退(69 年 10 月、 74 年 8 月、 80 年 5 月、 81 年 7 月)。所以接下来两个月如果失业率能有所回升(或者战争升级),对于 Fed 来说也会有一个很好理由进行预防性降息。
美元上周横盘。中国通胀再次下跌,进出口双降但贸易顺差扩大,贷款数据令人失望,人民币保持平稳。市场预期中国央行会在本周降低一年期基准利率。美国和英国对也门胡赛武装的打击帮助提升了石油和黄金价格,但总体推动有限。
美国通胀超预期不改变 3 月降息共识
CPI 12 月+ 3.4% VS 11 月+ 3.1% ,上涨的大部分是由服务成本,特别是住房成本推动的;核心 CPI 继续放缓,从 4% 降至 3.9% 。市场普遍认为通胀正处于下降趋势,尽管实际情况似乎更加复杂,比如航运和能源不再成为通缩叙事的拖累因素。本次 CPI 小幅反弹提醒人们,走完“最后一英里”可能需要耐心,但在行情上来看依旧被市场当做鸽派因素。
多数信号表明通胀将继续下行:
在 2022 年飙升之后,新租约的租金涨幅已放缓并基本正常化。然而,这一点尚未完全反映在住房消费物价指数中,住房消费物价指数往往落后于更及时的市场指标几个季度。
根据批发拍卖市场的情况,二手车价格将进一步下跌。
职位空缺和辞职率的下降表明劳动力市场正在降温,这将导致工资增长放缓,从而导致部分服务业通胀放缓。
影响实际通胀的消费者通胀预期正在走低。纽约联储上周发布的最新调查显示,一年期通胀预期为三年来最低。
领先指标 PPI 也低于预期,较上月意外下降 0.1% 。批发价格的下行压力应有助于降低消费者价格通胀。
中国连续通缩三个月
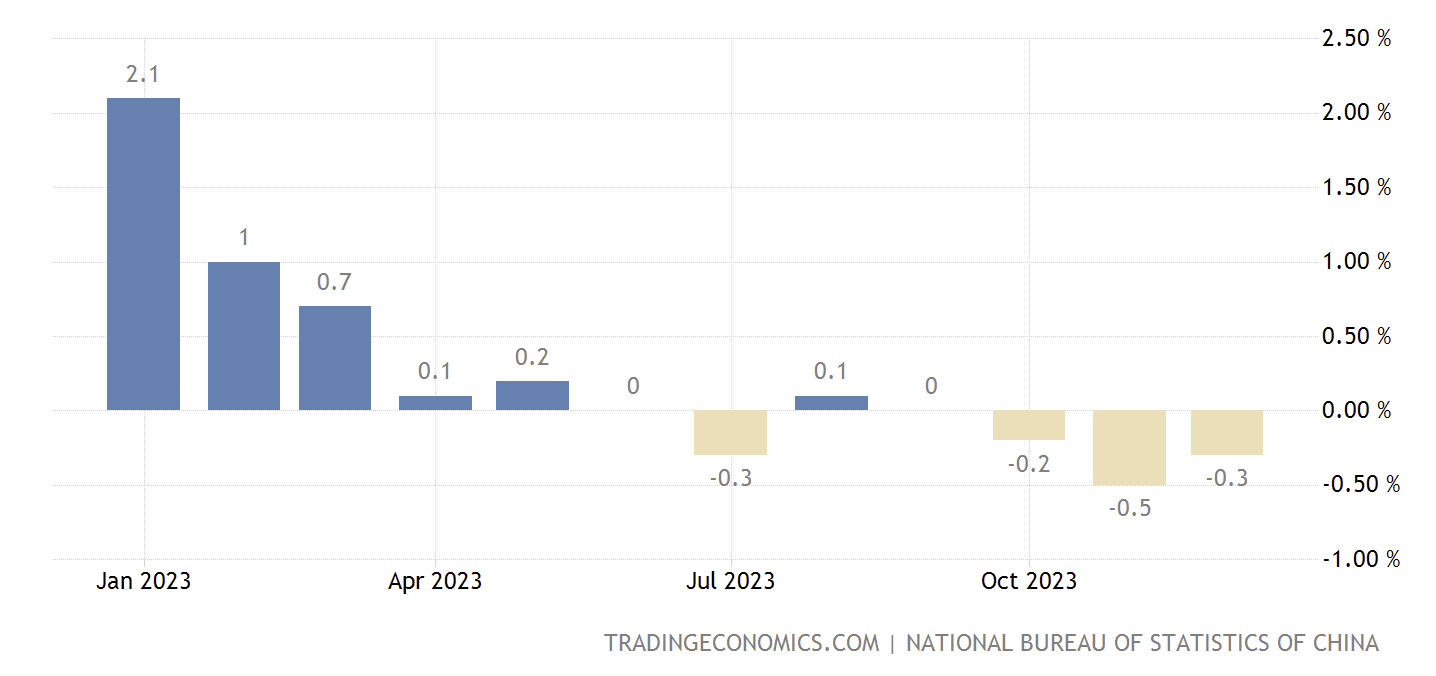
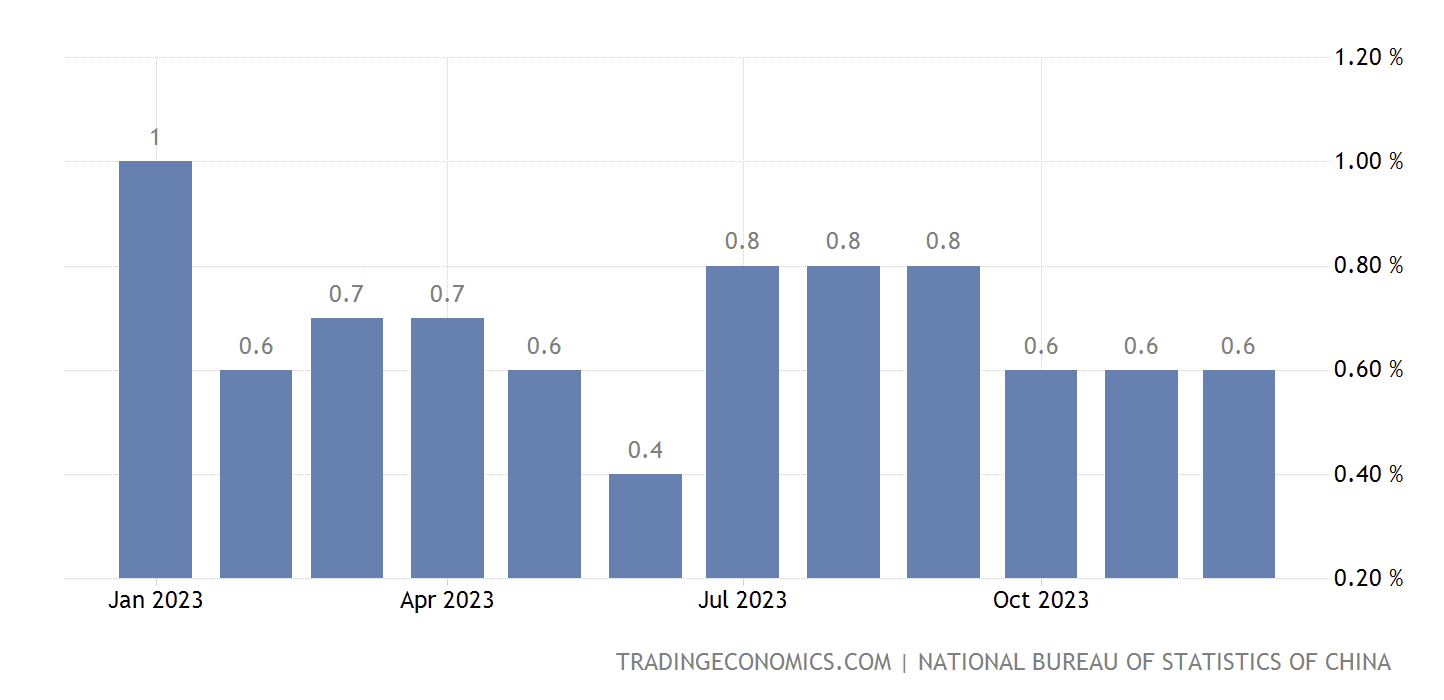
中国 12 月反映通胀的消费物价指数(CPI)同比收缩 0.3% ,为连续三个月陷入通缩。按全年计,中国 CPI 上涨 0.2% ,远低於国务院预期的 3% ,亦是中国自 2009 年以来最低的通胀率。与此同时,反映生产成本的生产者物价指数(PPI)更大跌 3% 。不过 CPI 的负贡献主要与食品有关,去除能源食品的核心通胀仍保持稳定。分析普遍认为人民银行可能很快会推出更多宽松措施,包括降息和降准。目前为止,被动的政策宽松未能抵消住房和地方政府融资平台去杠杆带来的强劲紧缩效应,构成了事实上的财政紧缩,也成为中国经济的下行压力。
名义:
核心:
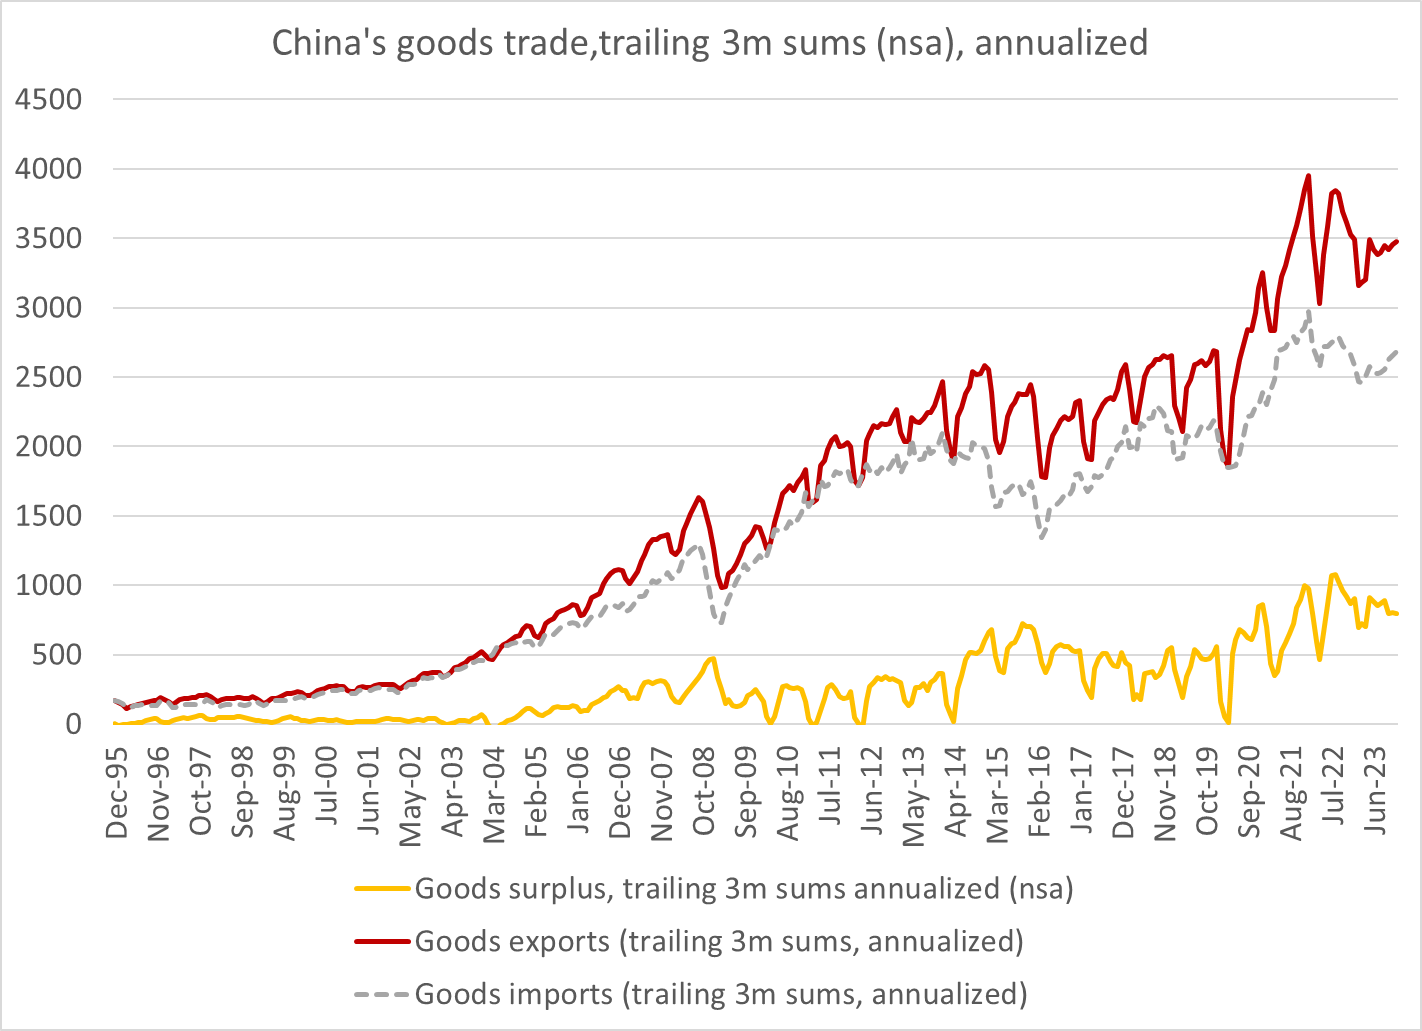
海关数据: 2023 年中国出口七年来首次下降,但不至于悲观
周五(1 月 12 日)公布的中国海关数据显示,由于全球对中国制造商品(除汽车外)的需求放缓,中国全年出口自 2016 年以来首次出现下降。
去年,中国向世界其他地区销售了价值 3.38 万亿美元的商品,比上年同期的纪录下降了 4.6% 。中国上一次出现出口量下降是在 2016 年,当时下降了 7.7% 。
不过 3.38 万亿这个数字仍然比比疫情爆发前多出约 1 万亿美元。另外在电动车、锂电池和太阳能电等“新三样”产品出口表现突出。
与此同时,中俄贸易额达到 2401 亿美元, 2023 年再创历史新高,比 2022 年增长 26.3% 。
去年中国的进口也下降了 5.5% ,降至 2.56 万亿美元。这使得中国 2023 全出现了 8230 亿美元的贸易顺差基本与前年的历史高点一致。
考虑到本身全球需求疲软的背景, 2023 中国出口疲软的结果是可以理解的,尽管政治上去中国化的声音此起彼伏,但结构上去中国化短期内还实现不了。
季度中国 trade balance,事实上特朗普时代以来贸易量和顺差都在上升:
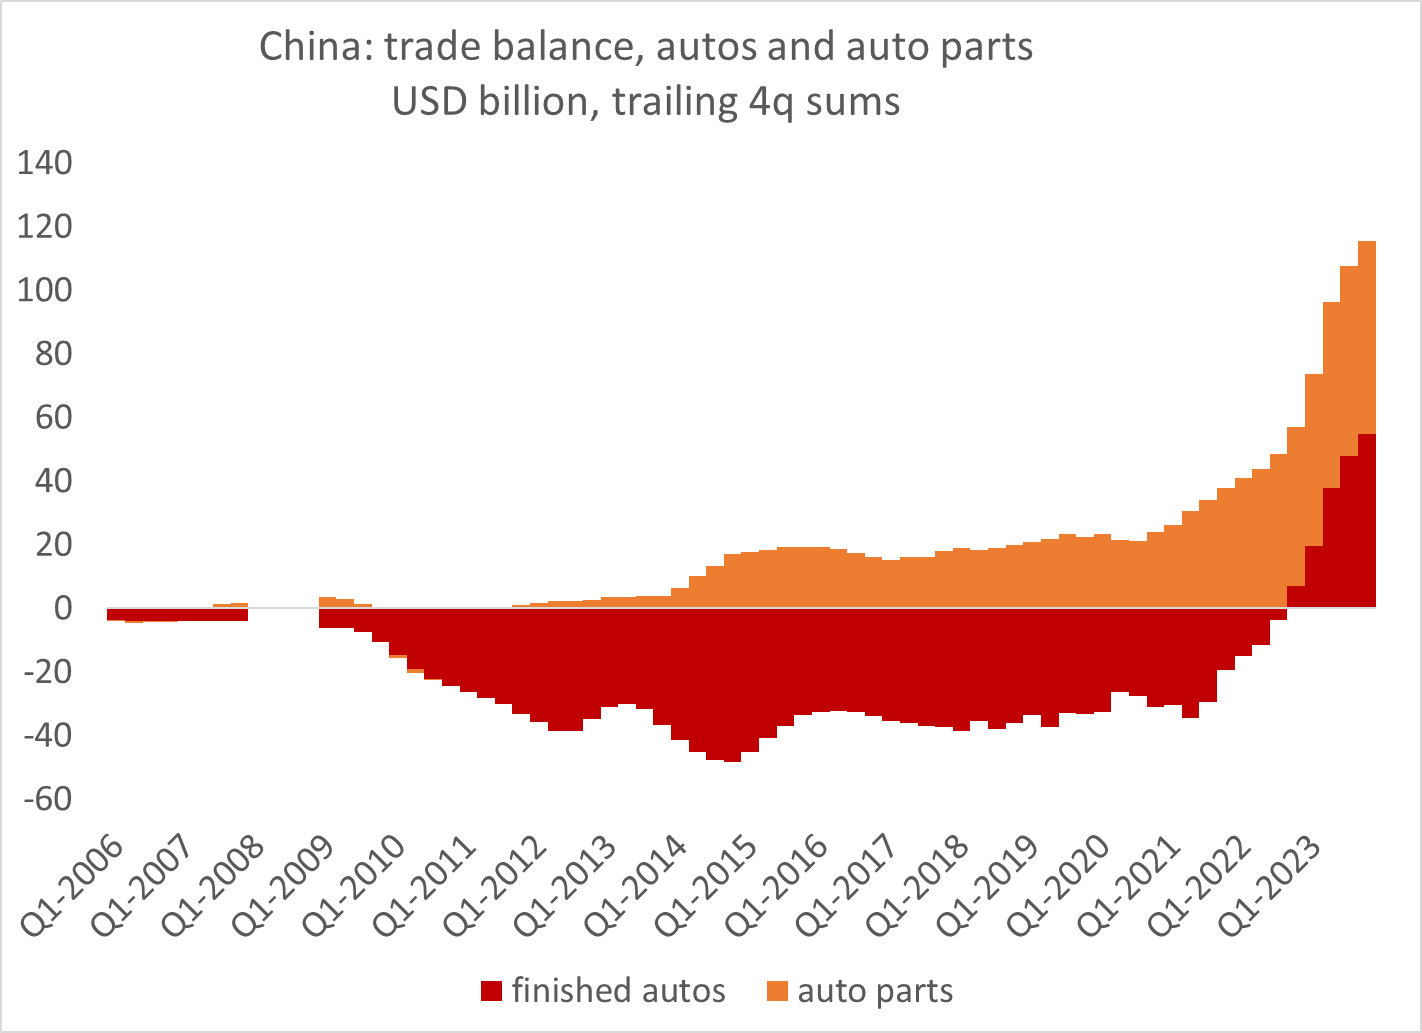
中国汽车及汽配贸易 balance:
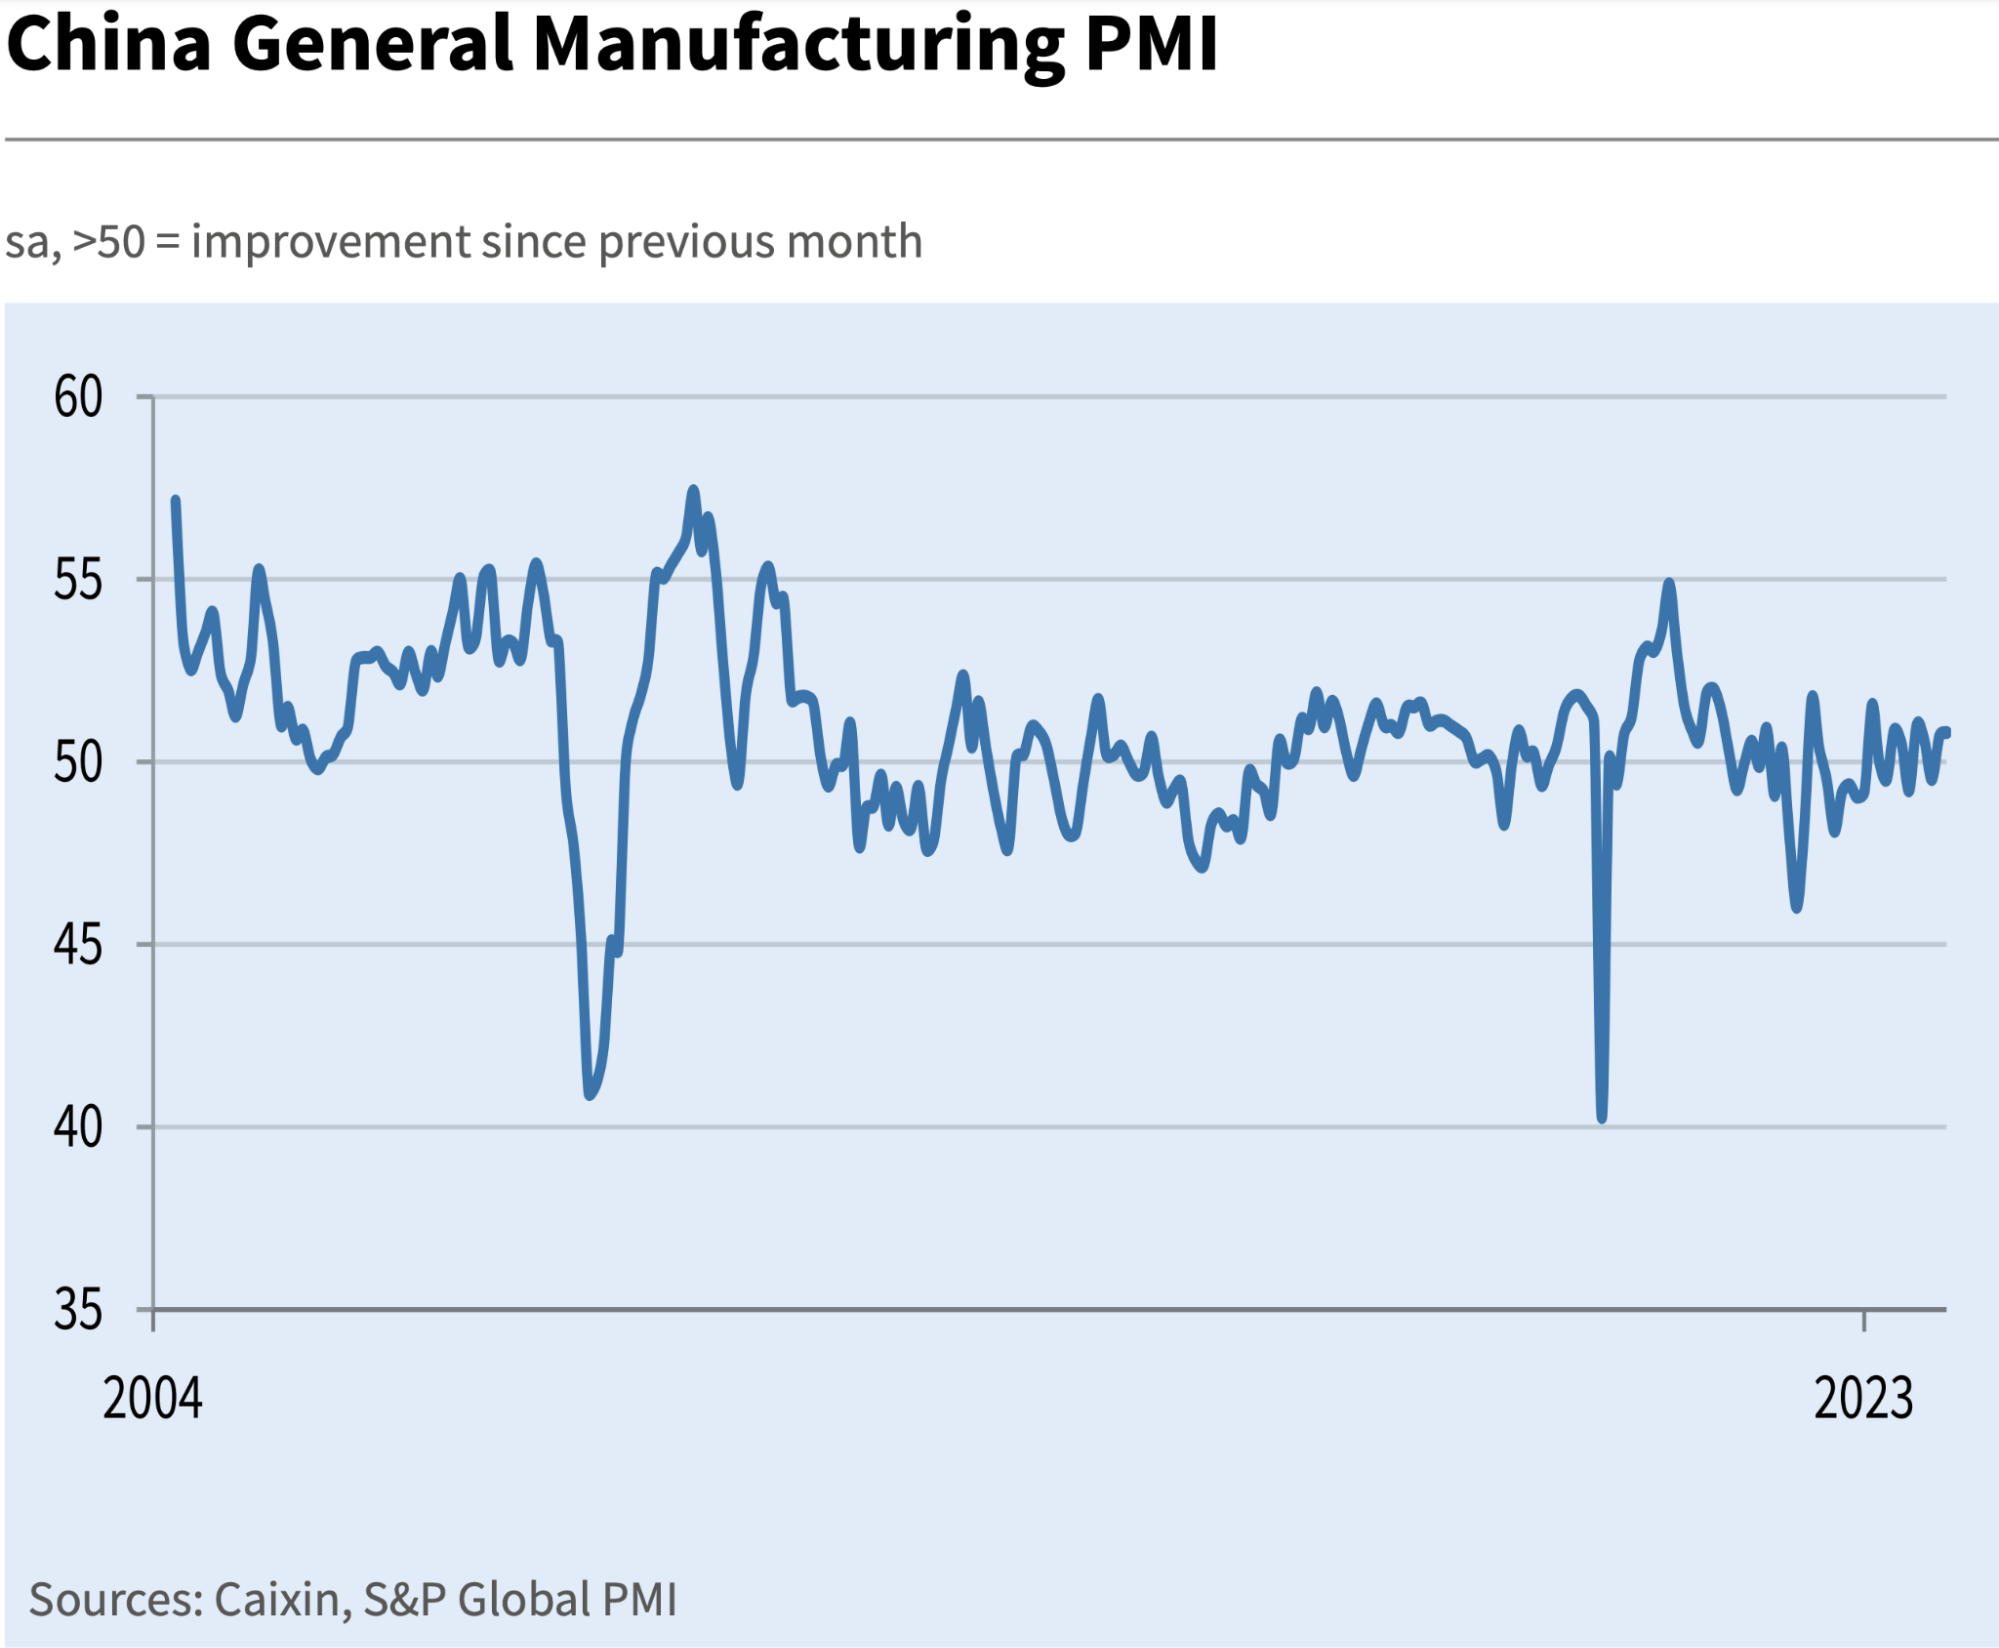
Caixin PMI 12 月实际正处于 6 个月来最快的扩张速度,从媒体报道上来看越来越多的海外机构正在或已经承认中国资产正处于很便宜的时期(尽管什么时候反弹不清楚),对中国的悲观情绪可能正在触底,不过很多抄底者似乎在等待一项规模接近 2008 年全球金融危机期间推出的大规模经济刺激计划宣布后再入市,最近一次大规模刺激是央行 12 月份通过质押式补充贷款(PSL)向政策性银行发放了 3500 亿元人民币的贷款用以支持房地产:
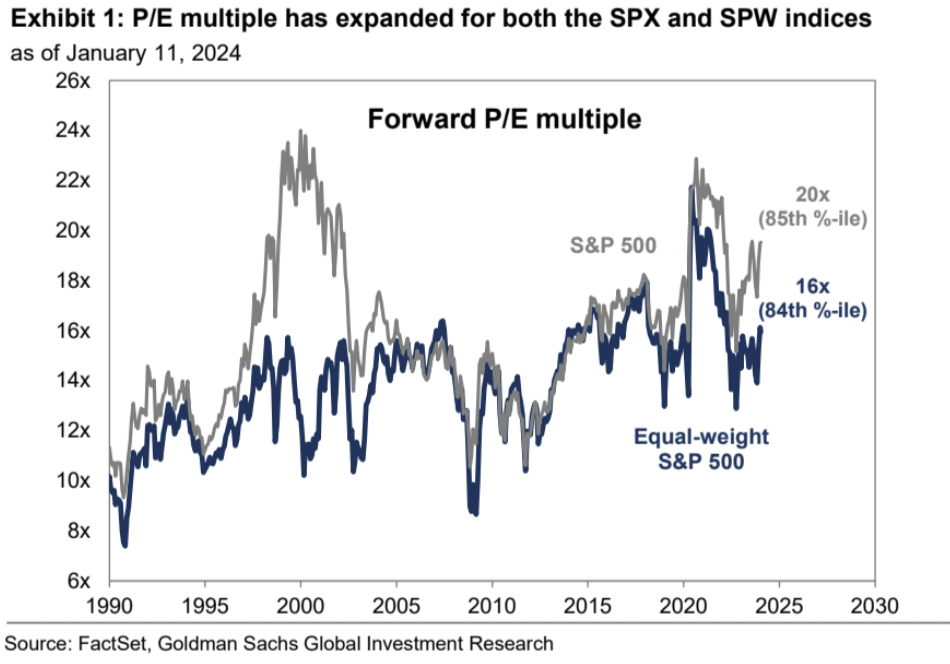
估值对比:CSI 300 指数 PE 较 2021 年峰值下跌 40% ,不到 12 倍,恒生只有 8.5 倍,相比下美国 SP 500 为 23 倍,日本 17 倍,韩国 18 倍,欧洲 14 倍。CSI 300 PB 为 1.38 倍,不到标普 500 的三分之一。
美联储的“QE”预期卷土重来
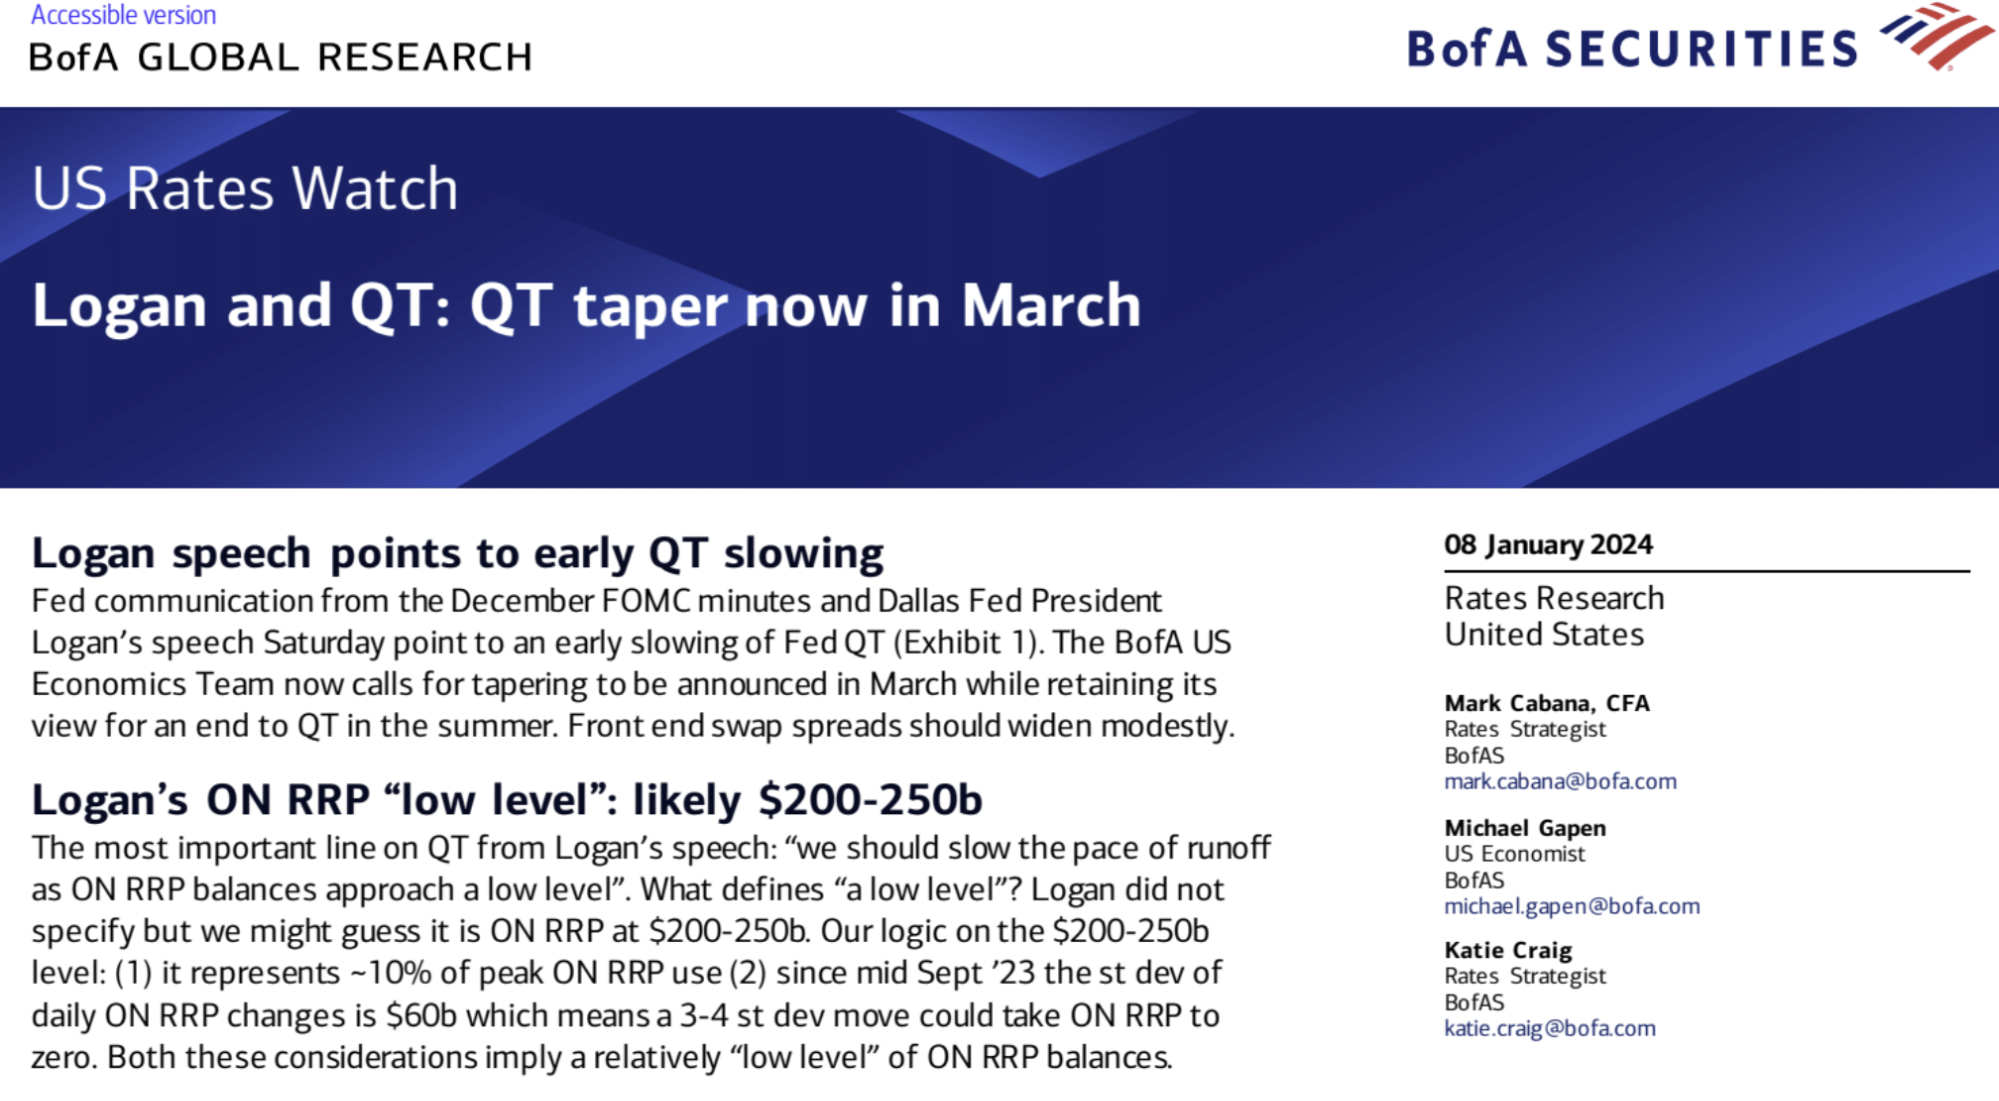
图:QT 成为各大机构热门的讨论主题
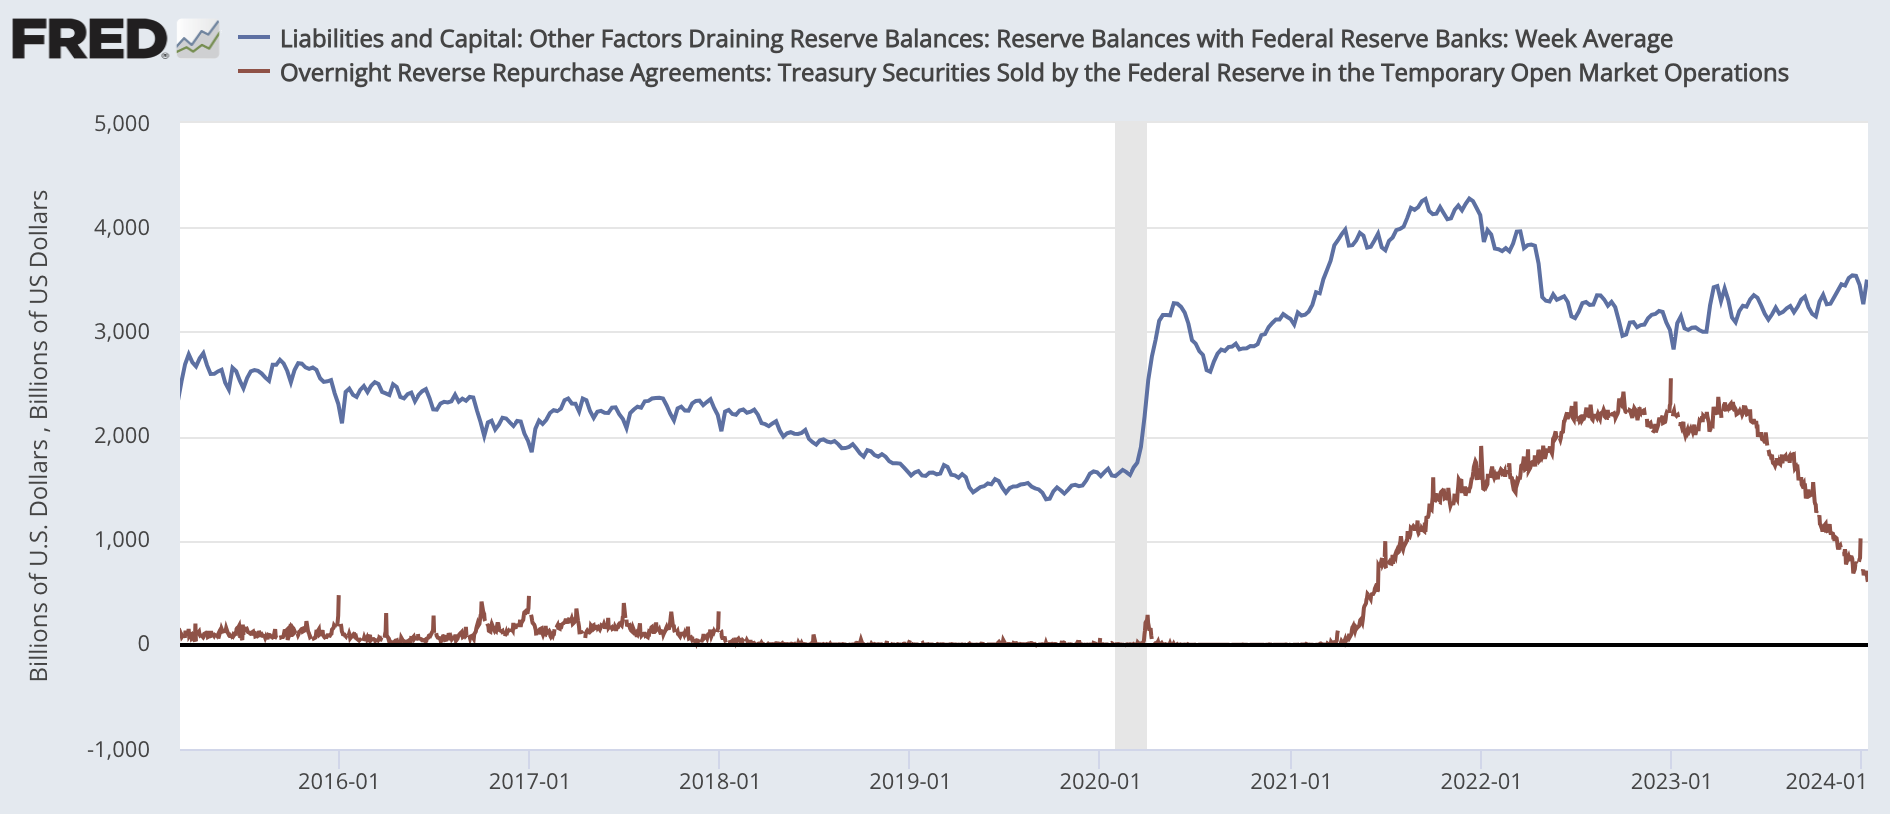
由于 ONRRP 的持续下降引发市场越来越多的关于停止 QT 讨论,因为可能导致金融体系流动性不足,引发类似 2018 年年底市场剧烈动荡,当时 Fed 在推 QT 和加息,隔夜回购利率大幅飙升至 20% 左右,股市也大幅下跌。所以,市场开始押注美联储正在提前结束资产负债表缩减,这也意味着美联储政策转向鸽派,接下来就是资产供给和流动性之间的拉锯战,可能对债市是直接的利好,对股市影响不确定,但加密货币可能在回调之后可以找到新一轮炒作的主题。
美联储每月让多达 600 亿美元的美国国债和 350 亿美元的机构债券到期,而无需将所得收益进行再投资,已经维持了 18 个月。
按照当前的下降趋势(一周-900 亿)ONRRP 最快到 3 月就可能归零。值得注意的是,虽然 Fed 虽然 2023 缩表了 1.3 万亿美元,但银行准备金余额实际上增加了 3500 亿美元,达到 3.5 万亿美元左右。这是因为 ON RRP 工具余额的减少进行了对冲。美国国债发行量的增加和利率路径的不确定性降低,促使货币市场基金更多地投资于国债,从而导致 ON RRP 迅速流失。
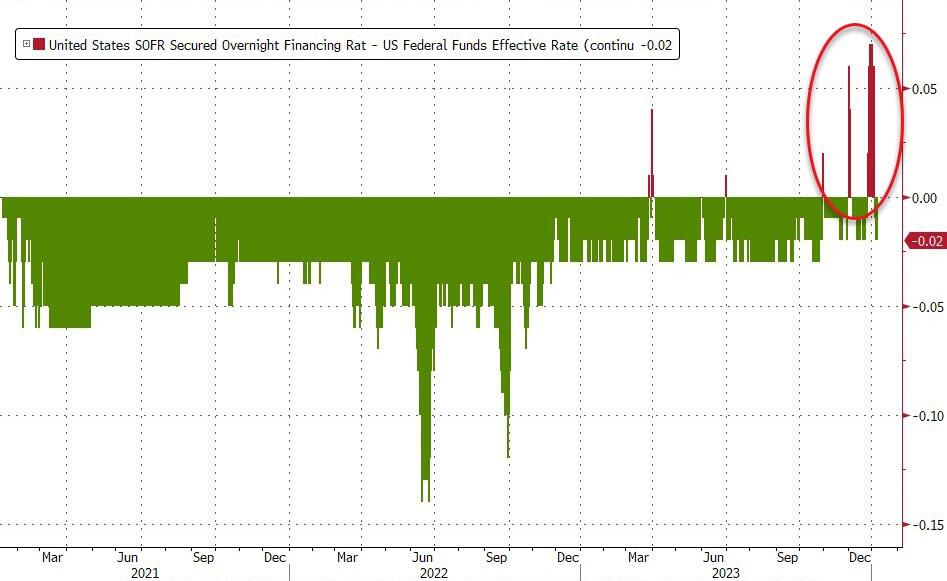
另外月末 sofr 和基准利率 spread 越来越来大也被认为是流动性紧张的表现:
美国银行预计 Fed 今年 3 – 6 月就开始缩减每月国债兑现额度:预计美联储将在 3 月份会议上宣布从 4 月开始每月减少 150 亿美元的国债兑现额度,到 7 月完全结束国债缩表。
德意志银行预计今年 3 月第一次降息,然后 6 月开始削减 QT,但如果经济软着陆的话,到 2025 年 1 一季度才会完全停止。
高盛预计从 5 月开始降低缩减速度,到 2025 年 1 季度完全停止。该行认为这轮紧缩周期缩表的速度比以往要快很多,而且流动性在市场各个参与者之间的分配也相当不均衡。因此 FOMC 担心在这个过程中货币市场会出现功能性失灵的情况,降低缩表的速度就有望实现防范相关风险,包括确保银行的准备金需求有序实现,避免引发流动性坍塌导致不得提前终止 QT 的风险。
巴克莱 Joseph Abate 预计 Fed 已经有了之前的忌惮,本次在任何金融指标出现紧张迹象之前,就将终止 QT,预计 QT 将在 6 月或 7 月结束。
巴克莱提醒了我们一个重要的问题,就是 QT 出现在流动性危机之前还是之后,如在前,市场可能乐见与此,由于预期 Fed 买盘的加入,债券将再次成为高确定性上涨的资产,收益率有望进一步走低,风险资产进一步走高或能够维持高估值。但如果不幸发生了流动性危机,市场可能会出现 V 型走势。
有分析认为,银行准备金稀缺本身不会造成流动性问题并迫使美联储停止 QT。很可能是 ON RRP 的耗尽和对冲基金基差交易的反转导致 2024 年出现问题。因为对冲基金没有美联储的支持,而且交易中使用的高杠杆可能导致流动性问题在金融体系中更快扩散。基差交易是对冲基金通过私人回购市场融资进行的,其中对冲基金借钱购买国债并出售国债期货,通过杠杆化获得套利回报。这种交易在增加了对国债需求的同时,也增加了市场对现金流动性的依赖。
美联储有意识到这个问题。两个关键事件,一是 1 月 3 号公布的 12 月份 FOMC 会议纪要显示,美联储已开始考虑缩减 QT 的时机和沟通方式。然后是 1 月 8 号达拉斯联储 Logan 今年开年的讲话明确建议,一旦 ON RRP 耗尽,QT 就应该缩减,因为比起提前降息,停止 QT 对通胀的影响会更小。
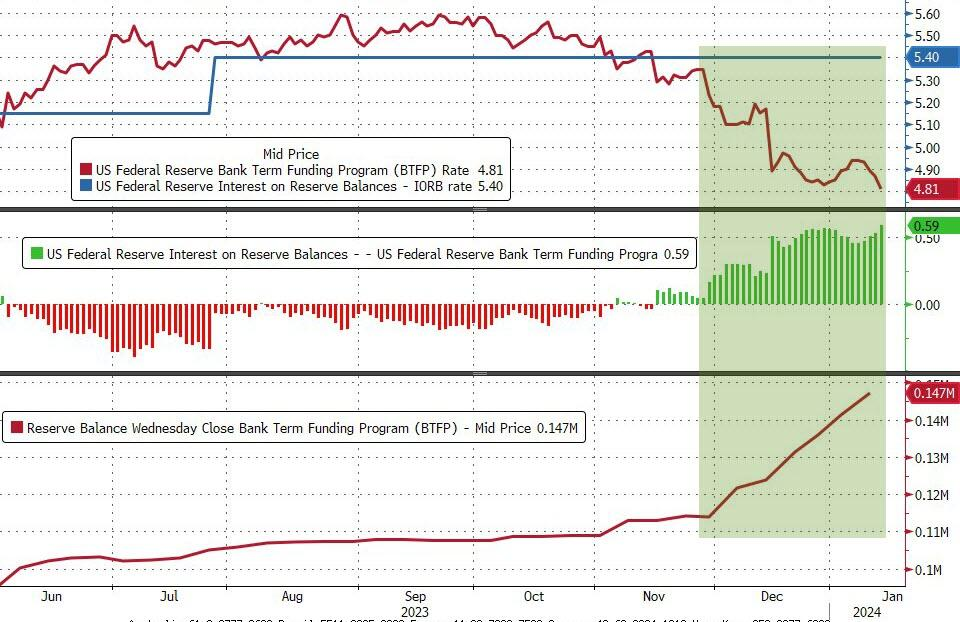
BTFP 3 月到期
用于银行紧急救助的 BTFP 最近两个月使用量激增,但分析普遍认为这是因为套利导致的,并非银行流动性紧张。如美联储也承认这一事实, 3 月到期后应该不会再续作该政策。不过也为到时缩减 QT 提供了一个新的支撑,Fed 没理由冒让地区银行业危机卷土重来的风险。
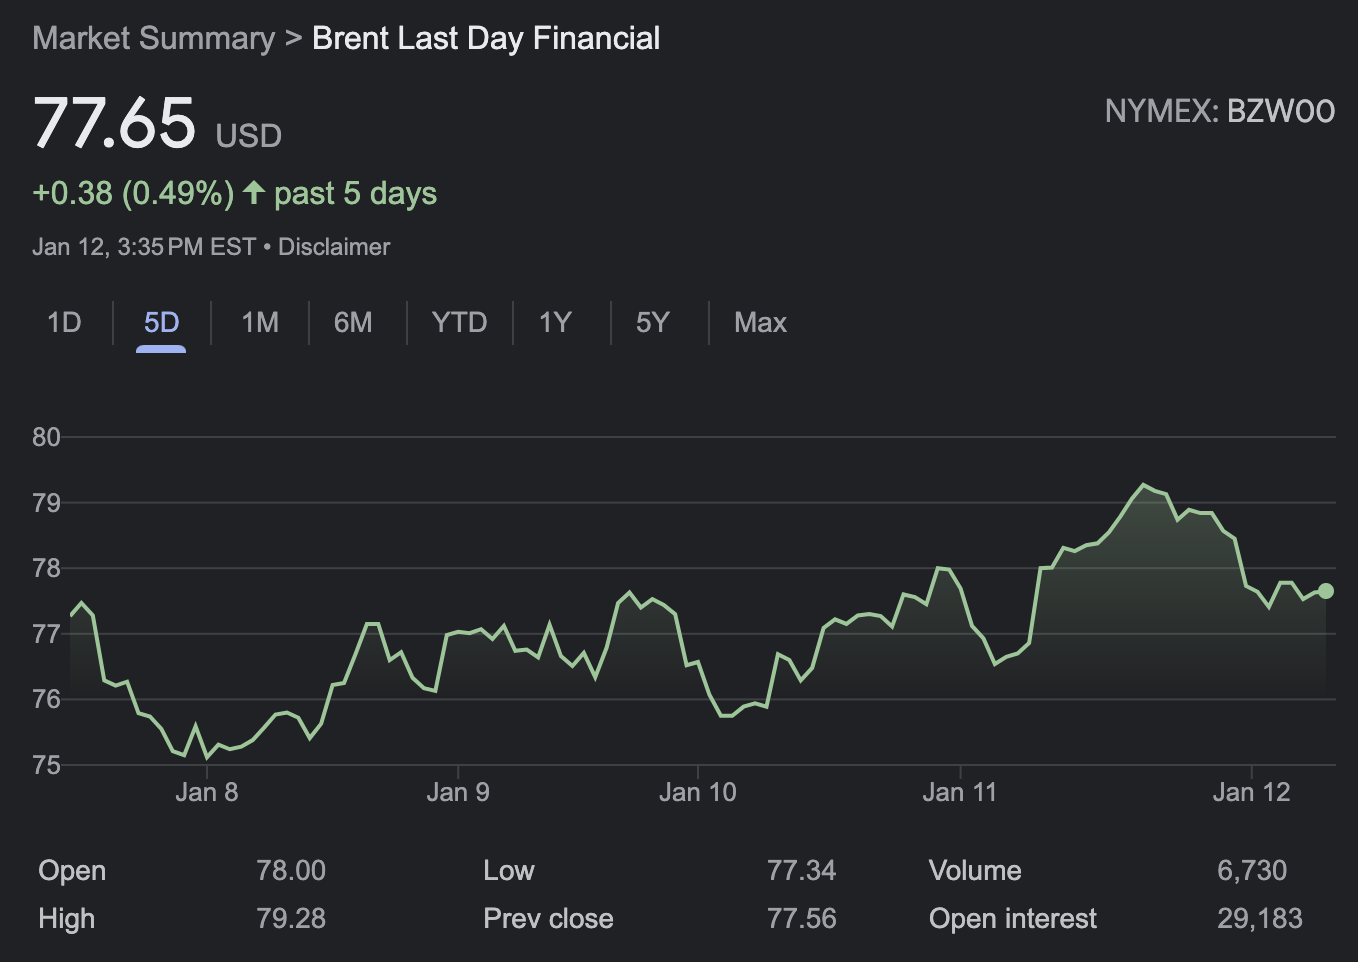
红海局势升级
胡赛武装上周发动了最大一次规模袭击,也是首次针对英美舰队的袭击,据说全部导弹和无人机被成功拦截,未对军舰造成损伤。周五英美发动对胡赛武装的联合空袭。媒体报道一艘名为 ST.Nikolas 的油船被胡赛武装控制。胡塞武装表示,由以色列公司拥有或运营以及悬挂以色列国旗的所有船只都将是该组织的“合法打击目标”。截至目前,挂五星红旗或船员中明示有中国籍员工的货轮都能安全通过。上周媒体报道多数运油公司还不打算绕道好望角,本周在局势升级后,说法已开始改变,但从价格表现上来看供给过剩的担忧依旧挥之不去。
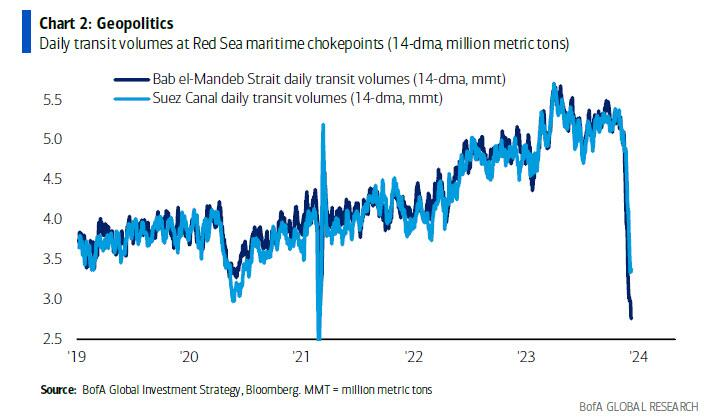
过去 4 周通过红海/苏伊士运河的运输量下降了 35 – 45% :
BTC 的又一里程碑,但请控制下激动的情绪
周四,在美国首只现货 ETF 推出后仅 30 分钟,比特币就触及 21 个月高点 49051 美元。但在接下来的两天里,它下跌了 12% ,引发了市场情绪的松动。原因之一是从封闭式基金转换而来的 Grayscale GBTC ETF 出现了 5.79 亿美元的资金流出,导致 ETFs 发行后两天净流入降至 8 亿美元,这远低于之前市场人士预期的 20 亿美元,或者彭博预期的首日 40 亿美元,让渣打预测的 1000 亿美元流入显得尤为离谱(个人认为即便这个成绩也已经很好了)。
参考 BITO 上市时的情况,因为这是美国首只比特币交易所交易基金,长期被压抑需求在短短两天内就将投资工具中持有的资产推至超过 10 亿美元,甚至高于是本次新 ETF 8 亿的 净流入。然而,直到 2023 年 10 月,其市值才超过 14 亿美元。由于 BTC 具有高度自我实现的属性,一旦价格持续下跌很难期待新的资金大规模流入。
除了 GBTC,这 10 只真正的新 ETF 中只有 14 亿美元,与 8400 亿美元的比特币市值相比只是九牛一毛。如果加上 GBTC,那总规模达到 250 亿美元,考虑到 GLD 才五百多亿,BTC 赶超黄金的目标已经完成了一半。
另外 FTX 的破产财产正在逢高出货也助推了跌势,由于 ETF 通过预期已经刺激了比特币价格上涨 50% ,短期内的调整不难理解。
一位朋友的评论:web3 行业的大规模展开,有两个前提: 1. 对 crypto 价值的认可; 2. 钱包。目前在展开的是第一项,ETF 的通过已经是巨大的成功,意味着已经成功进入体制内了,接下来就等合规市场培育更多的钱包用户,等到钱包用户数起来了,行业到时可以摆脱传统的制约。
仓位和资金流
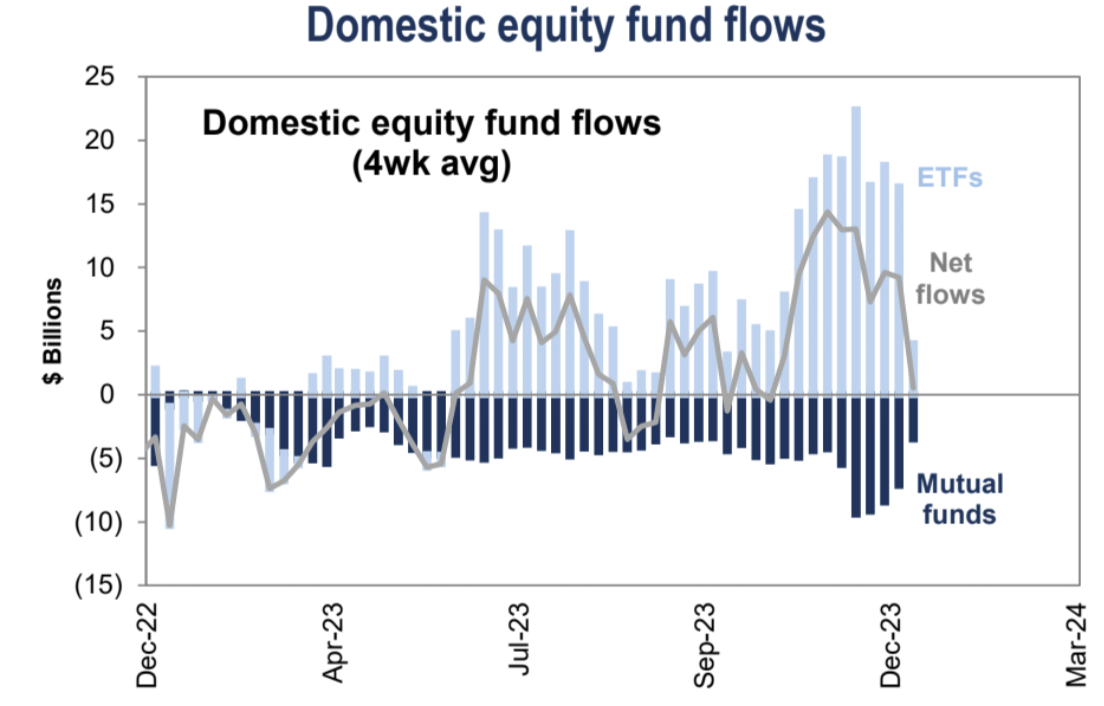
美股公开市场基金的流入减缓,上周是净流出:
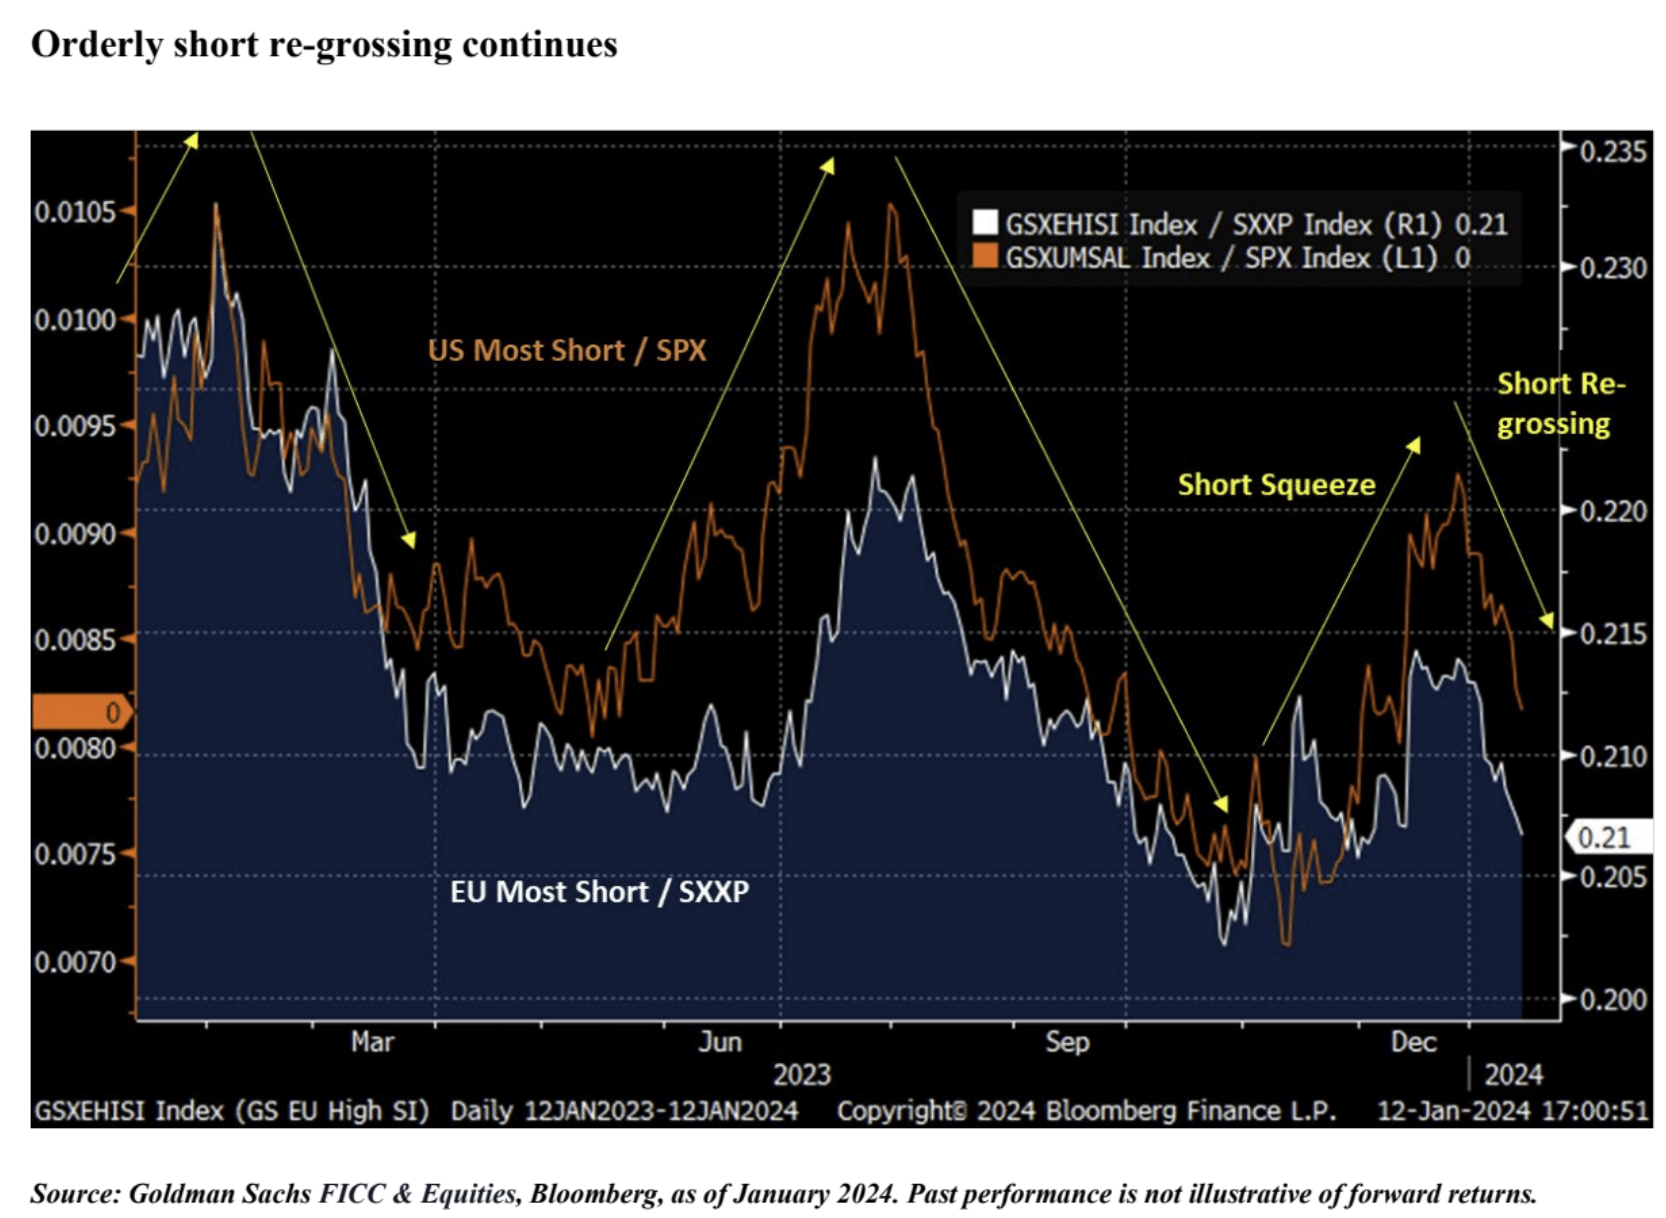
从最被做空的股票走势来看,逼空行情已经完成现在进入有序的补空头行情:
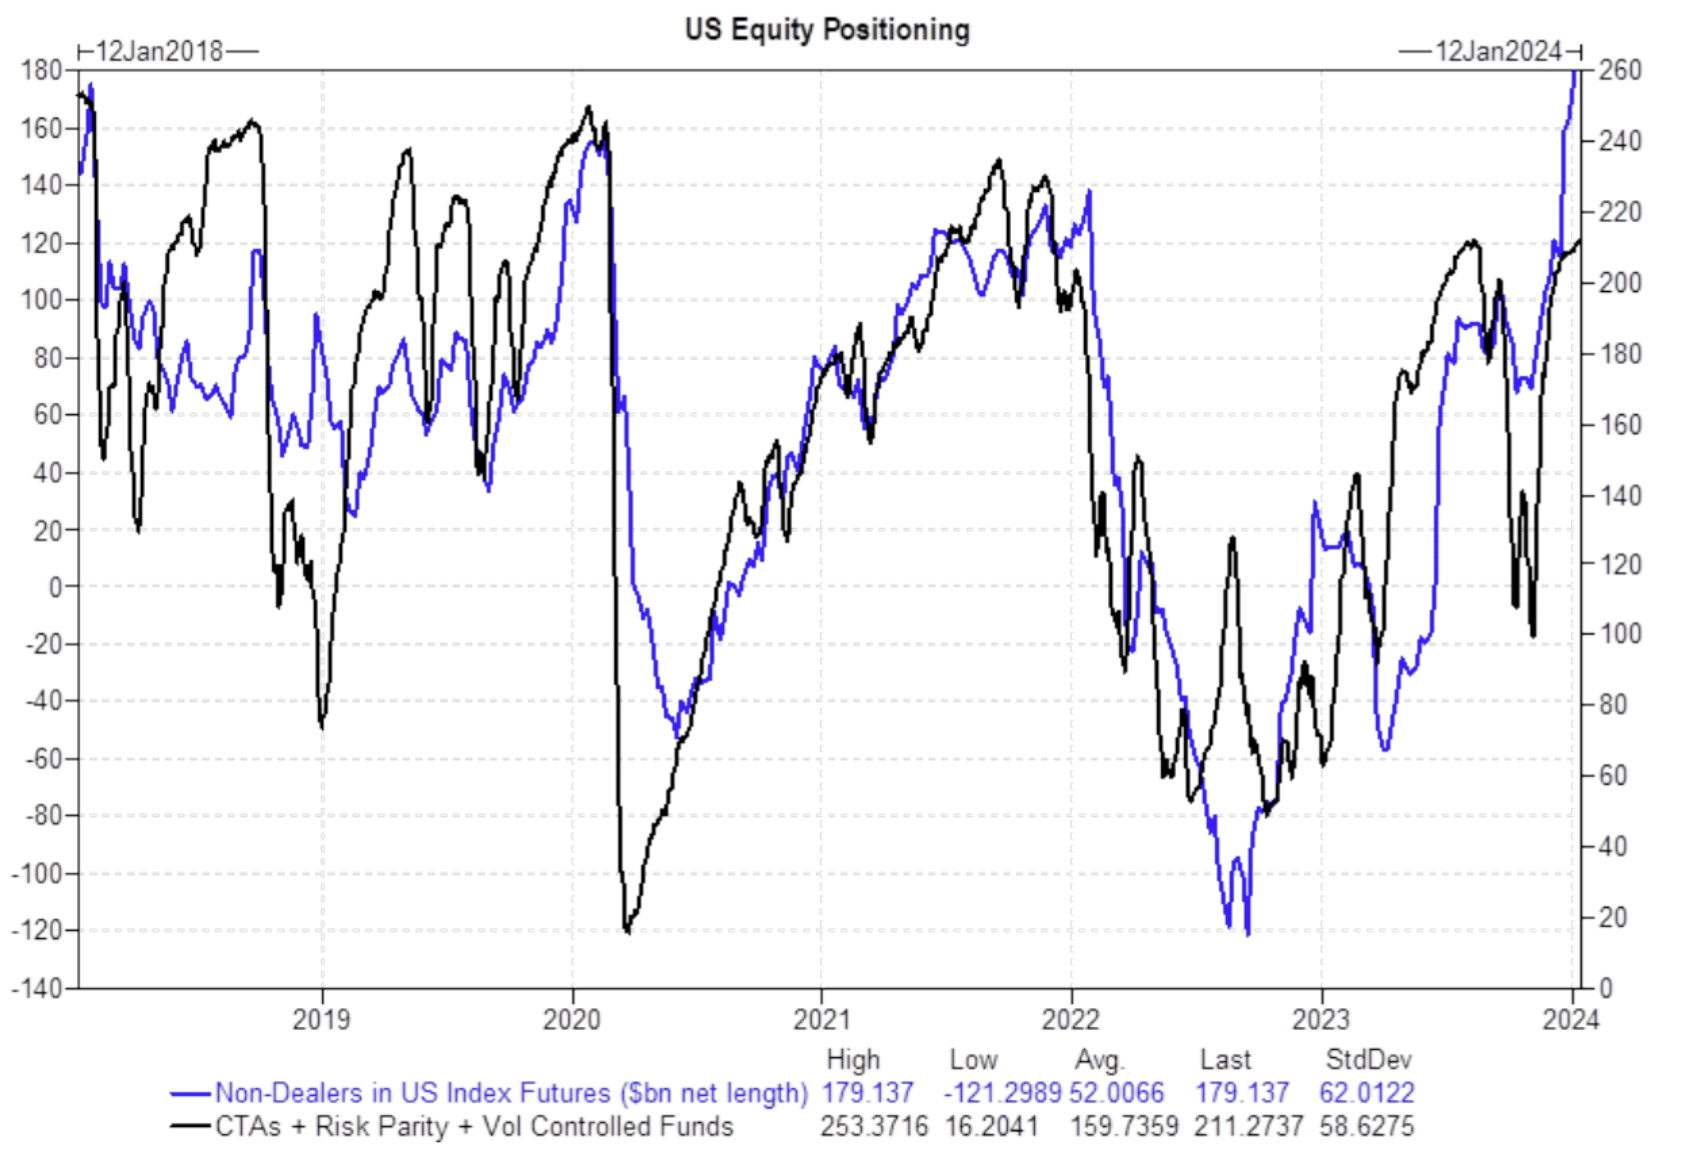
高盛:“多头头寸极端……美国股指期货的非交易商头寸处于历史高位。系统策略头寸(CTA + 波动控制 + 风险平价)接近一年高点。”
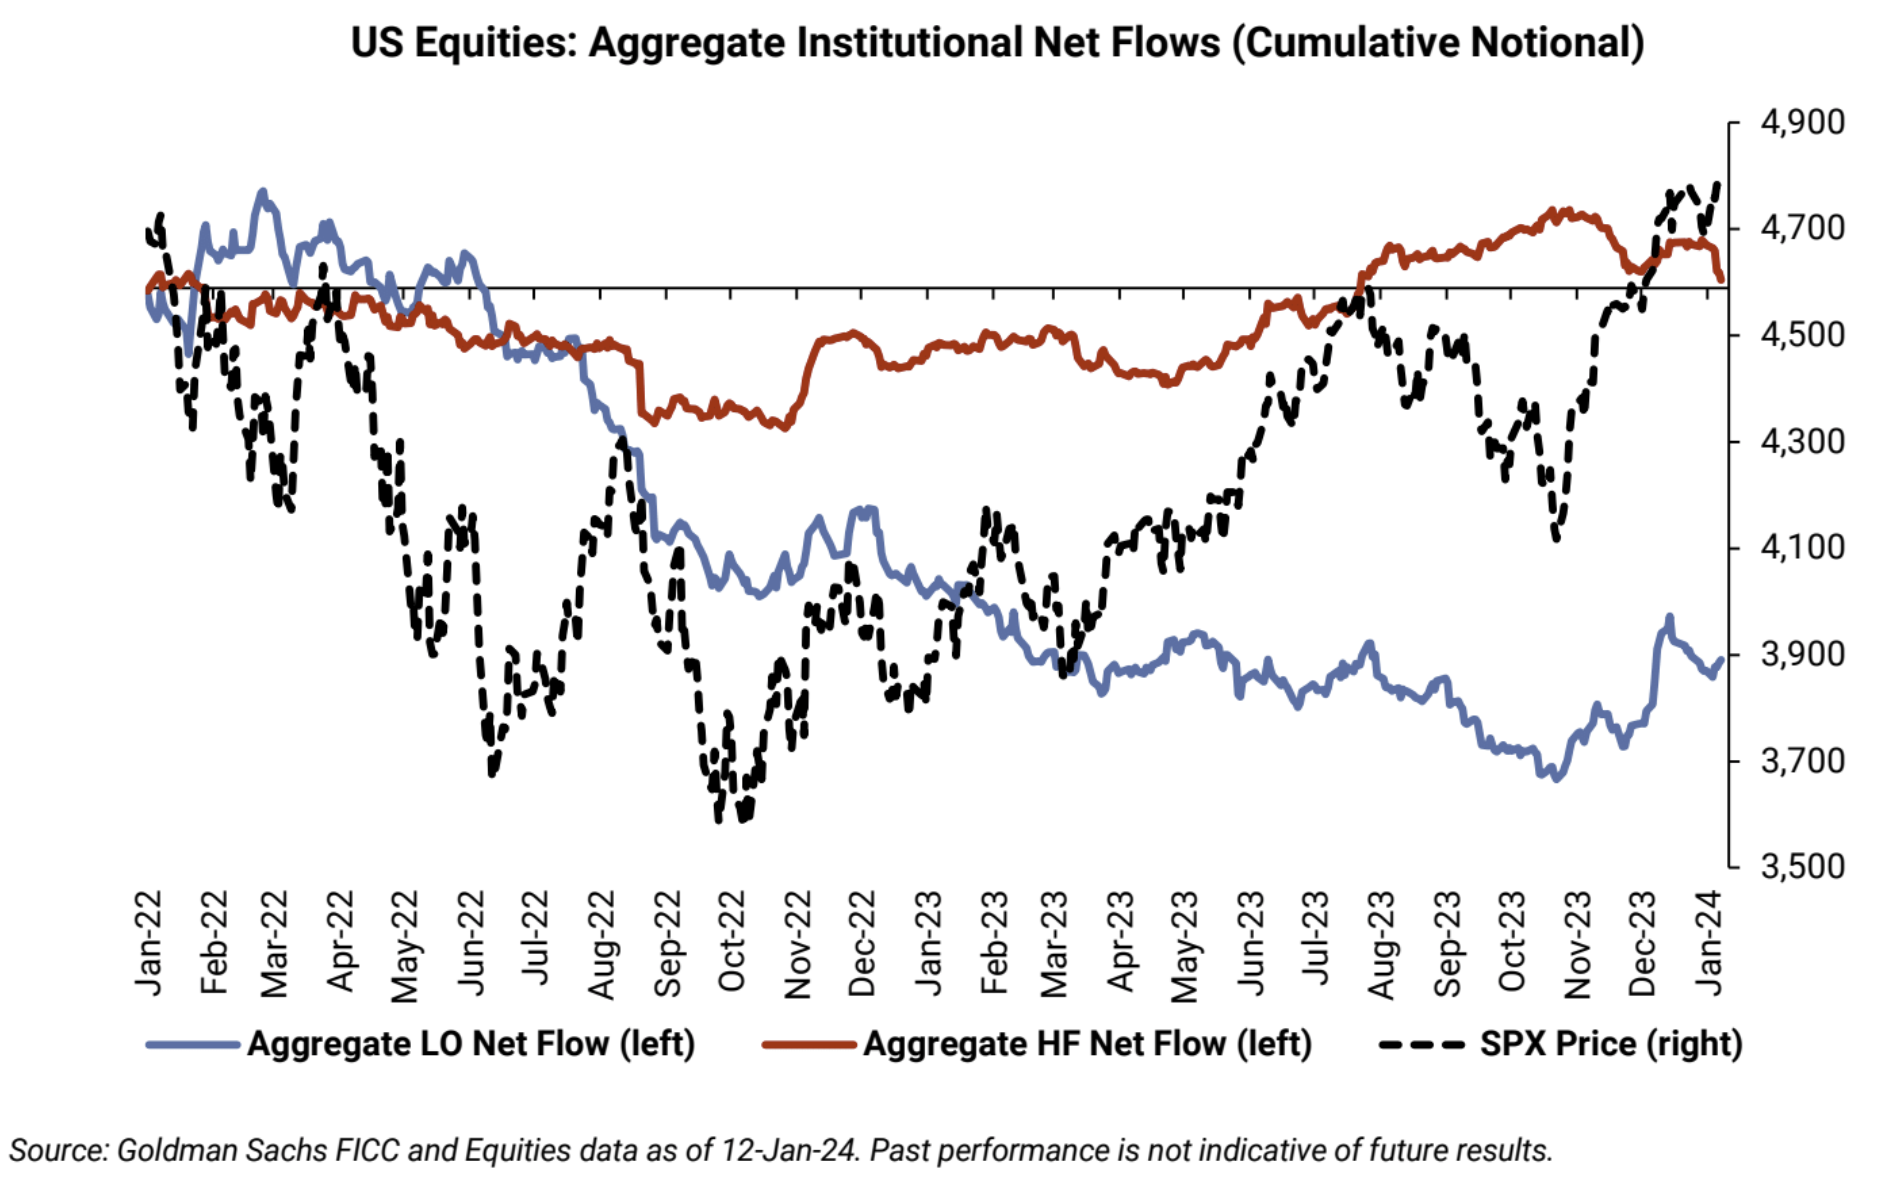
高盛客户对美股上周 long only 基金净买入 12 亿美元,对冲基金客户净卖出 40 亿美元,房地产、旅游休闲、医疗保健以及金融领域的做空活动增加了(这几行业都是去年底表现突出):
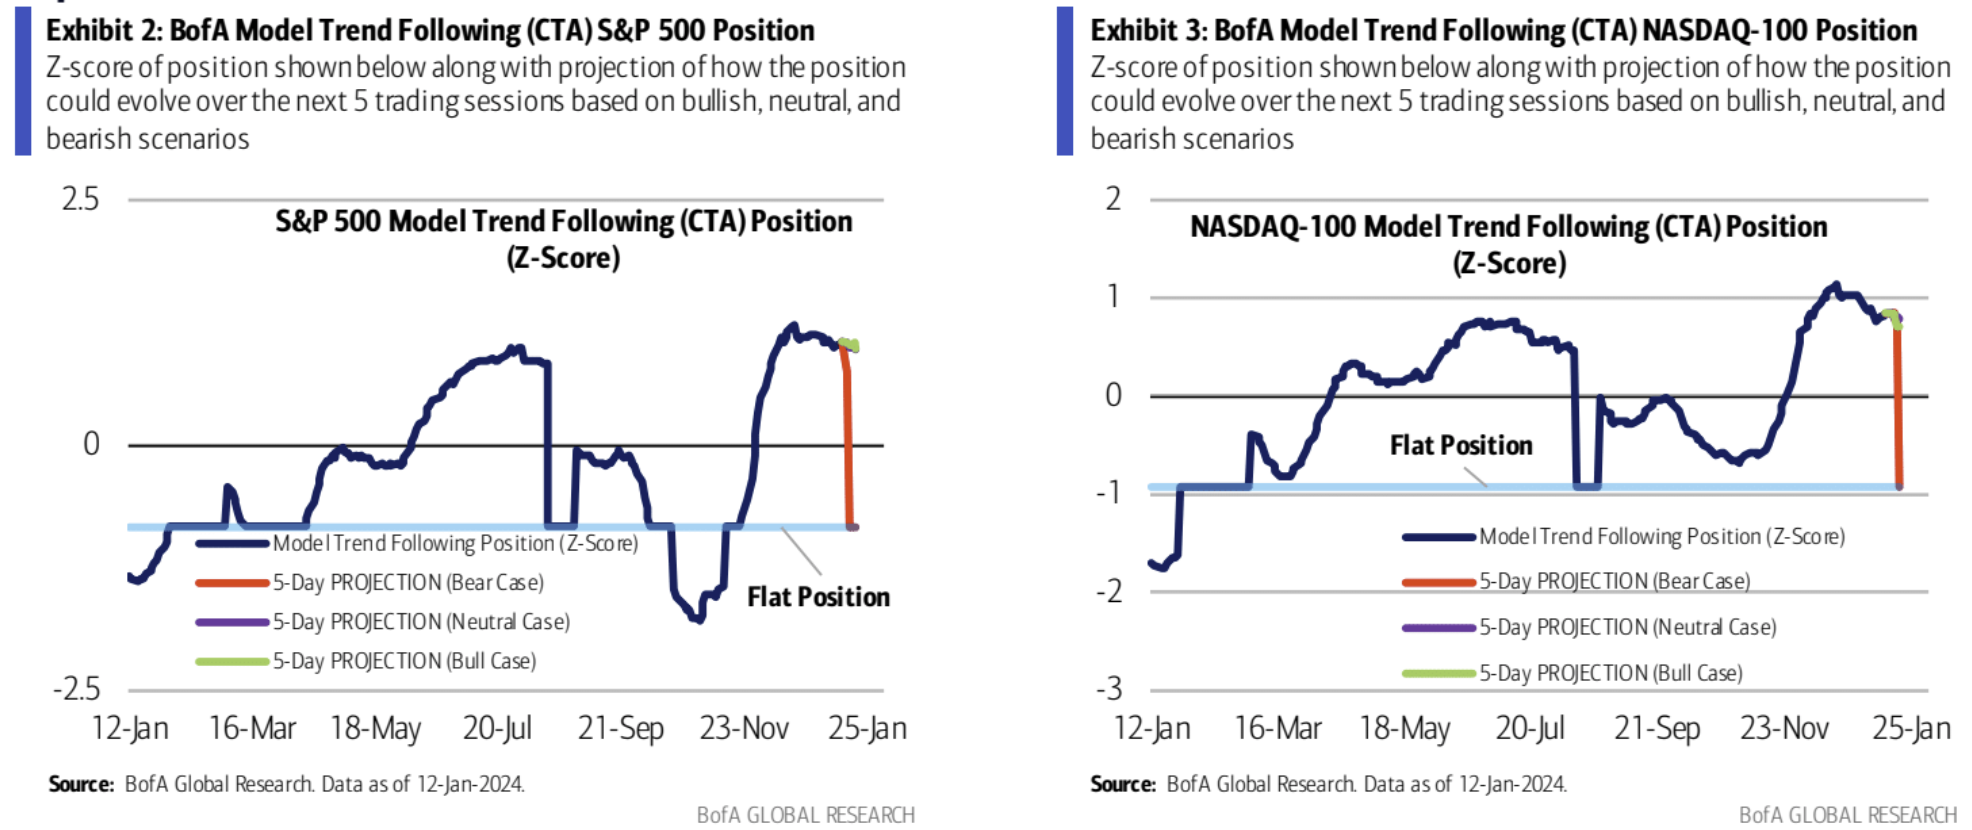
美银依旧认为现在 CTA 资金多头止损离场的可能性较高:
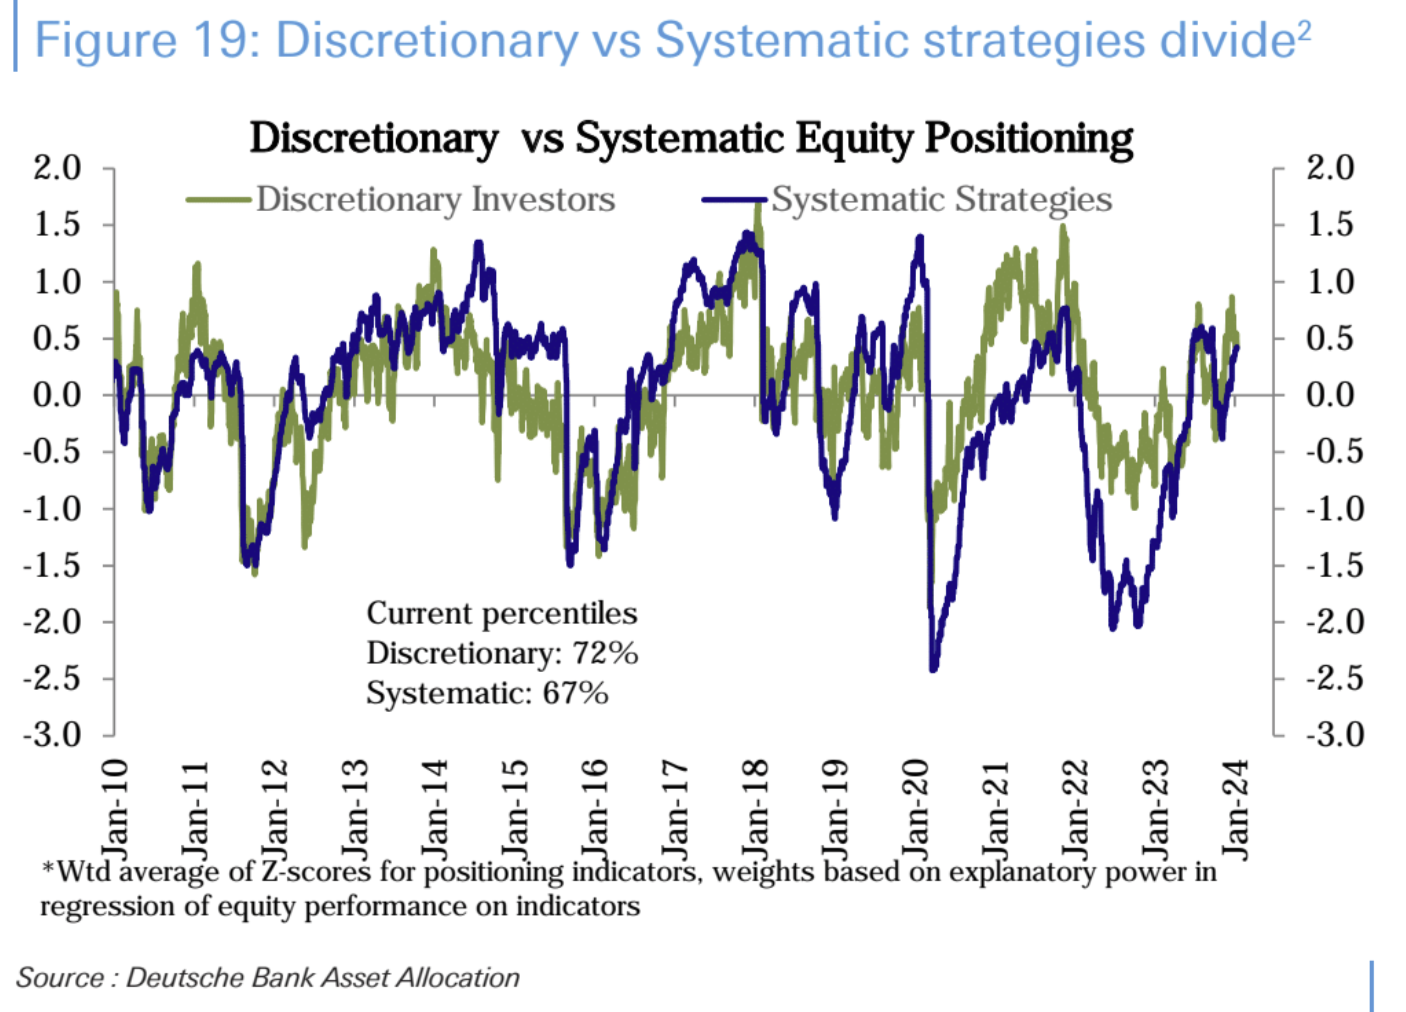
德意志银行统计口径处于适度超配状态,主观投资人目前仓位位于历史 72 百分位,系统性策略投资人仓位位于历史 67 百分位,近期主观投资人的仓位有所回落:
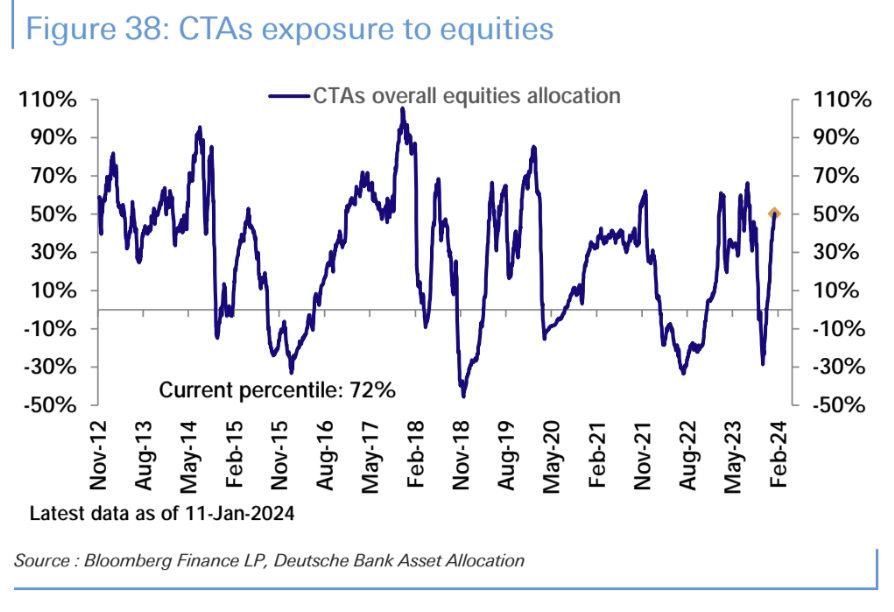
CTA 资金仓位位于历史 72 百分位:
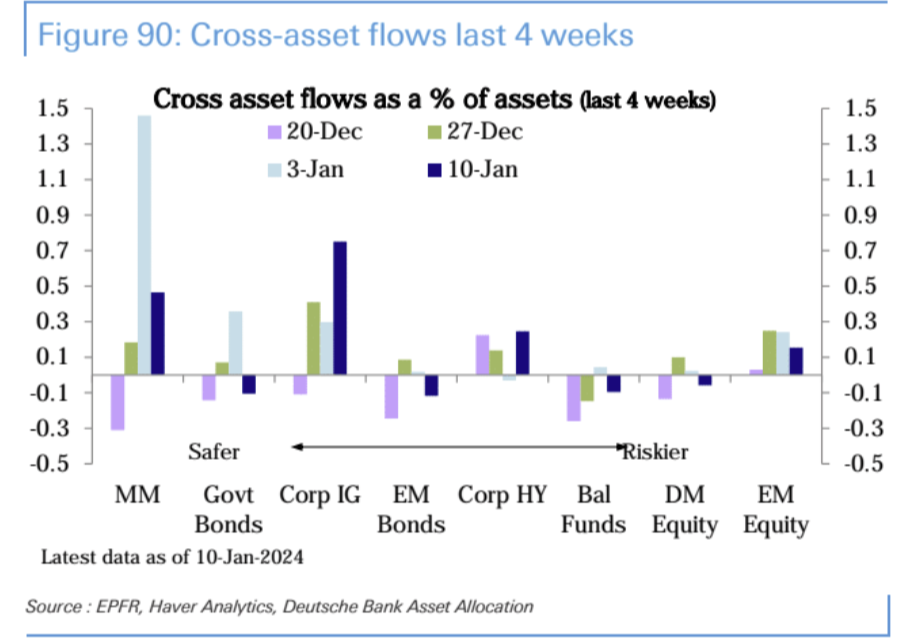
债券基金( 139 亿美元)的流入进一步加速至 9 个月来的最高点,这在很大程度上是因为投资级别债券( 72 亿美元)的流入跃升至 2020 年 6 月以来的最高水平,而国债基金资金流出。货币市场基金(+ 397 亿美元)收到了另一周强劲的流入,尽管比上周慢,但 2024 年前两周流入 1, 630 亿美元是有记录以来最强劲的年初:
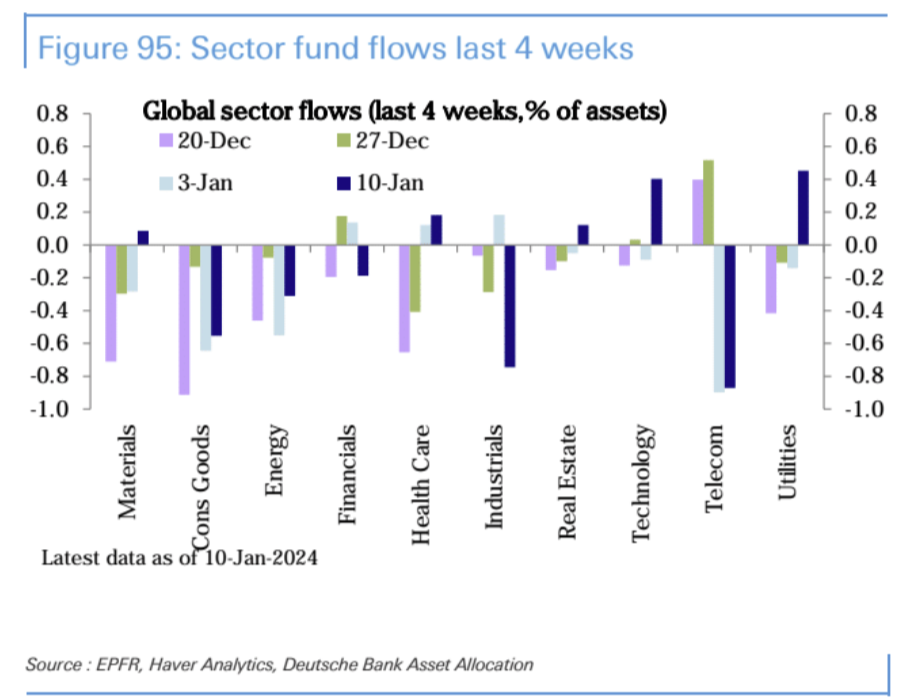
行业方面,科技( 23 亿美元)流入在过去三周低迷后反弹至四个月新高。房地产( 5 亿美元)在连续四周流出后获得流入,而本周公用事业和医疗保健分别获得了 4 亿美元的流入。材料( 1 亿美元)在八周内首次获得小额流入。与此同时,消费品(-7 亿美元)和能源(-5 亿美元)连续第 5 周和第 11 周继续见证流出。工业(-4 亿美元)、金融(-3 亿美元)和电信(-2 亿美元)本周也出现了流出:
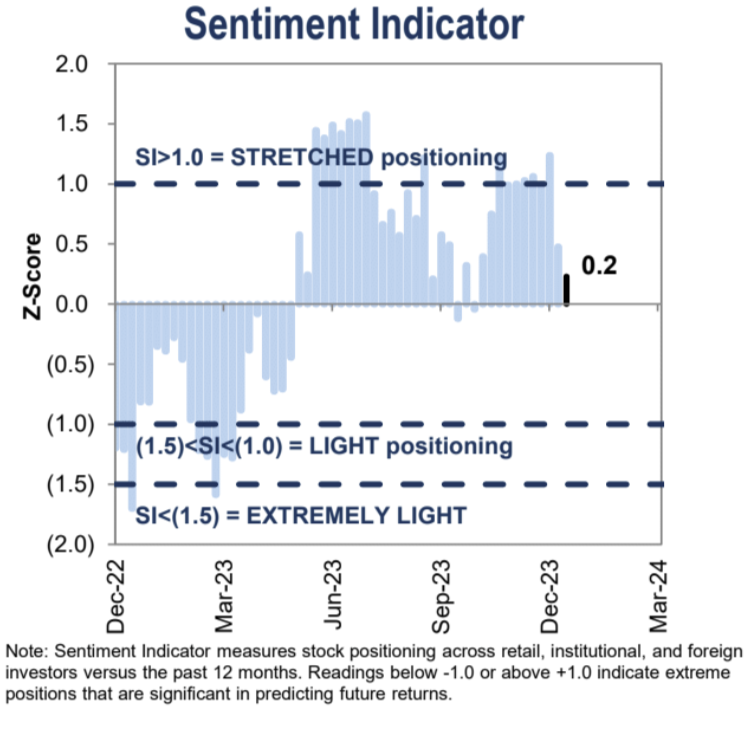
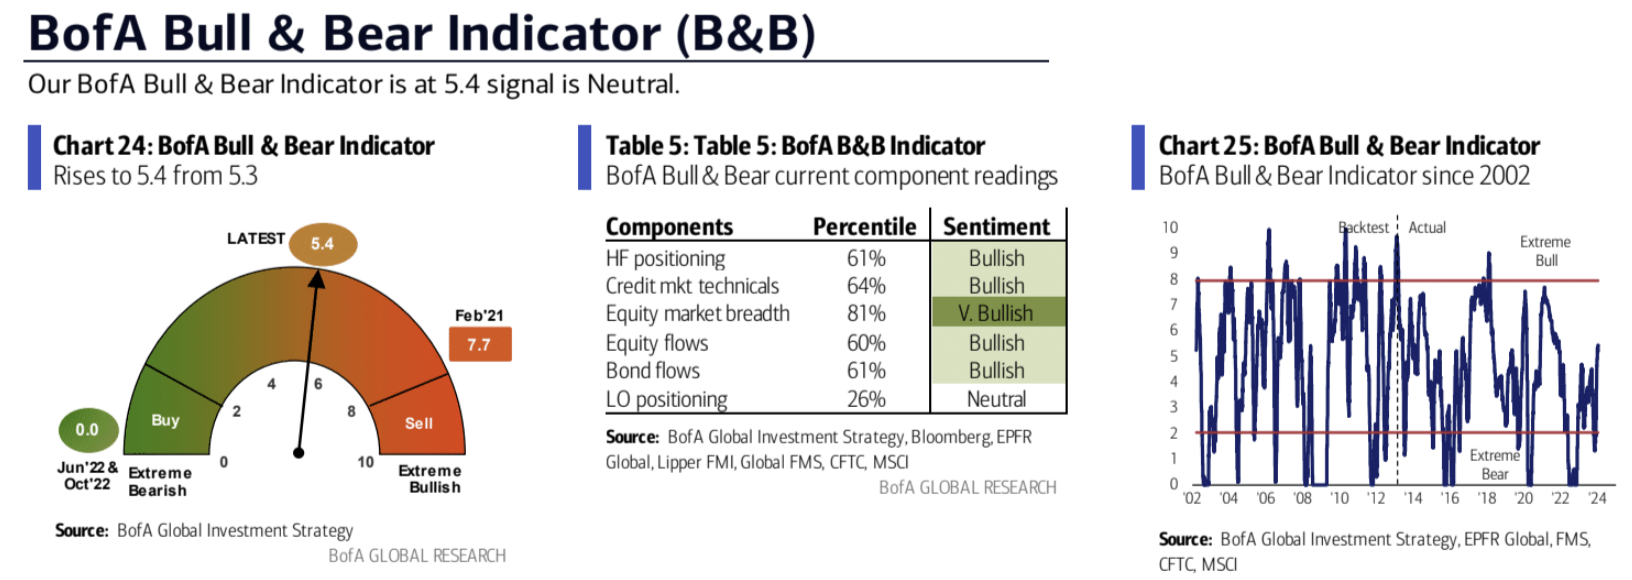
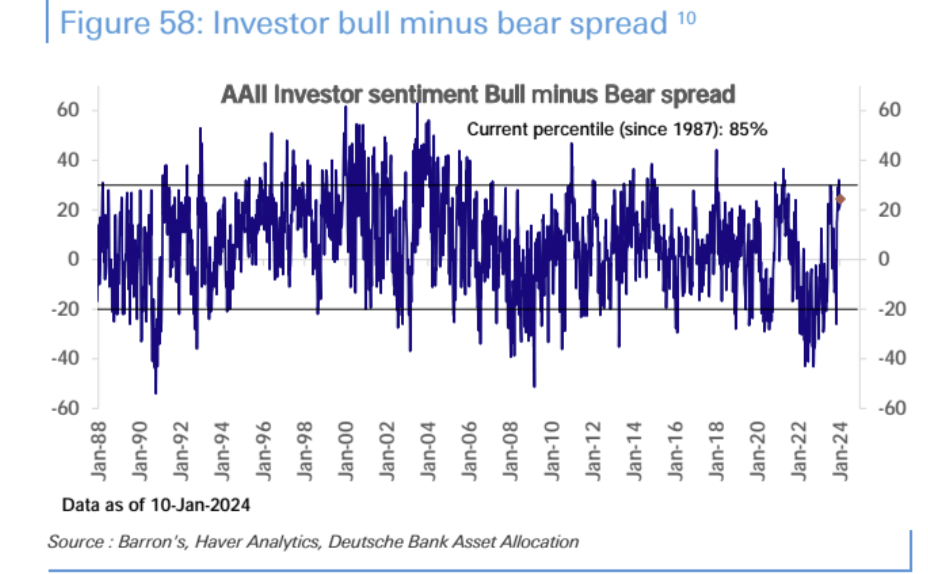
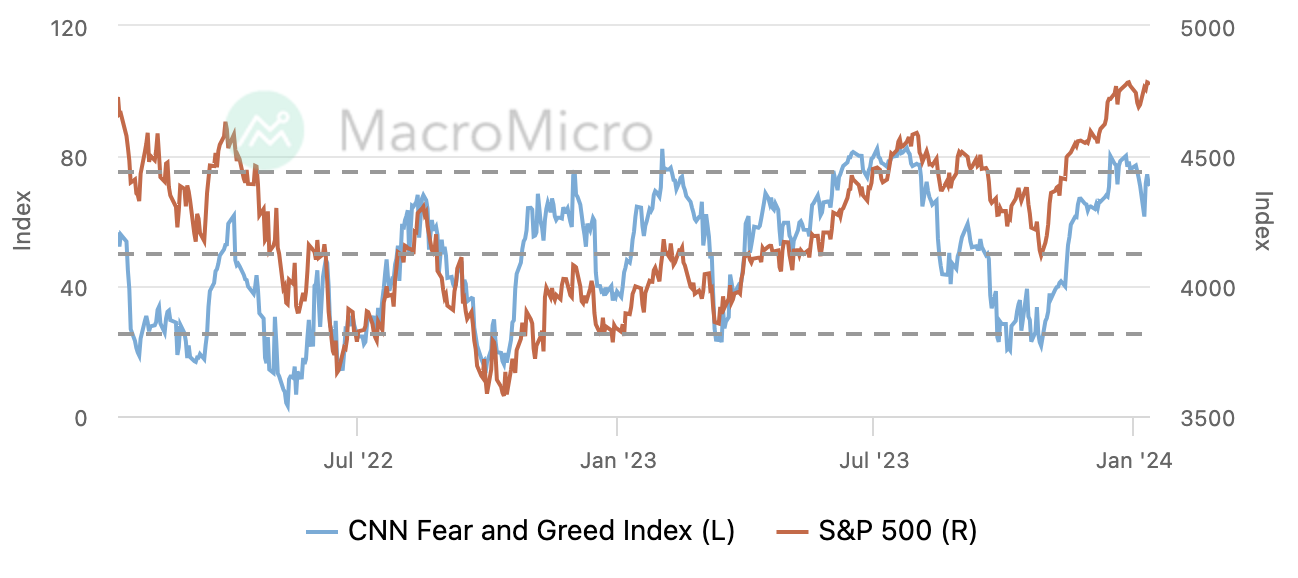
情绪指标
机构观点
高盛:在一个高估值市场中的交易建议
标准普尔 500 指数在总体和等权基础上的估值处于历史高位。除非收益率出现意外进一步下降,否则不太可能再有估值扩张。以下是三种在高估市场中具备价值的交易策略:
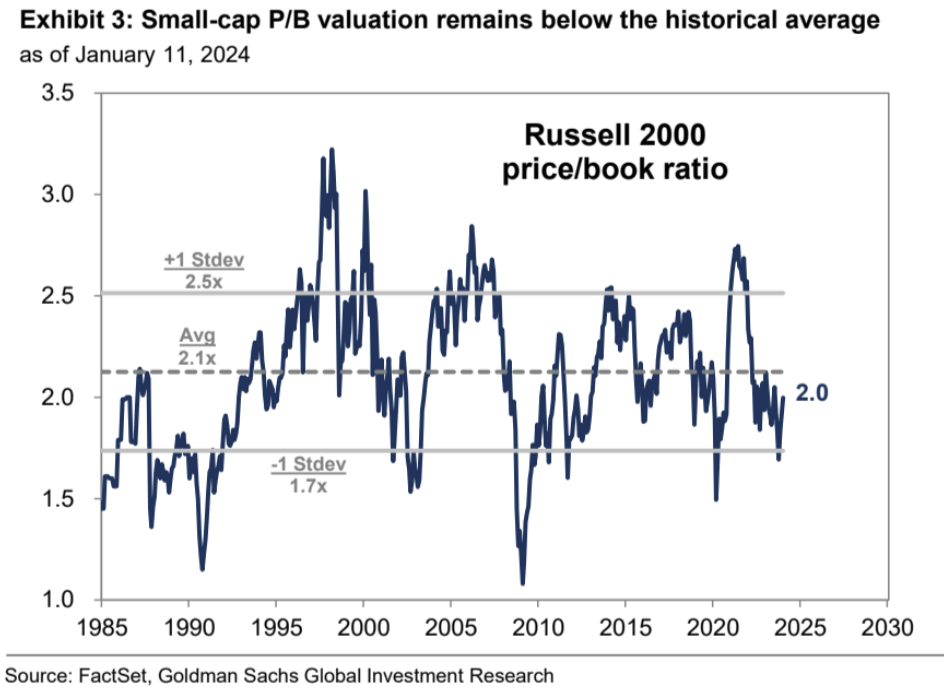
(1)持有小市值股票:低估值和良好经济前景预示着罗素 2000 指数在未来 12 个月内将实现 15% 的回报,而标普 500 指数仅为 8% 。
(2)持有弱势相对于强势定价能力的股票:定价能力较弱的公司通常会随着息税前利润率改善而表现优异。
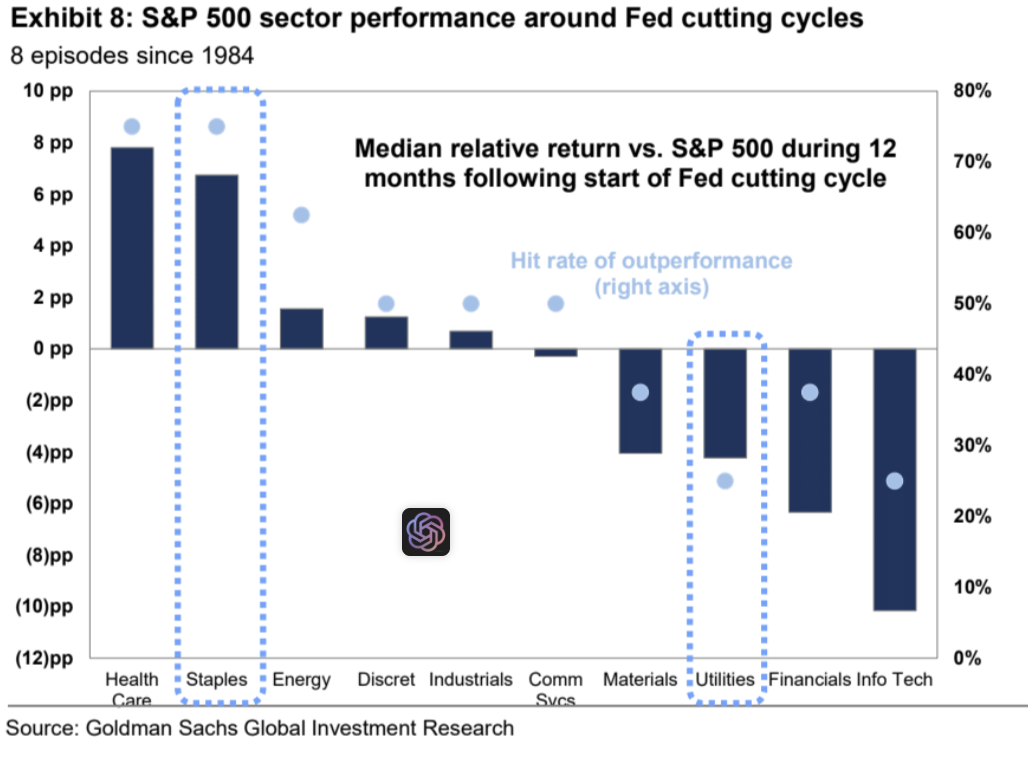
(3)在防御性行业中,消费必需品比 Utilities 好。自 1984 年以来,在 8 次美联储宽松周期中,首次降息后 12 个月内,消费品超过标普 500 指数的概率达到 75% 。
罗素 2000 指数的 2.0 倍市净率仍低于 40 年平均的 2.1 倍和 10 年平均的 2.2 倍。市盈率对罗素 2000 指数来说不那么有用,因为大约 1/3 的成分股是亏损的:
这个图表展示了自 1984 年以来,在美联储降息周期开始后的 12 个月内,各个行业板块相对于标普 500 指数的中位相对回报,以及超越标普 500 指数的频率:
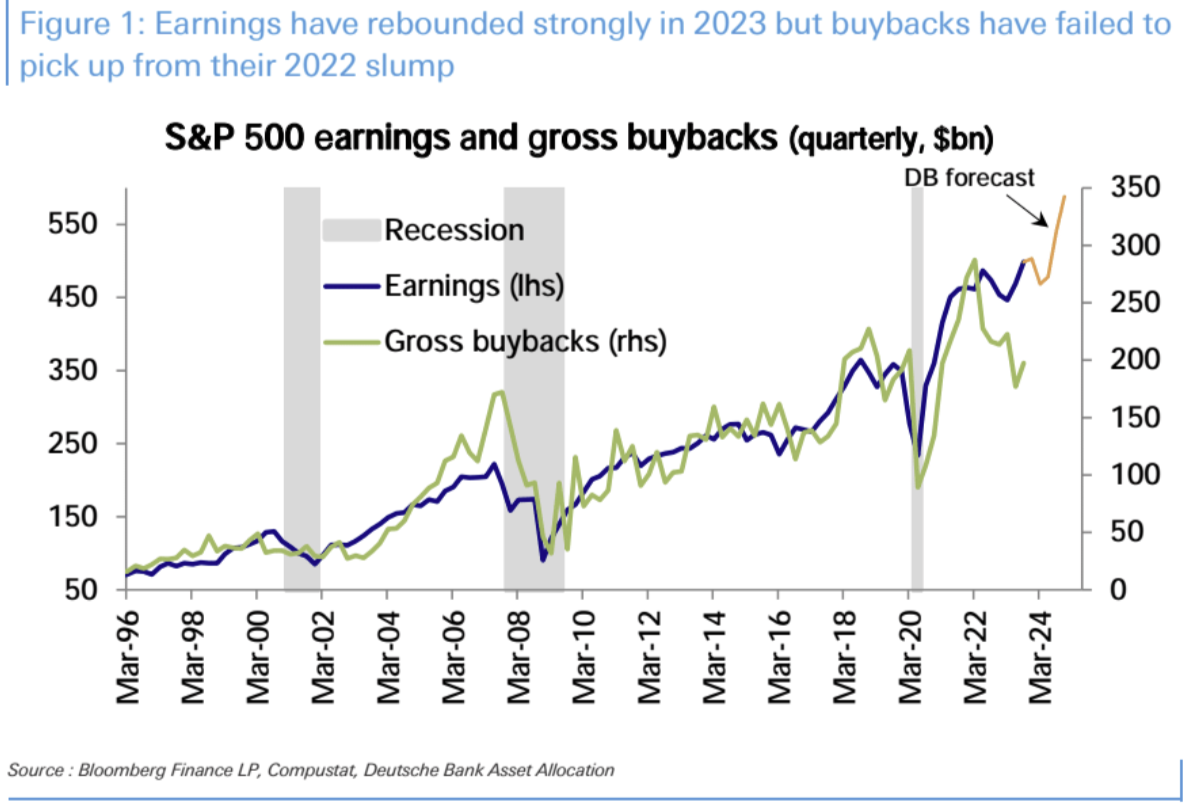
德意志银行:回购可能大幅提升
进入 2022 年第四季度盈利季节,预计公司将再次公布强劲的盈利增长和盈余惊喜。但是鉴于目前的市场拉力和头寸水平,反弹势头可能不会像往常盈利季那么强,历史上财报季上涨概率为 80% ,涨幅中值 2% 。
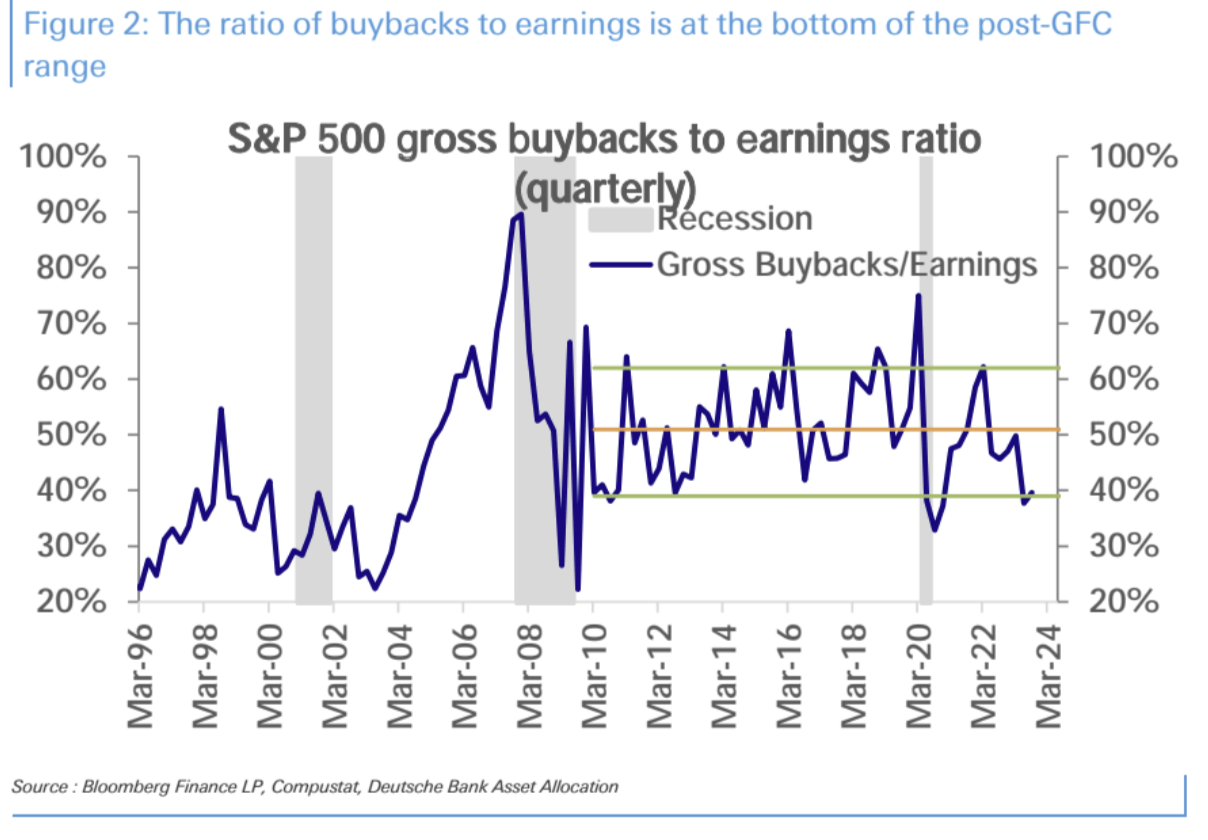
股票回购一直是美国股票最大的买家力量之一,历来与盈利高度相关。但 2022 年以来,尽管公司盈利重新创高,但回购额却未见明显反弹,仍远低于历史平均水平。
缺乏回购反弹的主要原因是经济前景不确定性依然存在。不过随着企业现金流充裕,预计买回额应会随着企业盈利继续改善而重新加速增长。
如果回购比率回升到历史平均水平, 2022 年的股票回购可能从 8000 亿美元左右增长到 1 万亿美元规模。这有助于美股实现 7 ~ 8% 的年价格增长。