
IOSG Ventures:BTC数据解读,我们已进入新一轮牛市周期
原文作者:Darko Bosnjak、Momir Amidzic,IOSG Ventures
TL;DR
IOSG 研究表明,我们目前处于第六个加密货币牛市周期中,且已经持续了一年多时间。
根据历史上的市场周期模式,IOSG 认为:我们目前正处于一个中等长度牛市周期的中前段,且正在进入中后段(积累期 ->上升期 ->分配期 ->下降期 ),且正在进入爬升期。
最近,加密周期中第二次出现 50 日均线突破 200 日均线,代表着积极的信号。这个技术指标有着稳定的历史回测数据,超过 80% 的情况在中期内都有正收益回报。
与之前的周期相比,当前的比特币牛市周期异常平稳,但如果参考历史模式,在达到本周期顶峰之前,IOSG 预期还有至少 10 次回调修正(超过 -5% )。
在比特币减半事件发生之前和之后的一段时间内,比特币的价格往往会出现明显的上涨。
IOSG:尽管比特币减半事件与市场周期的变化同时发生,但它们可能并非市场变化的直接原因,而是与更广泛的全球经济趋势相一致。
研究动机
为了更好地理解和应对当前的市场状况,我们需要研究历史上市场周期的形成和发展,以及影响这些周期的各种因素。
参考以往市场周期的经验教训,我们可以更深入地理解市场行为。此外,理解过去周期的持续时间、幅度和特征,可以为评估当前市场状况,并识别潜在的市场转折点
关于周期性
市场周期,通常被定义为更广义的市场指数(如标准普尔 500 指数)两个主要低点之间的时期。全球市场周期受到商业周期、经济状况和投资者情绪的影响。在更微观的层面上,各个行业、产业和资产都承载着这些宏观周期的印记,但仍然受到自身行业和自有的的独特因子影响。
一般来说,周期有四个不同的阶段或时期,描述了市场参与者的行为:积累期(吸引筹码)、标记上升期、分配期(派发筹码)和标记下降期。
在初始阶段,积累期标志着下跌趋势的结束。普遍的情绪是不信任和不确定,市场参与者谨慎地导航在一个低价格波动的环境中。
过渡到上升期,牛市成为主角。投资者情绪乐观且积极,市场走出上升趋势的价格 k 线。
在市场周期的的分配阶段,情绪叙事开始发生变化,市场情绪开始被过度自信和贪婪所主导。
最后,标记下降期标志着熊市的到来。焦虑和恐慌主导市场情绪,k 线图趋势的不断下降。不利的经济条件下笼罩的阴影,更加剧了投资者在这一阶段中的不安感。
这个部分,我们聚焦在分析加密货币市场固有的周期性上,特别关注比特币。比特币的市场资本化程度最高,市值大,交易量高,在数字货币市场中占据着重要的地位。比特币的价格波动对其他通常与之高度相关,其他加密资产的价格通常会随着比特币的涨跌而相应调整。
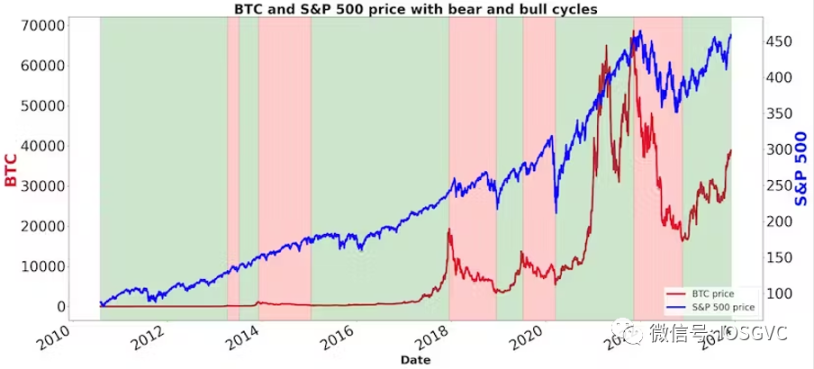
自诞生以来,BTC 平均每年上涨超过 2 倍,然而,如果我们用更宏观的视角,我们可以识别出明显的周期。
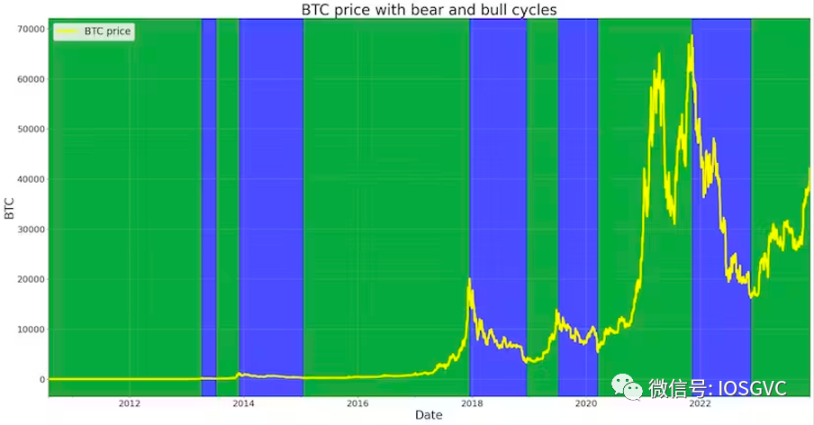
来源:IOSG Ventures
迄今为止,我们已经经历了五个(如果算上当前周期则为六个)牛市周期(绿色区域)和五个熊市周期(蓝色区域)。
目前看来,加密货币市场处于第六个牛市周期的中期,正在经历上升期。而积累期——周期的初始阶段——是从 2022 年底延续到 2023 年夏季,当时比特币的波动性降至历史低点。
探索历史和当下的平行表现
目前有一派观点否认技术分析的有效性,认为历史价格和成交量数据缺乏预测未来股价所需的一致性预测能力。其观点表明,依赖过去的价格走势和交易量并没有在预测市场趋势方面提供内在优势。我们相对同意这种观点,尤其在单独评估个别资产的表现时。
但相反地说,我们同时认为分析历史信息对于理解市场的周期性是有价值的。虽然它不能提供精确预测未来价格的走势,但做历史数据的分析可以培养直觉,帮助避免偏见。通过仔细研究市场周期,可以帮助避免不必要的看涨热情,如市场上升时(贪婪期)持有的超级周期论调,并在市场下跌时(恐慌期)抵消悲观看跌论调。这样能培养既有韧性又有洞察力的心态,更加理智和审慎地应对市场的高低波动,不被一时的市场情绪所左右。
基础数据统计
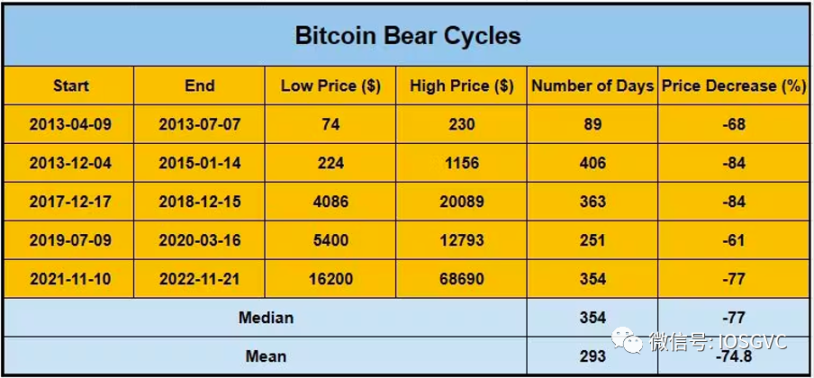
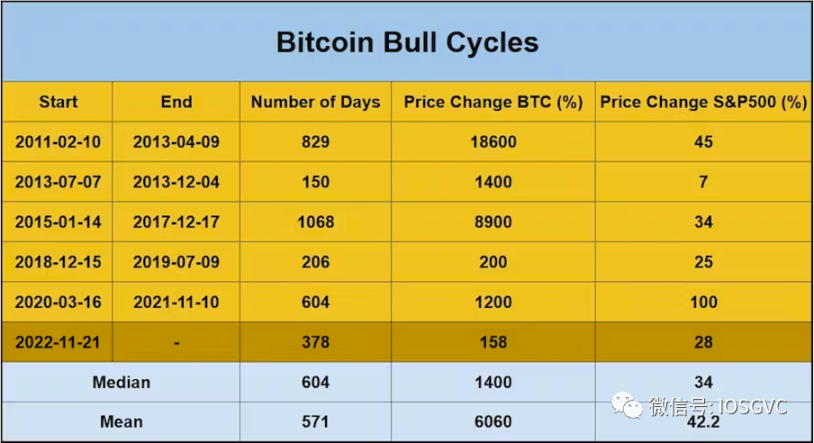
在下面的表格中,我们展示了每个历史牛市和熊市周期的统计数据。
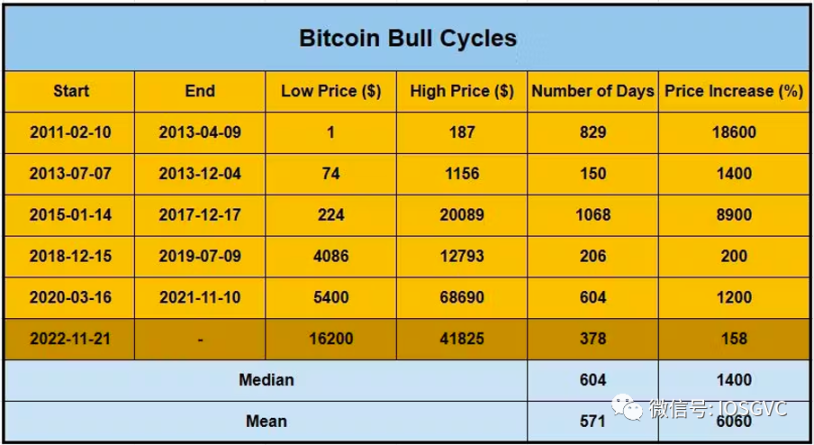

来源:IOSG Ventures
分析过去的周期,以前熊市周期的中位数跌幅为 -77% (平均跌幅约为 -75% )。最近的熊市周期正好下跌了 77% 。另一方面,牛市周期的中位数价格增幅为 15 倍(平均增幅约为 60 倍)。
至于周期的持续时间,熊市周期的中位数持续时间为 354 天,平均持续时间为 293 天。最近的熊市周期持续时间为 354 天。对于牛市周期,中位数持续时间为 604 天,平均持续时间为 571 天。
牛市倒计时
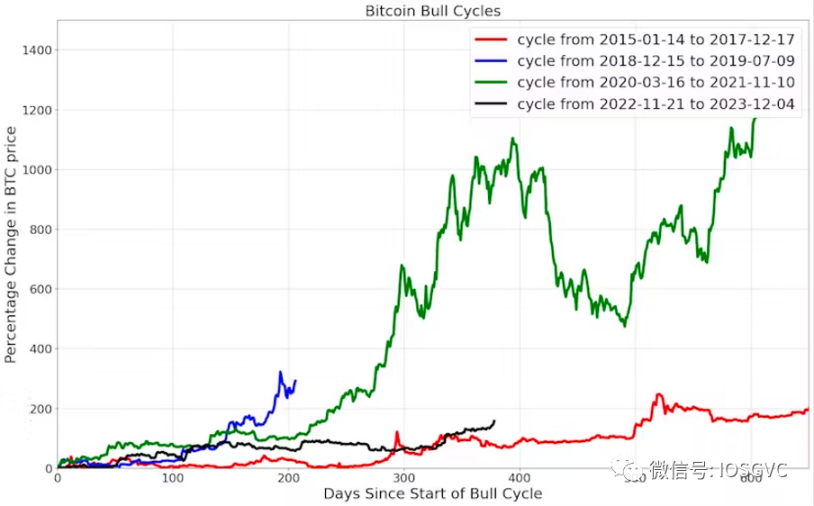
当前的牛市周期持续一年左右。下面我们将在类似的时间窗口内,将比特币在本轮周期与前几个周期的回报率进行对比。
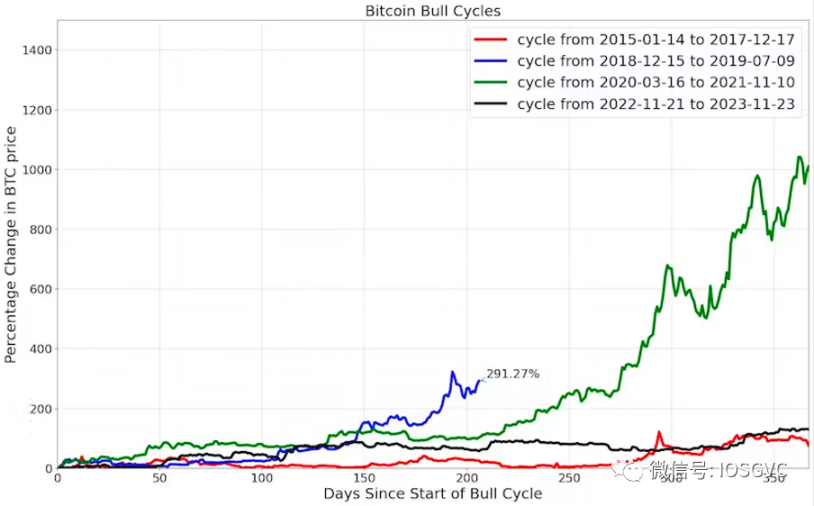
来源:IOSG Ventures
2018-2019 年的牛市周期在不到一年的时间内结束,回报率约为 3.9 倍。2020-2021 年和 2015-2017 年的周期持续了一年多,而在最初的 365 天内,各自的回报率为 11 倍和 1.9 倍。本质上, 2020-2021 年周期的回报主要在牛市开始的第一年实现,而 2015-2017 年周期在第一年之后加速表现。
对于当前的牛市周期,比特币价格从底部起算增长了 2.6 倍,时间上大致处于中等持续时间牛市周期的中间。
来源:IOSG Ventures
在过去几周内,自本周期开始以来第二次, 50 天价格移动平均线(MA)穿过了 200 天 MA。事实上,过去我们很少看到这样的形态在短时间内发生两次。历史上,这种事件只在 2015-2017 年的牛市期间发生过一次。
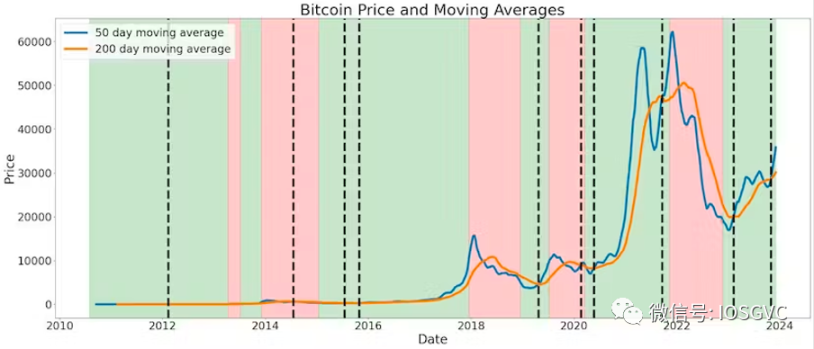
来源:IOSG Ventures
那时,在 2015-2017 年牛市周期的第二次 50/200 天 MA 交叉后,BTC 的结果如下:
90 天后 - 回报率为 1.27 倍
180 天后 - 回报率为 1.43 倍
365 天后 - 回报率为 2.26 倍
纵观比特币价格的整个历史上, 50 天 MA 仅在 6 个实例中跨越了 200 天 MA。从概率上讲,可以预测超过 80% 的可能性(历史上 6 次事件中的 5 次),在交叉发生的一年后会有正收益回报。
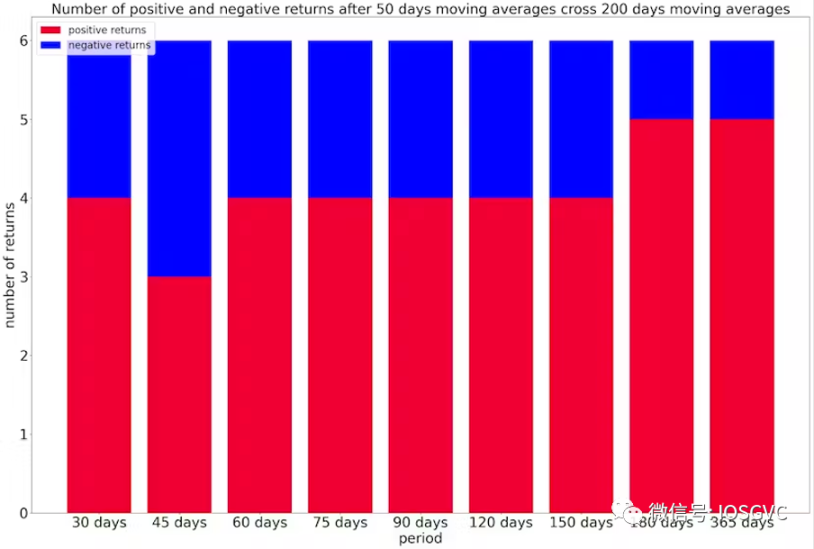
来源:IOSG Ventures
平均而言,在牛市交叉事件之后,预期的比特币(BTC)回报率如下:
90 天后: 1.1 倍
180 天后: 1.33 倍
365 天后: 2.5 倍
崎岖前路
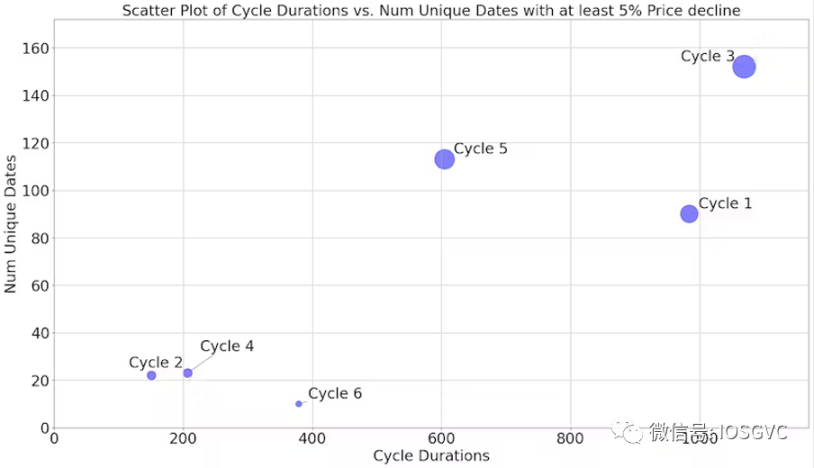
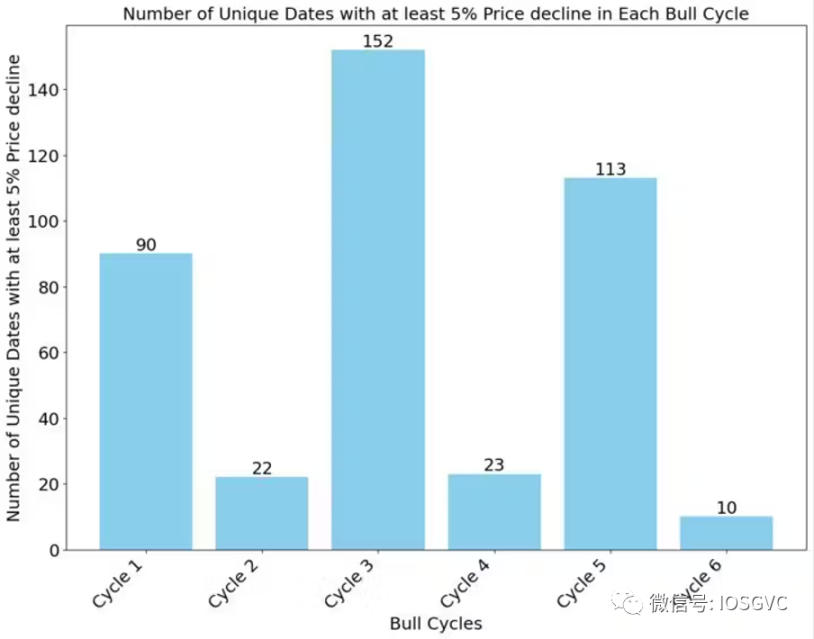
据 IOSG 观察,出本轮牛市周期所表现出的平滑程度超过了比特币历史上的任何一轮周期。
在比特币走向顶峰的过程中,上一轮周期经历了近 115 次 5% 或以上的每日修正(这里我们将负收益称为修正),而本轮周期只经历了 10 次这样的修正。即使是持续时间较短的周期,其修正次数也多于本轮周期。
迄今为止,没有一个牛市周期是以少于 20 次 5% 以上的每日修正结束的。因此,如果本轮牛市周期与前几轮牛市周期的特征相似,我们预期,在市场过渡到看跌情绪之前,随着市场继续上升,至少还会出现 10 次修正。
来源:IOSG Ventures
BTC 减半的影响
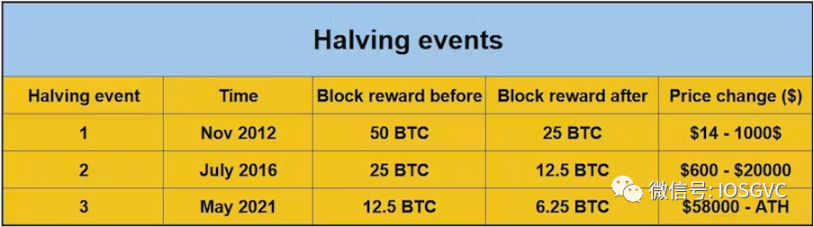
比特币减半是网络内的预设事件,大约每四年发生一次,特别是当 210, 000 个区块被挖出时。在减半期间,新 BTC 的生成速度会减半。
这对比特币矿工有显著影响,因为他们的挖矿奖励也会减半。因此,挖矿的竞争变得更加激烈,促使矿工寻求成本效益更高的能源来维持他们的运营。
此外,减半还大大减少了新比特币流入市场的数量,这使得许多市场参与者认为减半是一种行情看涨催化剂。
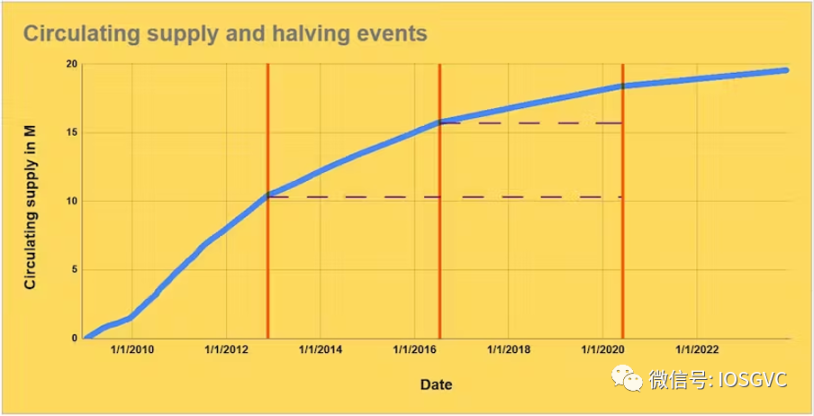
为了说明减半的影响,让我们来看看每次减半前后比特币的发行情况。在第一次减半之前,比特币的发行量超过了 1000 万枚。在第二次减半之前,比特币的发行量略高于 500 万枚,在第三次减半之前,比特币的发行量约为 250 万枚。
这些统计数据凸显了随着时间的推移,新的比特币发行量不断减少,强调了加密货币的稀缺性和长期升值潜力。
来源:IOSG Ventures
虽然仅对三个历史性减半事件进行分析,可能无法提供具有统计学意义的样本量来得出明确结论,但减半事件在比特币社区中的重要性及其作为看涨催化剂的广泛讨论不容忽视。有鉴于此,我们将在下文中深入探讨历史减半事件的相关数据。
来源:IOSG Ventures
下一次减半预计将于 2024 年 4 月左右在 840, 000 区块发生。挖矿奖励将降至 3.125 BTC。
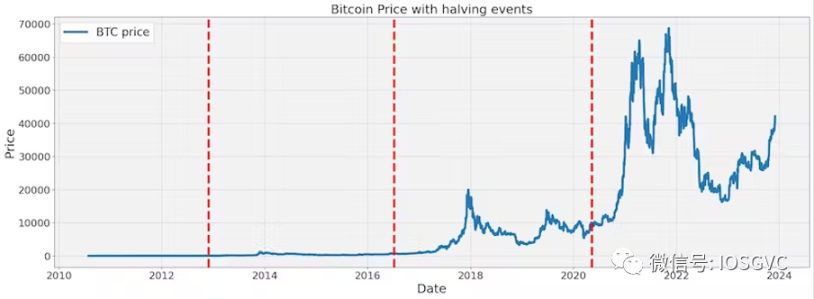
这些周期清晰可见,似乎与减半事件有关,从下图中可以清楚地看到减半事件后 BTC 价格的变化:
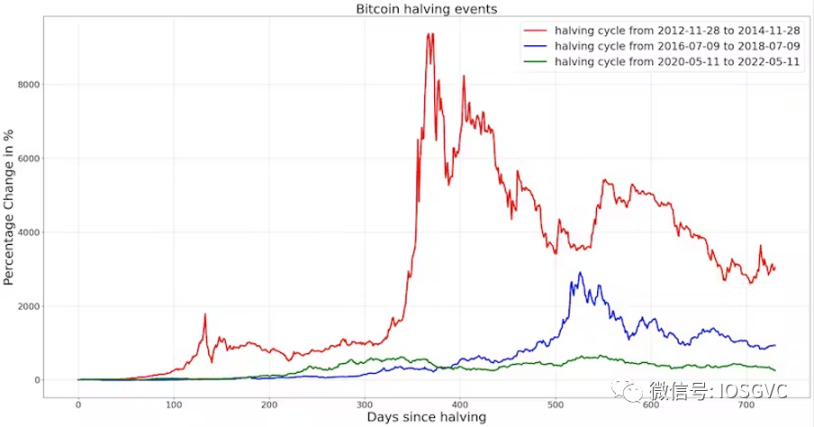
来源:IOSG Ventures
从百分比上看,随着 BTC 成为一种更加成熟的资产,减半的影响逐渐减小。在上一次减半事件后,价格在减半一年后上涨了 6 倍多。
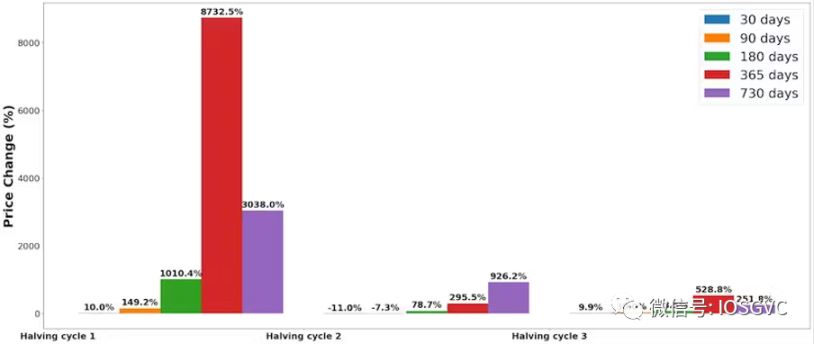
来源:IOSG Ventures
减半前时期的分析
在预期的减半事件中,我们也观察到了强劲的 BTC 价格走势,尽管没有达到减半后的强度。同样,在每个新周期中,涨幅都比较温和,从 400% 到 150% ,再到封顶前的 25% 。
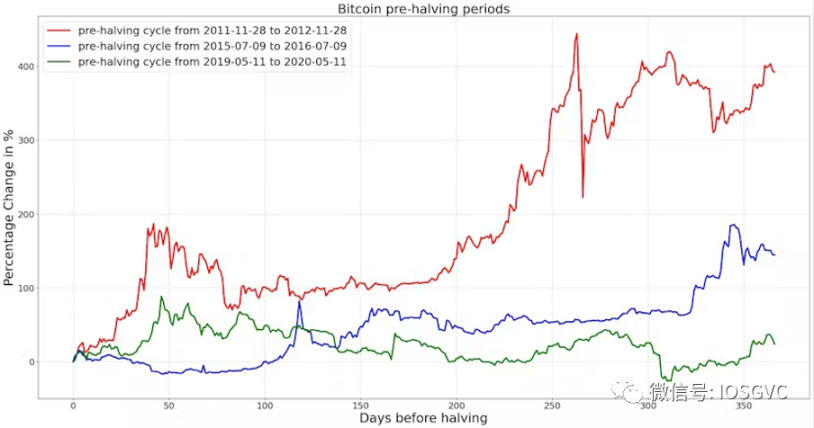
来源:IOSG Ventures
宏观和加密货币牛市周期重叠分析
在确定减半事件对加密货币市场周期性的影响之前,我们应该尝试分离全球宏观周期对加密货币的影响。
来源:IOSG Ventures
如上图所示,有很多重叠,尤其是在最近几年。因此,我们不能说减半事件在新周期开始的时间上起着决定性作用。虽然积极的宏观环境可能是决定加密货币周期性的主要因素,但减半周期以及其他特定的加密货币事件也可能会对牛市的规模产生重大影响。
来源:IOSG Ventures
加密货币交易者可能会密切关注宏观环境,利率、油价(能源成本)和正在进行的地缘政治战争的结果将对整个宏观周期产生重大影响。
在加密货币方面,到目前为止,主要的看涨触发因素是一系列备受瞩目的大型银行破产、对加密货币 ETF 产品的投机,以及 Binance 与监管机构之间的和解,这消除了最大的潜在黑天鹅事件之一。
结论
尽管我们对接下来的几个月仍持乐观态度,但周期从繁荣期到修正期的历史趋势提醒我们,达到估值过高的地步并不罕见。我们正处于一个过度自信和贪婪的临界点,在这个阶段,过度自信和贪婪往往会主导一切,从而可能导致大起大落的环境和违背理性的估值。
虽然这一分析表明,加密货币投资的热情有望进一步增长,积极的势头将继续保持,但我们也需要谨慎对待。
毕竟,与早期的周期相比,比特币目前的状态是一种更为成熟的资产。这一资产类别的日益制度化和成熟,引发了有效市场假说发挥作用的担忧。我们认识到,随着资产的成熟,历史模式分析可能会变得不那么适用。有鉴于此,用一种平衡和现实的视角来看待和分析市场是非常宝贵的。


