
How to make money in cycles (Complete): A guide to buying the bottom and escaping the top
1. Summary
This is the last article in our cycle series. The first three articles all analyzed cycles from a macro perspective. This article will mainly introduce how to use indicators to determine tops and bottoms and how to optimize investment strategies.
The first three articles provide guidance:
How to make money in cycles: Understanding and judging cycles (1)
How to make cyclical money (2): Look at the flow of funds from the perspective of the Federal Reserve’s monetary policy and stable currency
How to make periodic money (3): How to amplify your periodic returns
2. Five major indicators teach you how to judge the top and bottom
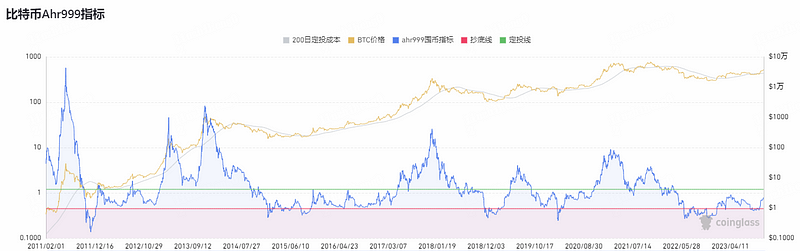
1. Ahr 999 coin hoarding indicator
Indicator introduction: This indicator was created by Weibo user Ahr 999 to assist Bitcoin fixed investment users in making investment decisions based on timing strategies. This indicator implies the return rate of short-term fixed investment in Bitcoin and the deviation of Bitcoin price from expected valuation.
how to use:
When ahr 999 index < 0.45, you can buy the bottom:
When the ahr 999 index is between 0.45 ~ 1.2, it is suitable for fixed investment;
When ahr 999 index > 1.2, the currency price is relatively high and is not suitable for fixed investment.
Live chart:https://www.coinglass.com/zh/pro/i/ahr999
It is recommended to read Hoarding Bitcoin written by the indicator author.
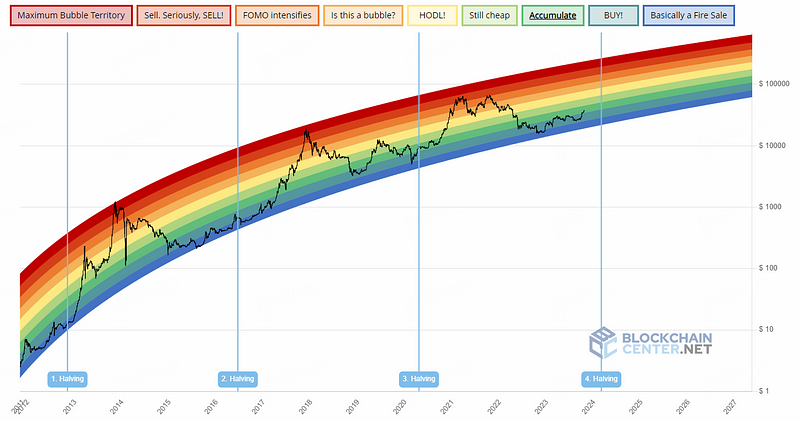
2. Rainbow picture
Indicator introduction: The rainbow chart is a long-term valuation tool for Bitcoin. It uses a logarithmic growth curve to predict Bitcoin’s potential future price direction.
It overlays a rainbow-colored band at the top of a logarithmic growth curve channel in an attempt to highlight market sentiment at each rainbow-colored stage as price moves through it. Thus highlighting potential buying and selling opportunities.
Bitcoin price continues to remain within the rainbow-colored bands of the logarithmic growth channel so far.
how to use:
The closer to blue, the closer the price is to the bottom
The closer to red, the closer the price is to the top
Live chart:https://www.blockchaincenter.net/en/bitcoin-rainbow-chart/
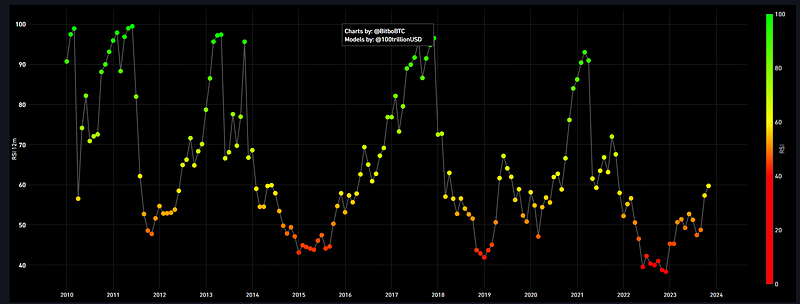
3、RSI
Indicator introduction: RSI (Relative Strength Index) is an indicator that measures the speed and magnitude of Bitcoin price changes. The RSI score is calculated based on the performance of the first 12 months of the observed month, which is used to judge the strength of the market trend. Weak, it is in the overbought or oversold range. The stronger the rise, the closer the RSI will be to 100, and a high RSI also means that the price changes have been more positive in the past 12 months; conversely, the stronger the fall, the closer the RSI will be to 0, and a low RSI value means that the price Changes are relatively negative.
how to use:
An RSI value of 30 or below (the closer to red) indicates that Bitcoin is oversold, or may soon become oversold, and it is appropriate to consider bargain hunting.
An RSI value of 70 or above (the closer to green) indicates that Bitcoin is overbought and may soon face a decline, and it is appropriate to consider selling.
Live chart:https://charts.bitbo.io/monthly-rsi/
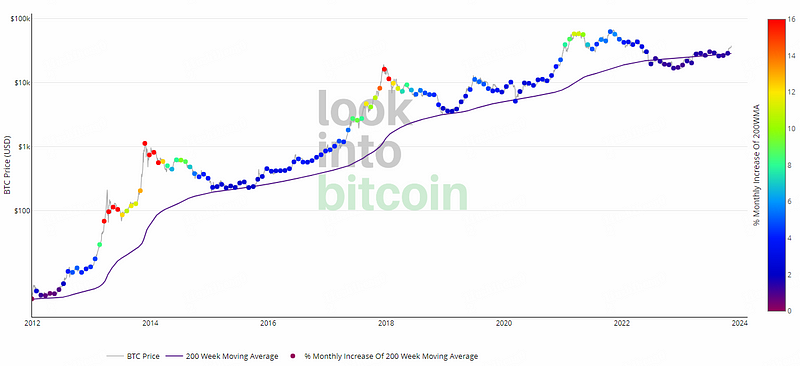
4. 200-week moving average heat map
Indicator Description: This indicator uses a colored heat map of percentage growth based on a 200-week moving average.
Assign a color to the price chart based on the month-over-month percentage growth of the 200-week moving average.
Historically, Bitcoins price has bottomed near the 200-week moving average in every major market cycle.
how to use:
The closer the dot color on the price chart is to red, it means the market is overheated and is suitable for selling;
The closer it is to purple, it means the market is too cold and it is suitable to buy.
It should be noted that the indicator failed at the top of the last bull market, which shows that the indicator cannot be completely relied on. Indicators are just a tool for us to assist our judgment, and we also need to consider many other factors to make judgments.
Live chart:https://www.lookintobitcoin.com/charts/200-week-moving-average-heatmap/
5、CVDD
Indicator introduction: CVDD stands for Cumulative Value-days Destroyed, and the Chinese name is Cumulative Value-days Destroyed.
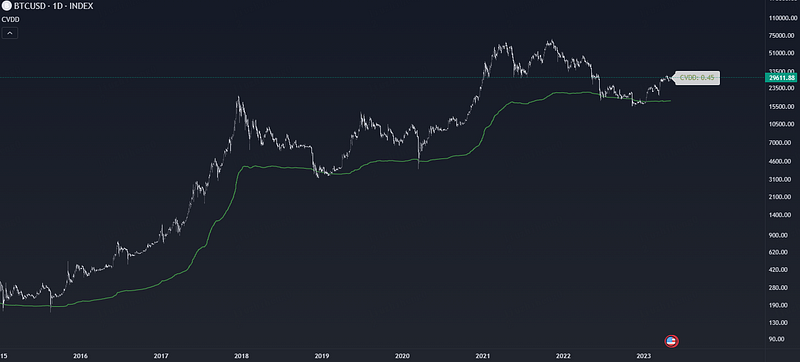
How to use: When the price of Bitcoin touches the green line, it means that the price of Bitcoin is seriously undervalued and it is a good buying opportunity.
Live chart:https://www.tradingview.com/script/3CEPlBsb-Cumulative-Value-Coin-Days-Destroyed/
Summarize
In order to make it easier for readers to use these indicators, we have made them into charts.
It should be noted that these indicators provide reference for the timing of buying and selling Bitcoin, and do not mean that other tokens can also be bought.
3. Strategies suitable for cyclical trading
When we conduct long-term trading, it is easy for situations like the picture below to occur. Many of them are caused by errors in subjective judgment. If you formulate a strategy in advance, you can avoid such errors.

1. Determine investment based on Martingale theory
Lets first understand the concepts of Martinale Strategy and fixed investment.
Martingale strategy: The Martingale strategy was originally a gambling strategy, which means that in a certain gambling market, every time you lose money, you increase your bet by a multiple of 2 until you win. Assume that in a fair betting market, the probability of opening high or opening small is 50%, so at any point in time, the probability of losing once is 50%, and the probability of losing twice in a row is 25%. The probability of losing three times is 12.5%, the probability of losing four times in a row is 6.25%, and so on. The more times you play, the smaller the probability of losing. In theory, it is impossible to lose if you have unlimited funds.
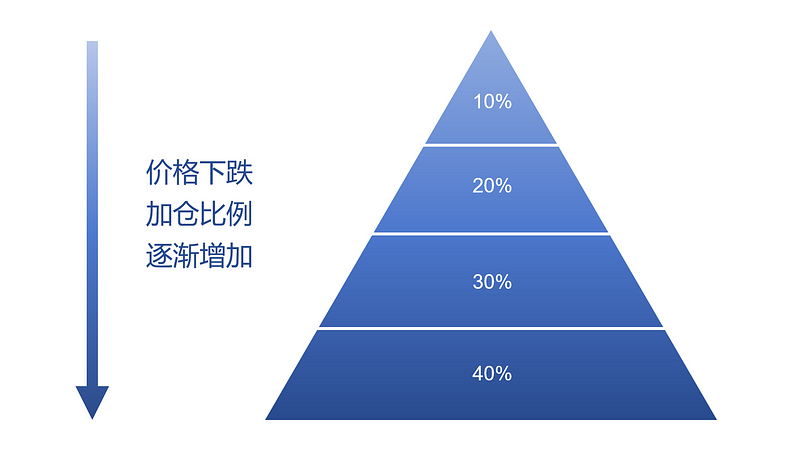
Later, the Martingale strategy was applied to trading, in the form of adding positions in a pyramid shape (the Martingale strategy can be subdivided into reverse Martin, forward Martin and scalp Martin, and the one we introduce here is a reverse Martin).
Fixed investment: Fixed investment is a long-term investment strategy that spreads the purchase price evenly by purchasing assets regularly and on a planned basis. This strategy emphasizes continued investing and long-term holding rather than trying to make profits through short-term market fluctuations.
When we use the above indicators, it is impossible for these indicators to tell us the precise bottom and top escape points. They can only judge the relative bottom and top in a cycle, and we cannot keep staring at the indicators. This is why we need to make fixed investments. s reason.
How to formulate a strategy: We can apply the ideas of Martingale strategy to fixed investments, thereby minimizing the average price of our positions. The specific strategy can be formulated as follows: The current Bitcoin price is $37,000, assuming that fixed investment starts from this price. Based on the above indicators, it can be judged that the current Bitcoin price is at a position that is neither high nor low, and you can make a fixed investment. We set the base amount of fixed investment at 1,000 yuan and the frequency of fixed investment at once a week. In the weekly fixed investment, if the price rises by $1,000, the amount of our fixed investment will be reduced by 5%. If the price drops by $1,000, the amount of our fixed investment will be increased by 5%. Of course, the premise is that the Bitcoin price is still at the fixed investment level based on the indicators. within the interval. When Bitcoin rises beyond this range, the fixed investment plan will be suspended. After returning to the fixed investment range, continue fixed investment or focus on indicators to reduce positions. These strategy parameters are just examples. Different strategy parameters will naturally result in different returns. Readers can formulate their own fixed investment strategies based on this process.
Disadvantages: The Martingale strategy is known as never losing money, but this is based on the premise that the trading target will not return to zero and the traders funds are infinite. Therefore, the Martingale strategy is not suitable for trading long-tail assets. The greater the amount of funds a trader has, the more advantages of the Martingale strategy will be reflected.
2. How to use grid strategies to expand profits
When we make long-term investments, we hold Bitcoin spot in hand and deposit it into a decentralized lending platform. The APY is not high. If we deposit it into an exchange for financial management, the APY is considerable but there is a limit. If you want to improve capital utilization and earn extra income, using spot grid is a good choice.
Spot grid strategy: The spot grid strategy is an automated strategy that executes buying low and selling high in a specific price range. The user only needs to set the highest price and lowest price in the range and determine the number of grids to be subdivided, that is, You can start running the strategy; if necessary, you can also set the trigger conditions in advance. When the market conditions reach the trigger conditions, the strategy will automatically start running. The strategy will calculate the price of buying low and selling high in each small grid, automatically placing orders, and as the market fluctuates, it will continue to buy low and sell high to earn profits from fluctuations.
How to formulate a strategy: Generally speaking, the grid strategy is suitable for volatile market conditions or volatile upward markets, but it is not suitable for unilateral market conditions. The shortcomings of the grid strategy are obvious. When the price rises or falls outside the set range, it will sell out or take over. This is why some people call it a junk strategy. We have optimized the grid strategy. We do not choose the traditional grid strategy of conventional non-stablecoins/stablecoins. We choose the ETH/BTC trading pair to use with the infinite grid strategy.
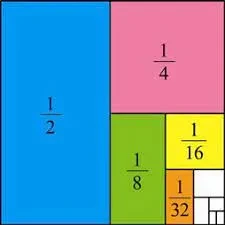
The infinite grid strategy is an advanced version of the ordinary grid strategy. Infinite Grid ensures that users hold equivalent denominated currency assets in rising markets. Using the infinite grid strategy, no matter how many times the user sells, he or she still owns assets of the same value as the previous position. For example, if the initial price value is 20,000 USDT/BTC, and the user owns 1 BTC, he will have 20,000 USDT assets in investment. When the price rises to 40,000 USDT/BTC and sells 1/2 units, the user still has 1/2 units and still has 20,000 USDT assets in investment. When the price rises to 80,000 USDT/BTC, and then sells 1/4 units, the user still owns 1/4 units, and I still have 20,000 USDT assets in investment. The infinite grid does not have a definite top range, so using the infinite grid strategy can well avoid the overselling situation caused by the continued rise in prices.
So why did you choose the ETH/BTC trading pair? Our idea of optimizing the grid strategy is to avoid the losses caused by the price exceeding the grid range. However, due to the characteristics of the grid strategy itself, it cannot solve the losses caused by the falling prices. We can only deal with the losses caused by the falling prices. Make a reduction. ETH/BTC reflects the relative strength of the trend between ETH and BTC. From a cyclical perspective, the ETH/BTC exchange rate fluctuates upward in a bull market and fluctuates downward in a bear market. ETH/BTC The trading pair is a good match for the infinite grid strategy, which is suitable for long-term slow bulls. And now we can not only obtain BTC-based returns, but also gains from the bull market rise of ETH and BTC.
4. Summary
Although the indicators and profit methods introduced in this article all use Bitcoin as the investment target, readers can also draw inferences from one example and use the idea of buying the bottom and escaping the top to invest in other currencies. Moreover, changes in the price of Bitcoin also have guiding significance for the trends of other currencies, especially mainstream currencies with high market capitalization.
No matter what indicator it is, it has its inherent invariance. Although black swans often appear in the market, the crypto market will not return to zero. As long as it does not return to zero and there are people involved, prices will continue to rise and fall. There are cycles, not only for The estimation of value is also tested over time. For ordinary investors, as long as they make good use of the cycle and reap the dividends of industry development, they will be fine. Not only in the currency circle, but also in other industries, the multiple is not important, the continued survival is the most important. What the currency circle lacks is not opportunities, but the inability to continue to participate.
Reference article:
1. Detailed explanation of 5 models of Bitcoin price and current conclusions
2.What is an infinite grid?


