
Through on-chain data mining, NFT price manipulation behavior.
Introduction
In a recent article, we analyzed wash trading activities conducted to obtain trading rewards. Among them, we briefly introduced another type of wash trading aimed at misleading the market, manipulating market prices, and/or artificially increasing trading volume. In this article, we will use DenDekaDan Genesis Omikuji as an example to share our research on market manipulation behavior in the NFT market. In this series, we have discovered a series of abnormal behaviors that seem to be orchestrated to artificially inflate prices.
Wash trading activities conducted to obtain trading rewards are usually easy to identify because they typically involve back-and-forth transactions between a few fixed wallets. This type of wash traders have no motive to hide the fact that a token is being traded amongst the same person/entity, mainly because the NFT market (primarily X2Y2 and LooksRare) does not penalize this behavior when distributing trading rewards.
On the other hand, wash trading activities that involve creating false information to artificially inflate the value of NFT collectibles are usually carried out in a more covert but organized manner. Parties that may be interested in these market manipulation behaviors include: NFT projects, market makers, or whales with sufficient capital and technical expertise to influence the entire market. More importantly, to conceal the fact that trading volume is solely created by a few entities and prices are inflated through back-and-forth transactions between a few entities, this market manipulation behavior often involves the use of numerous wallets, making it difficult to detect the manipulation signs by focusing solely on a few addresses.
Methodology
To effectively identify organized market manipulation behavior behind NFT transactions, we focus on analyzing two types of data:
Trading data: This includes on-chain data such as transactions and prices (transaction price and floor price), as well as off-chain data such as asks and bids data.
Address correlation: This involves studying the fund correlations between traders, such as the history of fund transfers between wallets, whether wallets have the same source of funds, and whether wallets have the same destinations for funds.
By studying trading data, we can discover suspicious trends in prices and trading volumes. By gaining a deeper understanding of the connections between wallets, we can investigate whether there are entities controlling a large number of wallets for trading and examine their behavior.
Case Study: DenDekaDan Genesis Omikuji
We want to understand why the floor price of this series skyrocketed from 0.05 E to 2.5 E (a growth of 5000%!) after the first week of its launch on December 31, 2022. After researching the data, we found:
The combination of floor price trends, transaction prices, and the distribution of bid prices reveals suspicious patterns that may imply the presence of price manipulation.
In the addresses involved in the transactions of this series during the first week, it can be observed that many addresses are linked by funds.
Discovery 1: Floor price shows a consistent upward trend
This series was released on December 31, 2022. In the first week after the release, the floor price showed a consistent upward trend.
Firstly, around January 1st, the floor price increased to about 1 E. In the next four days, i.e. January 2nd to January 5th, the price increased by approximately 0.5 E every other day (January 3rd, January 5th). After reaching about 2 E, the floor price remained in the range of 2-2.5 E. This consistent upward trend may be a coincidence, but it is also highly suspicious, prompting us to further investigate.
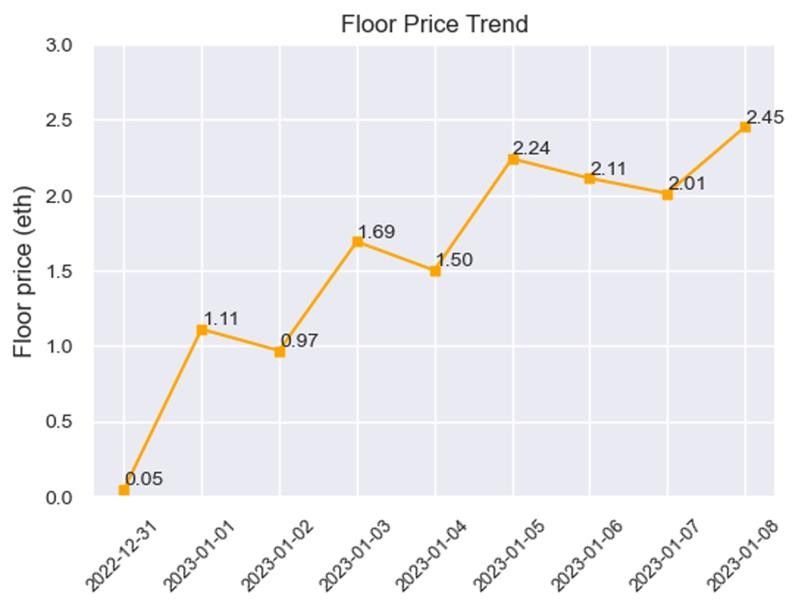
Figure 1: The floor price increased regularly in the first week after the release.
Discovery 2: The distribution of trading volume and trading price is also suspicious
When comparing the daily trading volume with the trend of floor price changes, we found that on days when the floor price significantly changed (December 31, January 1, January 3, January 5), the trading volume was much higher compared to days when the floor price was relatively stable (such as January 2, January 4, January 6, etc.). This seems to suggest that someone is conducting a large volume of trades to influence the floor price on January 1, January 3, and January 5.
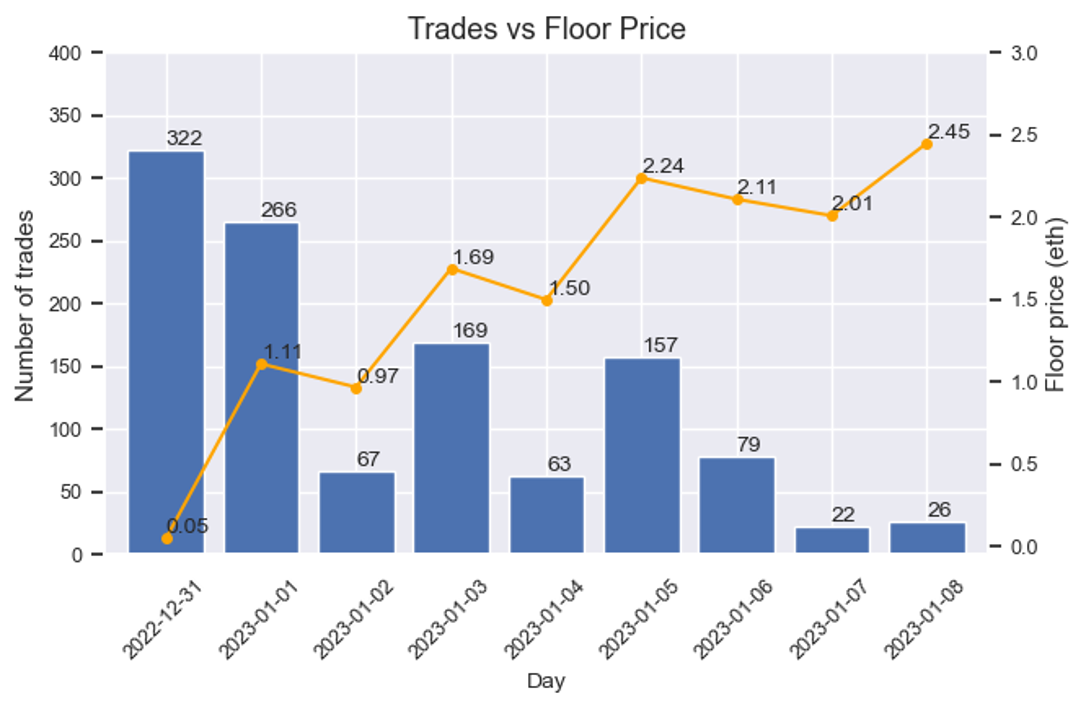
Figure 2: Trading volume soared on the day when floor prices rose.
To validate this hypothesis, we further studied the price distribution of all transactions that occurred within the first week. As shown in the following chart (different colors represent transactions on different dates), almost all daily transactions occurred below the floor price of that day. This finding is interesting because the most direct way to raise the floor price to the target position is to clear all pending orders below the target price. This is another signal that indicates the presence of organized price manipulation.
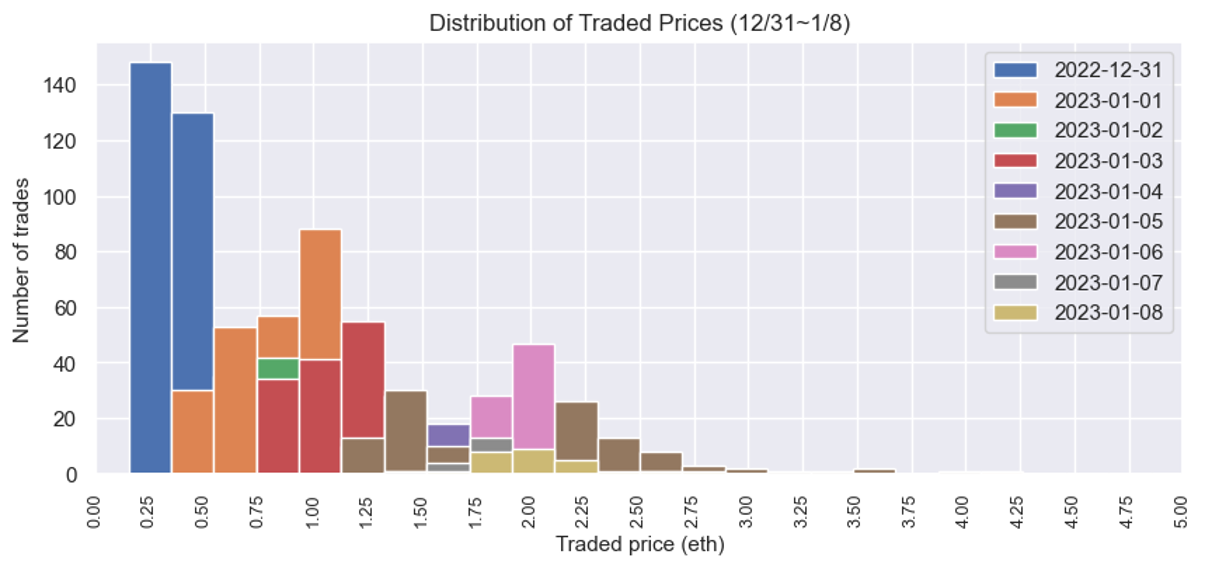
Figure 3: Price distribution of transactions in the first week after publication
Discovery 3: The distribution of pending order prices is similar to the distribution of transaction prices
Another important aspect in raising the floor price is to create pending orders (because the floor price equals the lowest asks price). By observing the distribution of pending order prices, we found that it follows a pattern similar to the distribution of transaction prices. Specifically, pending order prices systematically move from lower to higher prices. In normal circumstances, when a collection is just released and a consensus on its value has not yet formed, we should see sellers placing more diversified asking prices for pending orders.
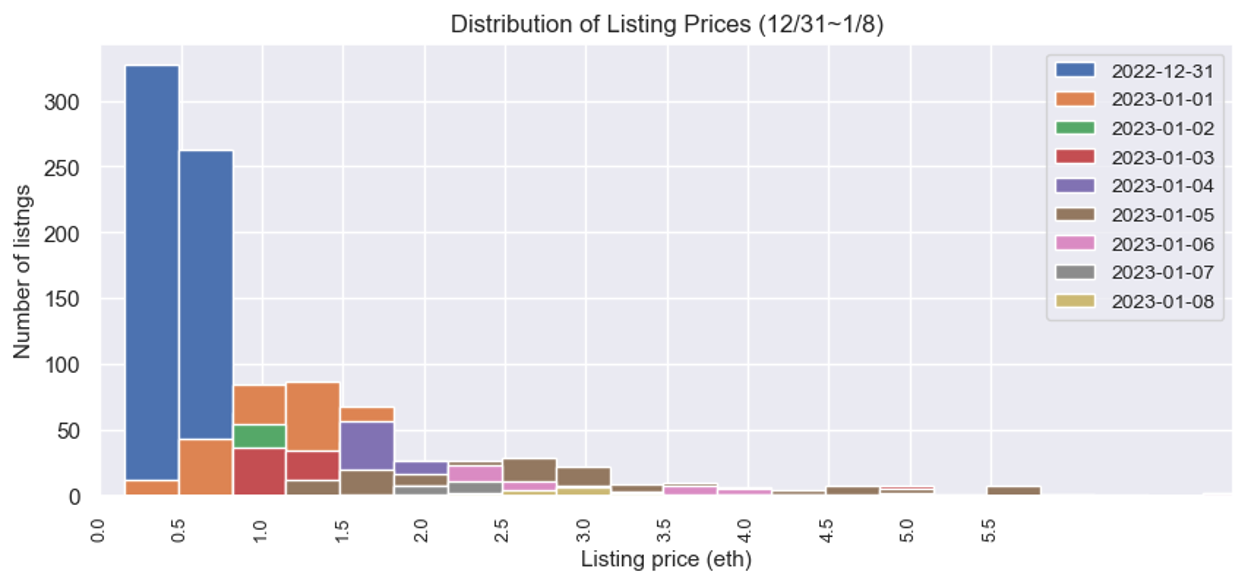
Figure 4: Distribution of order prices in the first week after publication
Discovery 4: Address Correlation
We found that based on the ETH transfer relationships between wallets, 141 addresses (15%) of all traders in the first week can be linked together. These addresses account for approximately 40% of the trading volume in the first week. They may be controlled by the same entity behind them, given the significant volume of transactions generated by these addresses, and they may be manipulating prices. (Note: The research in this article was conducted before we developed an address clustering algorithm that can more accurately identify relationships between addresses, so the address correlation data here may have a certain degree of bias. However, we want to emphasize that identifying address clusters is very helpful in investigating potential market manipulation.)
Conclusion
In this study, we shared a framework for analyzing NFT price manipulation based on our experience and industry knowledge. Although it can reveal some suspicious phenomena and behaviors, we are also aware that this framework is not yet complete and we continue to improve our research methods. Due to the rarity of similar studies, we hope to contribute to the NFT field and the on-chain data analysis community by sharing our approach. At the same time, we hope that this study will spark more attention to NFT market manipulation and promote further research and analysis. We believe that, with the collective efforts of the community, we can gain a deeper understanding of these issues and contribute to the sustainable development of this field.
About the Authors
This analysis research report is jointly written by Helena L. and Lin S. from Eocene Research. Follow us on Twitter to stay updated with more of our NFT analysis and research.


