
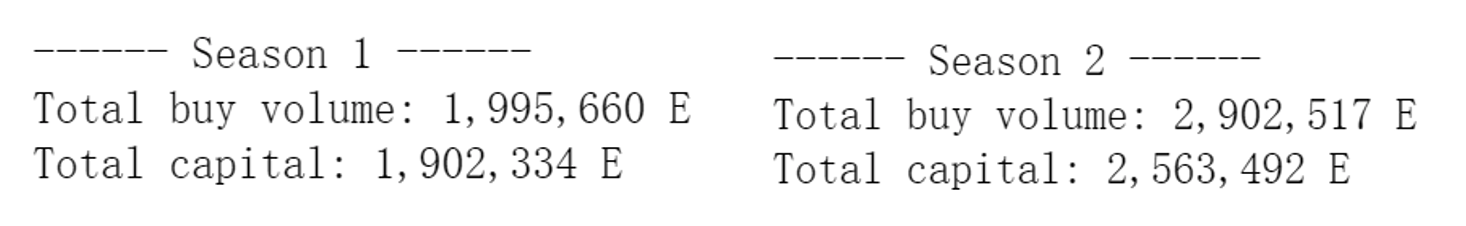
Data reveals whether the growth of the NFT market in 2023 is driven by new capital entry or old capital cannibalization.
We studied the transaction volume and investment proportion of new and old address entities in the entire NFT market in 2023 using on-chain data analysis and address clustering algorithms, as well as the sources of transaction and investment increment. This reveals whether the activity and new momentum in the NFT market mainly come from existing players or new entrants outside the market.
Since the bear market in the NFT market started at the end of June 2022, there has been some improvement in transaction volume after Blur launched the Airdrop incentive mechanism at the end of 2022 (Figure 1). During Blur's airdrop activity, its contribution to the overall transaction volume in the NFT market has been increasing (Figure 1).
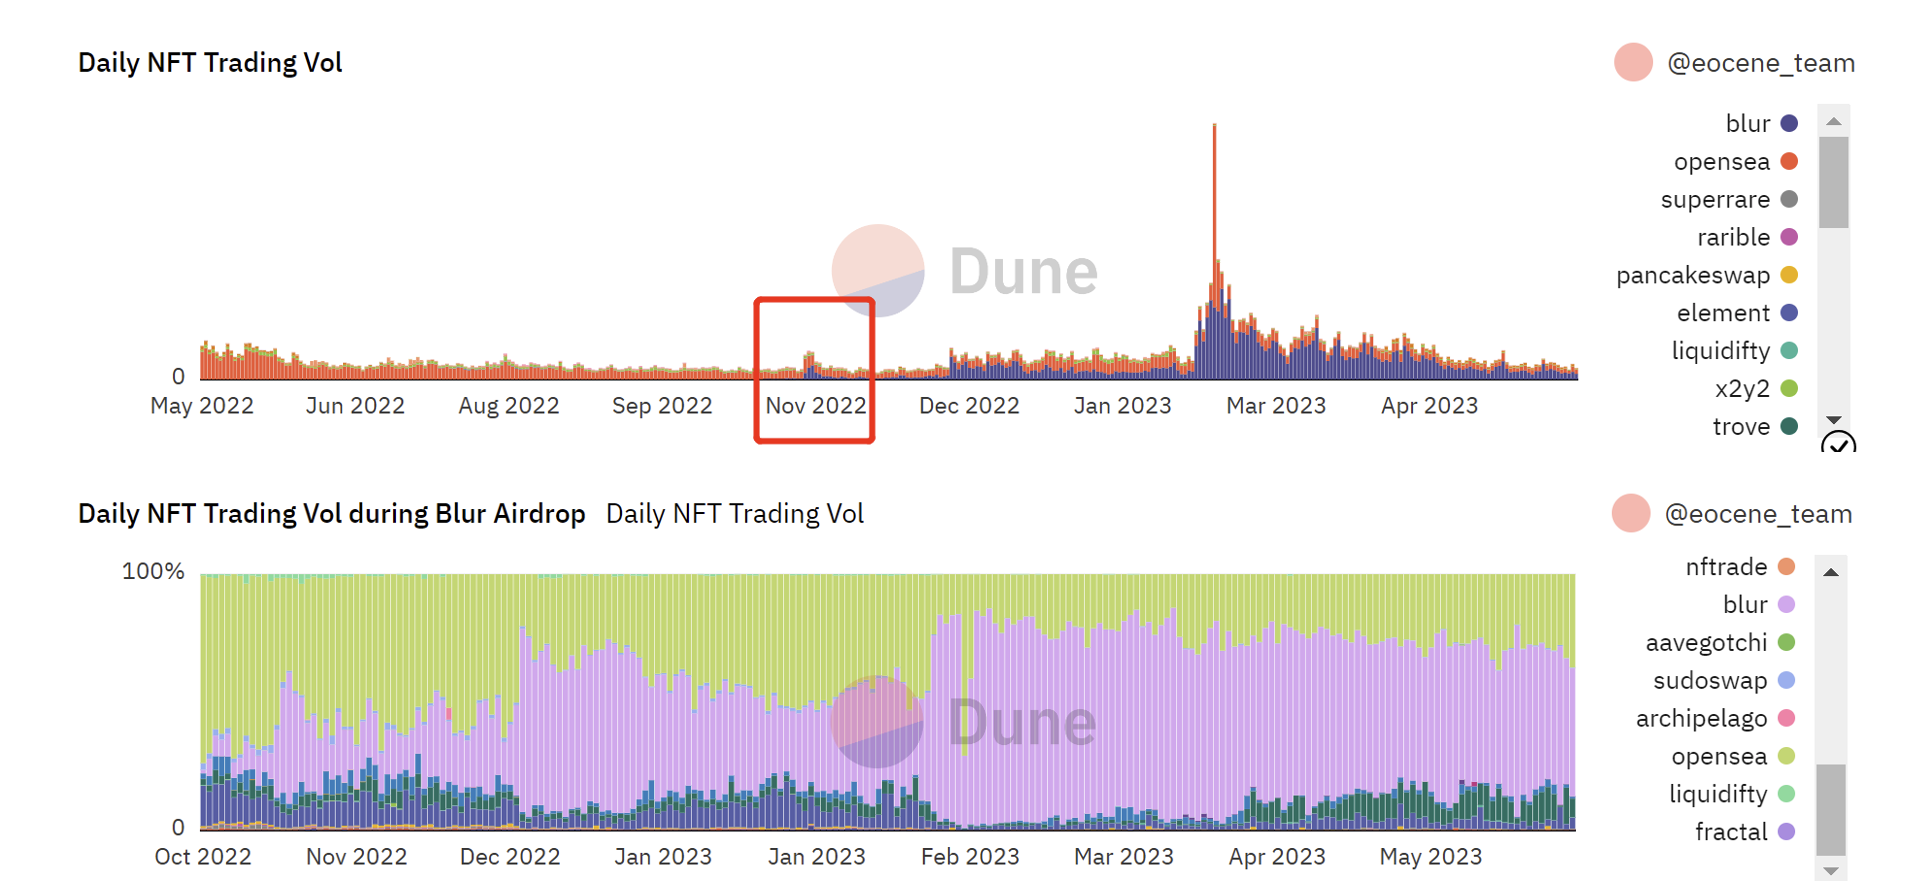
Figure 1 NFT daily transaction volume
The reward mechanism of Blur's airdrop and the successful issuance of tokens undoubtedly are the biggest factors behind the surge in NFT transaction volume in 2023. However, behind the surge in transaction volume, what is the real situation of the entire NFT market? In other words, is there actual incremental funding within the on-chain NFT market and new capital inflows, or is it mainly the concentration of existing funds?
We 1) investigated the sources of incremental transaction volume and funding in the entire NFT market in the second quarter compared to the first quarter, and 2) compared the transaction volume and investment proportion of different address entities in the NFT market during Blur's first quarter and second quarter airdrop activities.
Research Process
1. Obtain transaction volume data for each address
First, we select the time intervals for study as period A (October 19, 2022 - February 14, 2023) and period B (February 15, 2023 - May 31, 2023) [1];
Second, we conduct the study from the perspective of buyers, focusing on the transaction volume and funding in the NFT market, as the main focus is on "participants' investment in NFTs";
Furthermore, during the research period, there are many participants in the NFT market. However, the data shows that only 8% of the total number of addresses account for 90% of the total trading volume/money volume in the NFT market. Therefore, for analysis purposes, we define the scope of our study as "the top trading volume addresses that contribute to 90% of the total trading volume/money volume in each time period." As a result, a total of more than 7,000 addresses were selected;
Finally, we excluded wash trades[2], and obtained the true trading volume and number of trades for each address.
[ 1 ] Period A corresponds to Blur's first quarter airdrop, and period B corresponds to Blur's second quarter airdrop. The dividing line is set on the day of BLUR token distribution, which is February 14th. This is because BLUR's rapid distribution significantly boosted the activity in the NFT market.
[ 2 ] Wash trades exclusion rule: buyer = seller, buyer and seller have the same EOA source of funds.
2. Funding Situation Based on Trading Volume and Number of Trades
Based on the transaction volume and number of transactions for each address obtained earlier, calculate the amount invested by each buyer in different NFT collections for each token_id [ 3 ];
Sum up the total amount invested by each buyer to derive the funding amount for NFT from each address.
[ 3 ] When token_standard=erc 721 , each token_id corresponds to the same token, so the amount invested for each token_id is the average price paid for buying that token_id (Average price = Total payment amount / Number of purchases); when token_standard=erc 1155 , each token_id can correspond to multiple tokens, so we assume that the amount invested for each token_id is the total amount spent on buying that token_id.
3. Clustering different entities based on addresses
Based on the logic of fund association, addresses that are highly likely to be controlled by the same entity are grouped together to study the sources of trading volume and fund volume in two time periods based on the entity dimension.
We define clustering based on the following criteria [ 4 ]: 1) There has been a transfer of eth or stablecoins between addresses; 2) The two addresses must have transferred funds to each other, with the number of transfers in one direction being >= 3 and in the other direction being >= 1 ; 3) Limited to transactions in the year 2023 between the addresses.
Use algorithms to cluster addresses according to the above criteria, obtain different address groups, use s1_ind and s2_ind to identify whether the addresses have participated in NFT transactions in time period A and time period B [ 5 ]. If at least one address in the address group has s1_ind=1, the address group is an old entity; if all addresses in the address group have s1_ind=0, the address group is a new entity.
[ 4 ] Our algorithm can identify the direct or indirect connections between wallets. "Direct" refers to interactions between NFT players that meet certain criteria. When multiple NFT players have interacted with the same address (regardless of whether that address is within the scope of analysis) and their interactions meet the above criteria, an "indirect" connection is formed between these NFT players.
[ 5 ] and 1 _ind= 1 and 2 _ind= 1 indicate that the address participated in NFT transactions in both time periods; and 1 _ind= 1 and 2 _ind= 0 indicate that the address only participated in NFT transactions in time period A; and 1 _ind= 0 and 2 _ind= 1 indicate that the address only participated in NFT transactions in time period B.
Research Findings and Analysis
1. Data Results[ 6 ]secondary title
[ 6 ] The output of the transaction volume and fund volume from the perspective of addresses and entities in time period B is to compensate for the possible defects in address clustering (such as incorrectly attributing the addresses of some new entities to old entities, resulting in inflated transaction and fund volumes of old entities) in order to obtain a benchmark for the data.
1.1 Transaction volume and fund volume in two time periods respectively:
Transaction volume and fund volume in time period A and time period B
1.2 New and Old Addresses[ 7 ]Transaction and capital volume in time period B (left in ETH; right as a percentage):
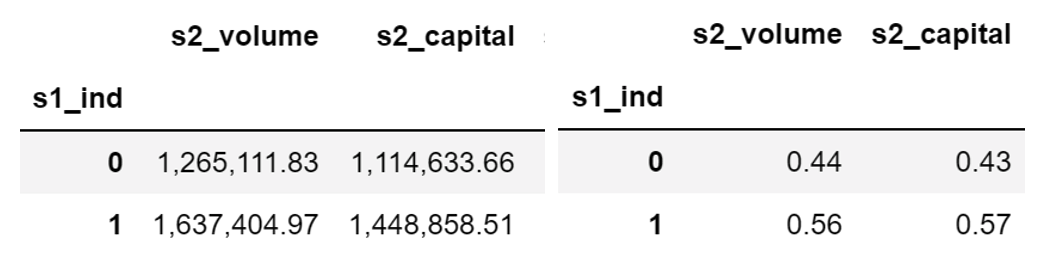
Transaction and capital volume of new and old addresses in time period B
[ 7 ] s 1 _ind= 1 is the old address, s 1 _ind= 0 is the new address.
1.3 New and old entities[ 8 ]The volume of transactions and funds in time period B (left in ETH; right in percentage):
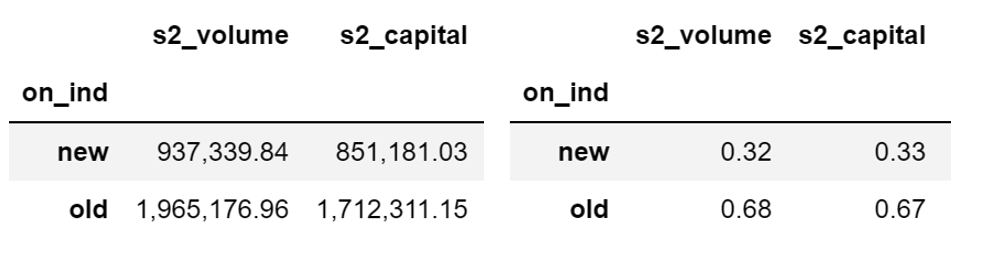
Trading volume and capital volume of old and new entities in time period B
[ 8 ] if on_ind=old, it represents the old entity, and if on_ind=new, it represents the new entity.
2. Result Analysis
2.1 Growth of NFT on-chain funds
The total trading volume and capital volume in time period B are both higher than in time period A, with absolute increment values of trading volume and capital volume being 906, 857 E and 661, 159 E, respectively. Both trading volume and capital volume show an upward trend, indicating an overall growth trend in the NFT market.
2.2 Source of new funds
The increase in funding is less than the funding of the new entity in time period B (661,159 E vs 851,181 E), so the majority of the new funding comes from the new entity, while the funding from at least some of the old entities invested in the NFT market is shrinking.
2.3 Proportions of trading volume and funding volume between new and old entities
Considering the trading volume and funding volume data from the perspectives of addresses and entities in time period B, the proportions of trading volume and funding volume from old entities are roughly between 55% and 70%.
The trading volume and funding volume of old entities account for more than half in time period B, indicating that old entities are the main contributors to the activity in the NFT market;
However, it should be noted that the difference in proportions between new and old entities is not significant, so we believe that the contribution of new entities to the NFT market should not be ignored.
Conclusion
By studying the proportions of trading volume and funding input between new and old entities in the NFT market (with old entities accounting for around 60%), as well as the sources of trading volume and funding increase (mainly from new entities), we believe that the old players (old entities) are the main contributors to the activity in the NFT market, while the new entrants from outside (new entities) are the source of new momentum in the NFT market.
It is important to note that the increase in funding and the entrance of new players do not necessarily mean the booming growth of the NFT market. This is because the majority of the increase is concentrated on Blur, most likely attracted by token rewards rather than the value of NFTs themselves. How to maintain the long-term prosperity of the NFT market after the airdrop remains a big challenge faced by the market as a whole.
About the Authors
This research analysis report is co-authored by Helena L. and Huang Z. from Eocene Research. Follow us on Twitter for more of our NFT analysis and research.


