
九大核心指标揭秘加密牛市巅峰信号
2025-02-05 02:07
本文约671字,阅读全文需要约1分钟
九大核心指标揭秘加密牛市巅峰信号。
AI总结
展开
九大核心指标揭秘加密牛市巅峰信号。
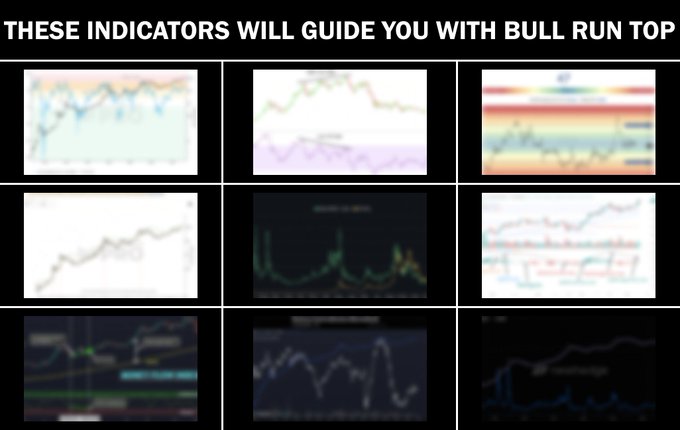
如何精准预测牛市顶点?这 9 个关键指标你必须掌握!
精准预测加密市场牛市顶点 几乎不可能,但你可以通过这些数据指标来判断市场是否接近顶部。
如果 5 个信号同时出现,那么你要么已经积累了足够财富,要么只能回去麦当劳打工了……
现在,就让我们一起揭开牛市终点的秘密。
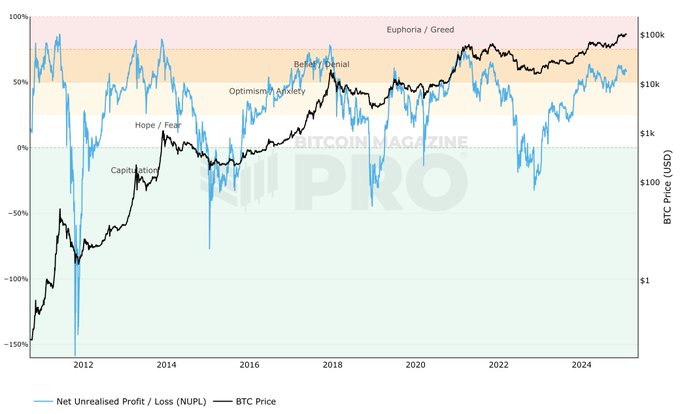
1. NUPL(未实现净利润/亏损)
市场情绪指标
当 NUPL 进入 狂热/贪婪区(超过 75% ),通常意味着市场已经接近顶部,投资者开始过度乐观。
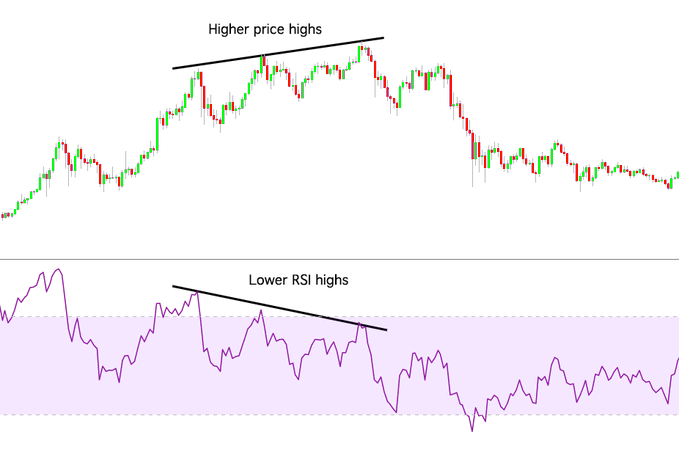
2.RSI(相对强弱指数)
短期超买信号
当 RSI 超过 90 ,市场通常处于极端超买状态,历史数据显示,高点 通常在 4-7 周内形成,随后回调。
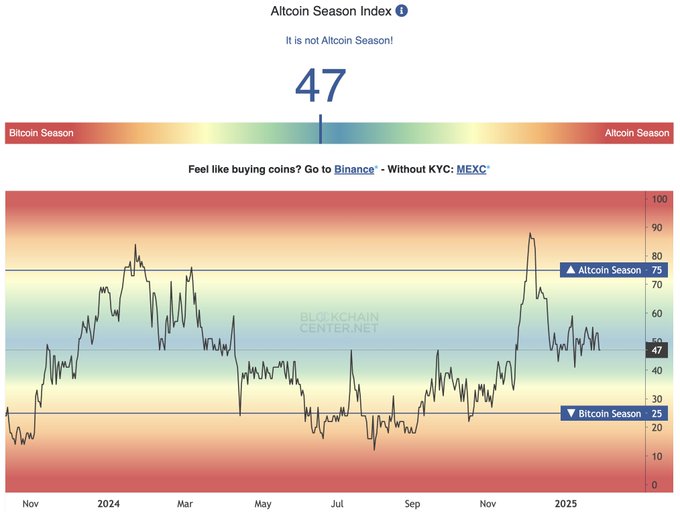
3.山寨币季节指数(Altcoin Season Index)
山寨币 vs 比特币
当 指数超过 85 ,意味着山寨币整体跑赢比特币,这通常是市场进入狂热阶段的标志。
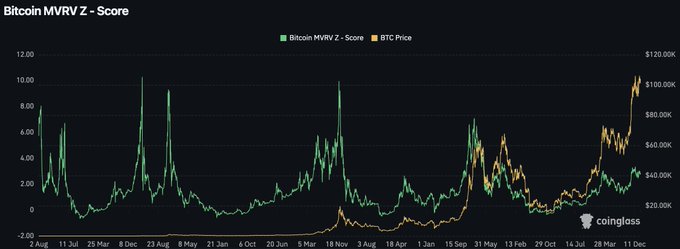
4. MVRV Z-Score(市场价值 vs 实际价值)
判断市场是否被极端高估
当 MVRV Z-Score 超过 6 ,表明市场可能接近顶部,需要警惕潜在回调风险。
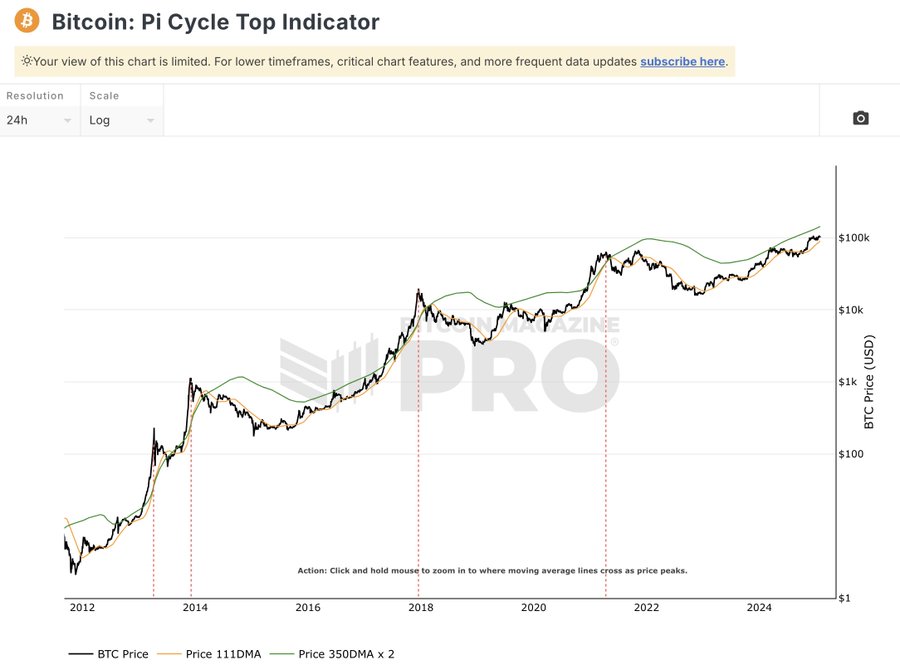
5.Pi Cycle 顶部指标
精准识别比特币牛市顶点
这一指标在 多个周期 成功预测了比特币的主要价格高点。
当其发出警告信号时,意味着牛市 即将见顶。
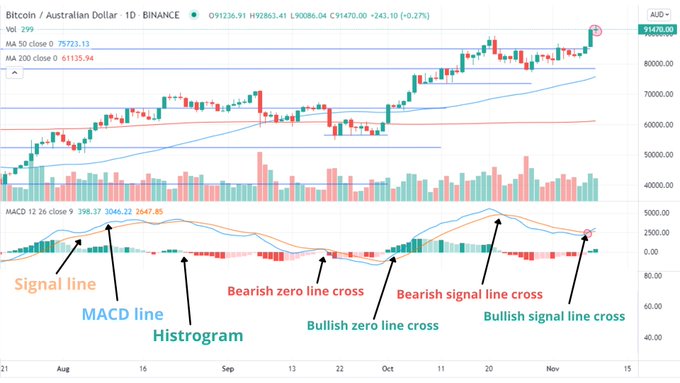
6. MACD(移动平均收敛发散)
趋势变化与动能信号
当 MACD 出现死叉,意味着市场动能正在减弱,趋势可能反转。
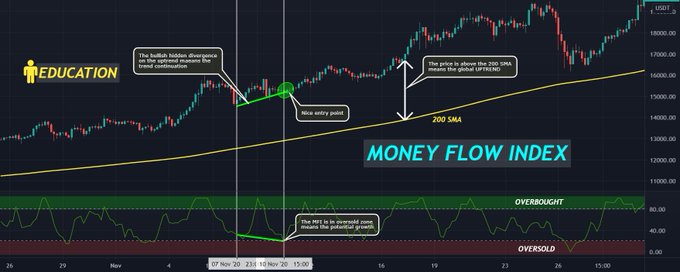
7.MFI(资金流量指数)
买卖压力监测
类似 RSI,但 MFI 结合了 交易量数据,当其显示 极端超买,通常预示市场见顶。
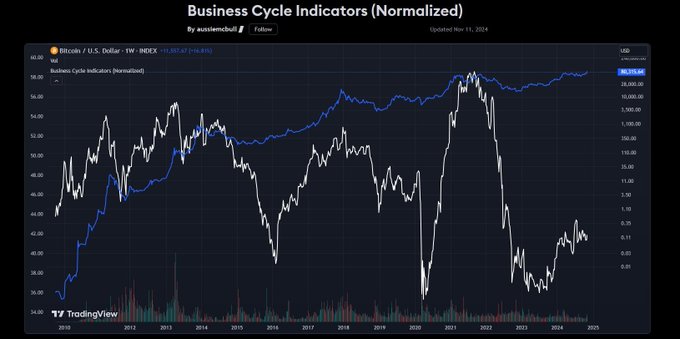
8.综合商业周期指数(Composite Business Cycle Index)
宏观经济影响
当该指数 超过 50 ,表明市场可能即将进入高峰阶段。
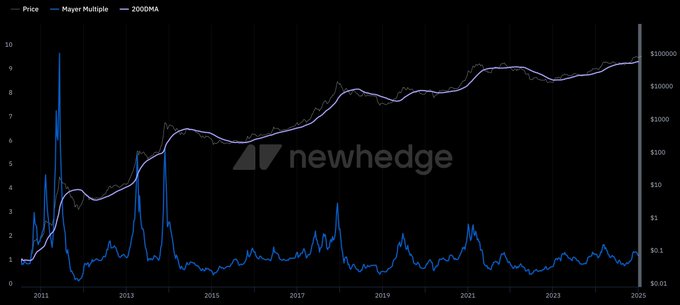
9.Mayer Multiple(迈尔倍数)
价格 vs 200 日均线
历史数据显示,当 Mayer Multiple 达到 2.4 时,比特币通常处于牛市巅峰。
结论
虽然市场顶点难以精准预测,但这 9 大指标 可以帮助你 更科学地评估市场位置。牛市狂潮能让你赚得盆满钵满,但若没有清晰的退出策略,也可能让你一夜回到解放前。
BTC
ETH
欢迎加入Odaily官方社群
推荐文章


