LD Capital宏观周报(12.18):鲍威尔意外的鸽派让市场激进的再定价

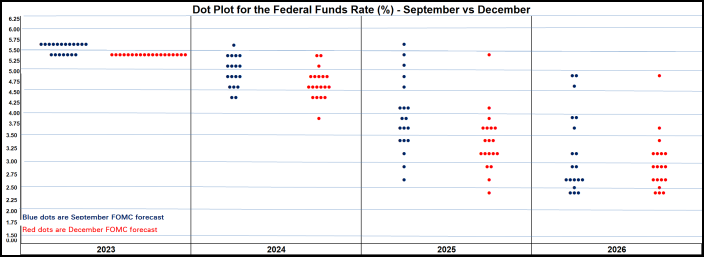
上图是本周最重要的图表,FOMC 成员“集体转向”,可以说 Fed 12 月会议释放了迄今为止最明确的降息信号, 75 bp 的降幅也超过市场预期,之后从股票到债券,非美货币到商品,一切都在上涨,但加密货币这次表现落后。
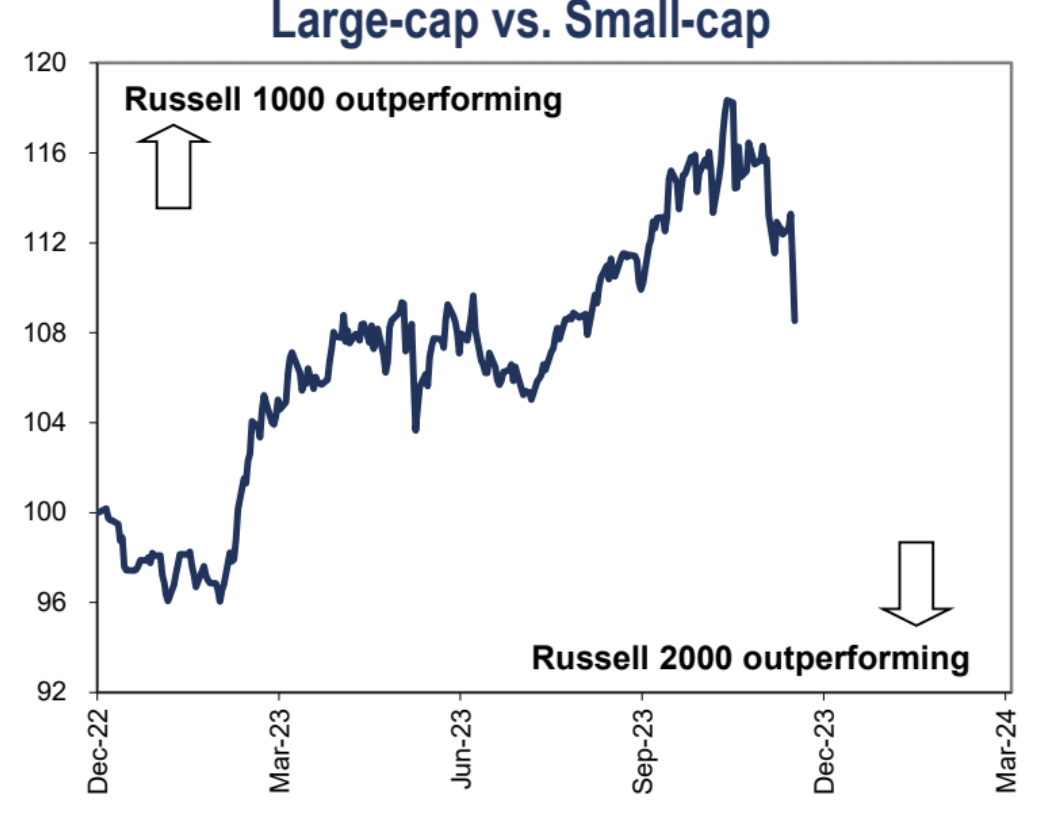
因为 12 月 1 日,鲍威尔还警告市场“现在猜何时开始宽松太早了”,而在 12 月 13 日的新闻发布上却称“开始讨论降息的问题”,所以这个鸽派转向是超出市场预期的,上周美股道指、纳斯达克 100 均创历史新高,标普 500 距离历史新高仅一步之遥。小盘代表罗素 2000 指数上周大涨 5.7% 距离历史高点仍相距 15% 以上。
市场风险偏好进一步、大幅加强:
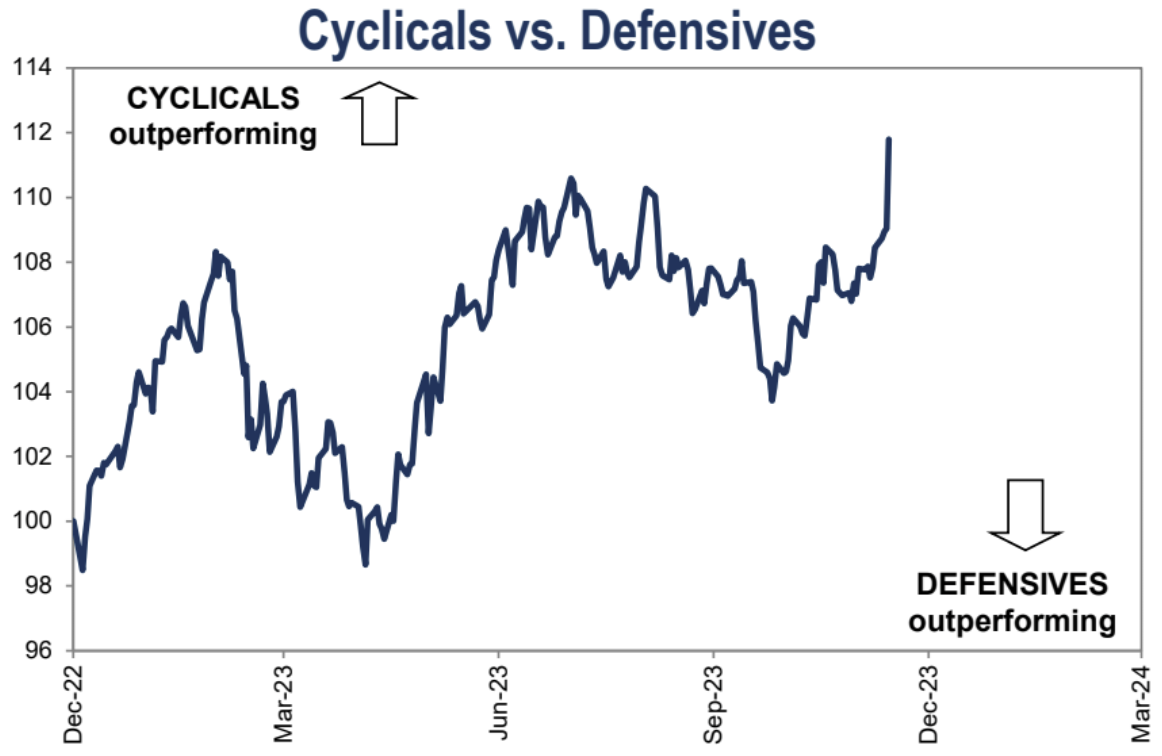
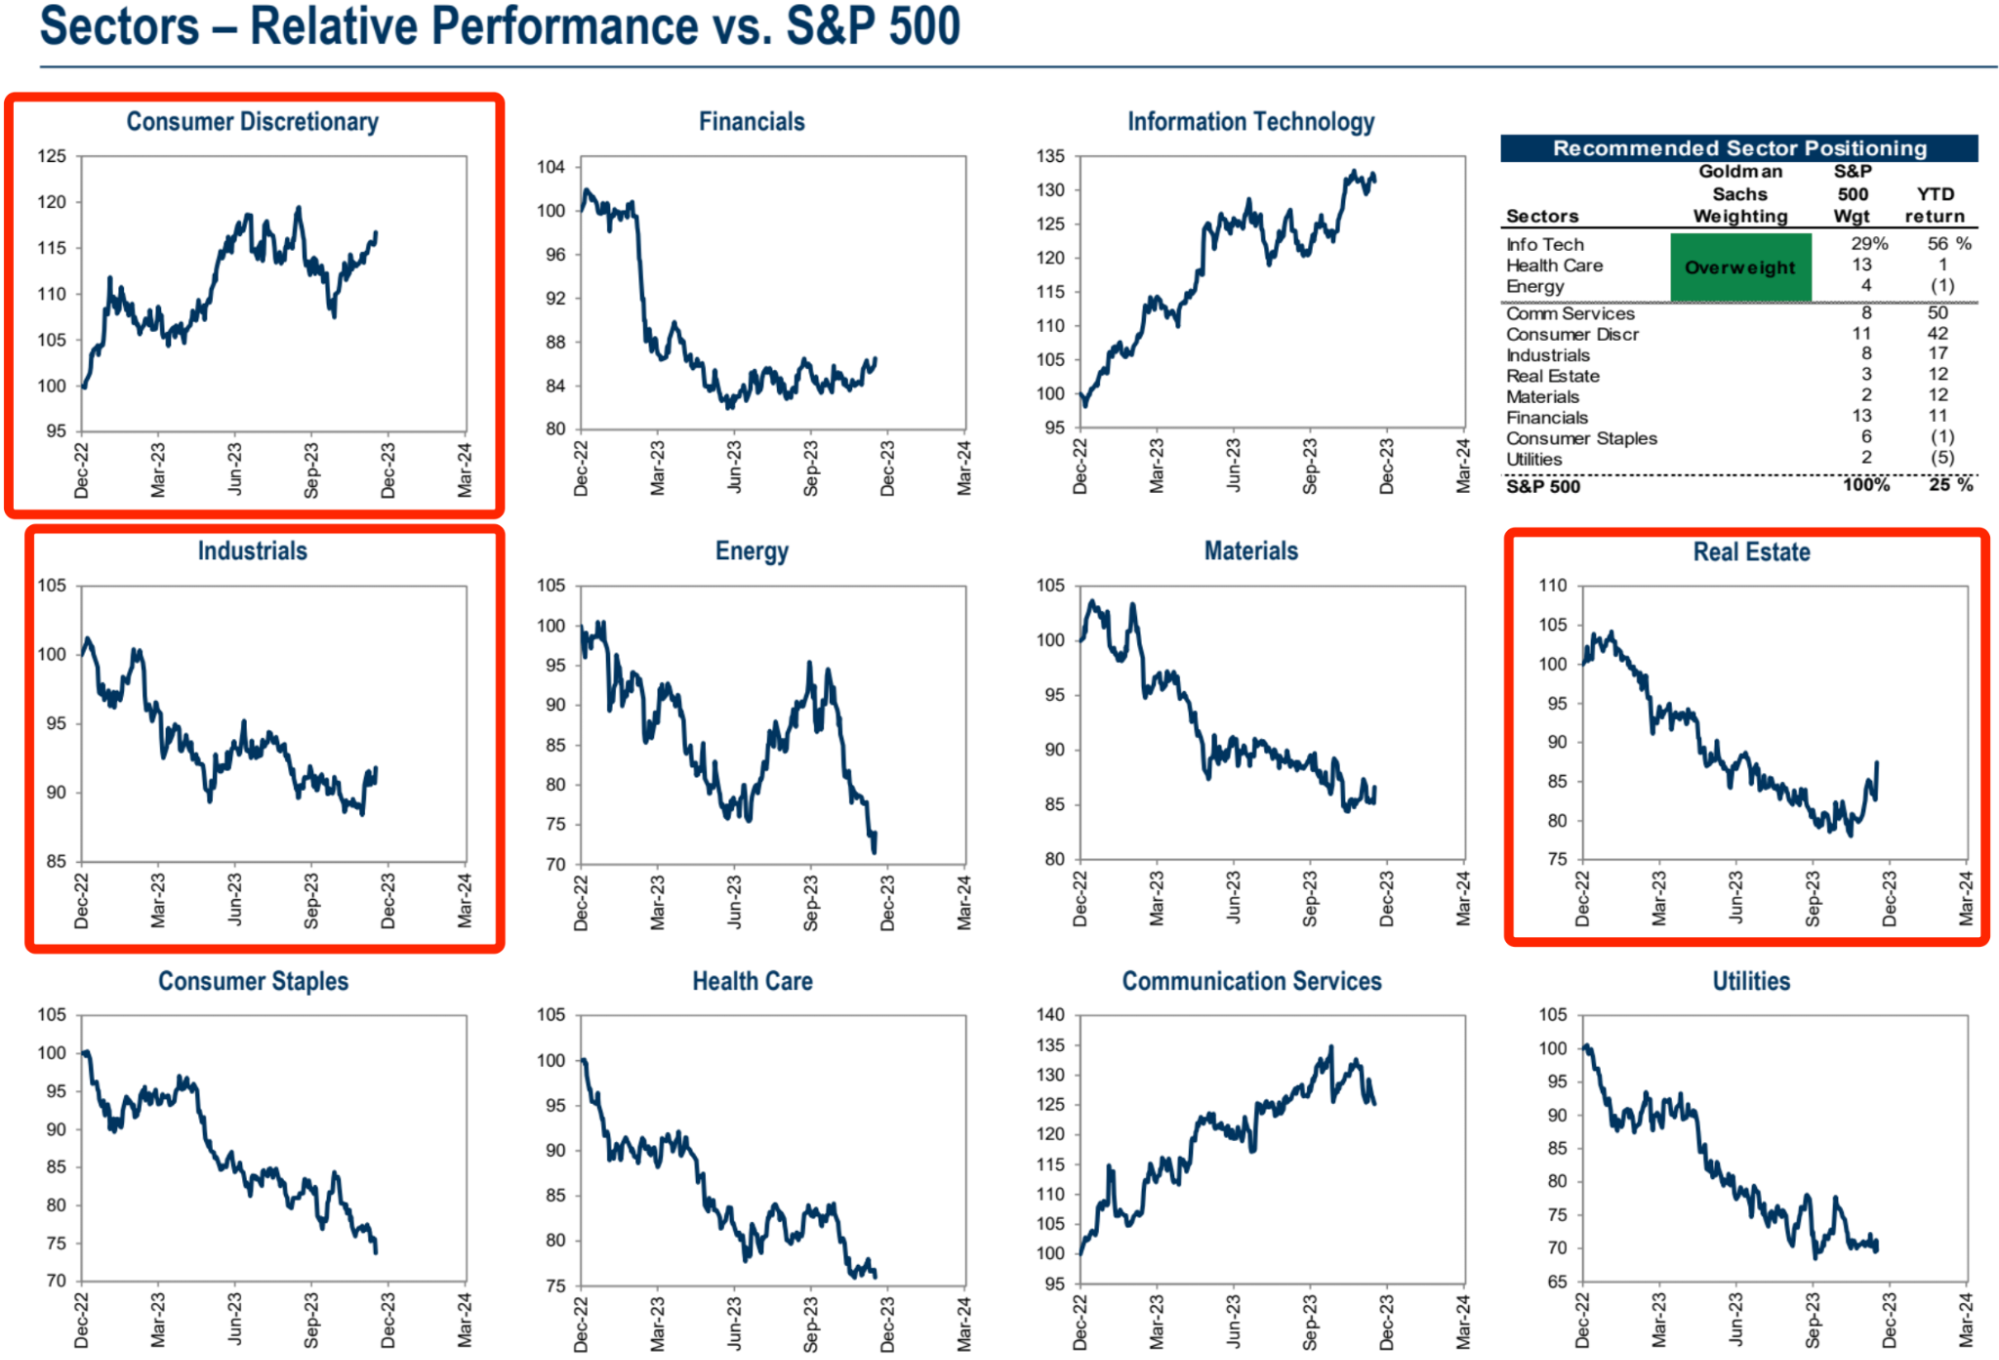
资金对房地产、可选消费品、工业股在进行快速估值修复,且似乎仍有空间:
美国中概股指数 HXC 上涨 3% ,尽管 A 连续第六周收跌;
美国 30 年期国债收益率从 10 月份的多年高点 5.18% 上周跌破 4% 大关, 10 年期跌破 3.9% 关口。威廉姆斯和 Bostic 周五压制了部分市场的热情,但市场调整极为有限,凸显本次 Pivot 叙事仍在进行时。
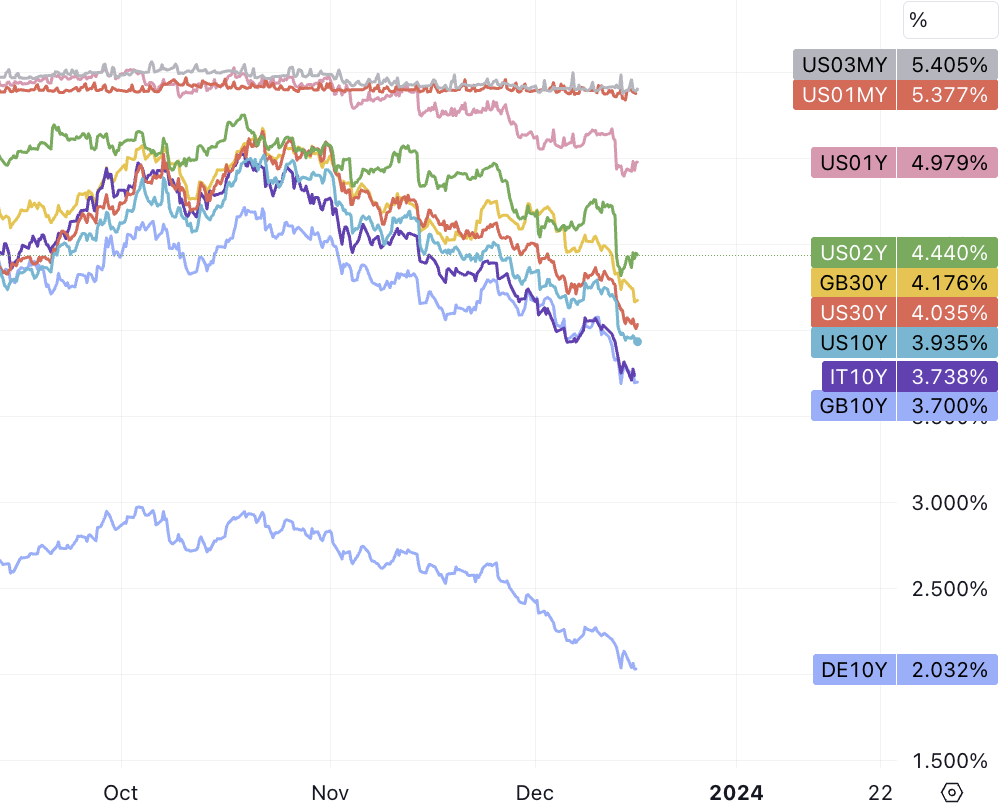
衍生品市场已经押注明年基准利率低至 3.9% 的水平,并在 3 月份就启动降息。这远低于美联储点阵图显示的 4.6% 的利率水平。考虑到美国的经济动能、金融市场表现、就业市场表现、商业贷款违约率(1.33% )、信贷违约率(90 D 1.3% )等等指标都处于健康甚至过热区间,除了通胀正在靠近目标,我们看不到联储在三个月以后就着急降息的原因。
而且第一次降息,并不能算是真正的放松货币政策 ,而是在物价压力大幅缓解的情况下做出预防性调整,整体依旧维持限制水平,明年经济增长表现如高于 Fed 1.5% 的目标,实际降息空间可能极为有限。
这样来进一步乐观定价的空间似乎已经到头了,对于债券多头来说可能是一个相当好的短期止盈点。对于股票市场,可能仍有一些上涨空间,主要考虑到有利的宏观背景,主要是美联储和美国经济增长之间刚刚达到了一个非常友好的位置;其次是是季节性和资金流动,仍然处于有利形势。
但整体美联储上周的语气仍比欧央行更加鸽派,例如:欧洲央行管委 Madis Muller 周五表示,市场正在领先他们押注欧洲央行将在明年上半年开始降息。周四,欧洲央行行长拉加德表示,该行根本没有讨论过降息。
各大机构在会后也纷纷调降美债收益率曲线预测,对 10 Y 美债 24 年底预测值巴克莱是从 4.5% 降至 4.35% ,高盛是从 4.3% 降至 4% ,摩根大通是从 4.3% 降至 3.65% 。我们还看到了高盛直接把 SPX 明年底目标价大幅上调 8% 至 5100
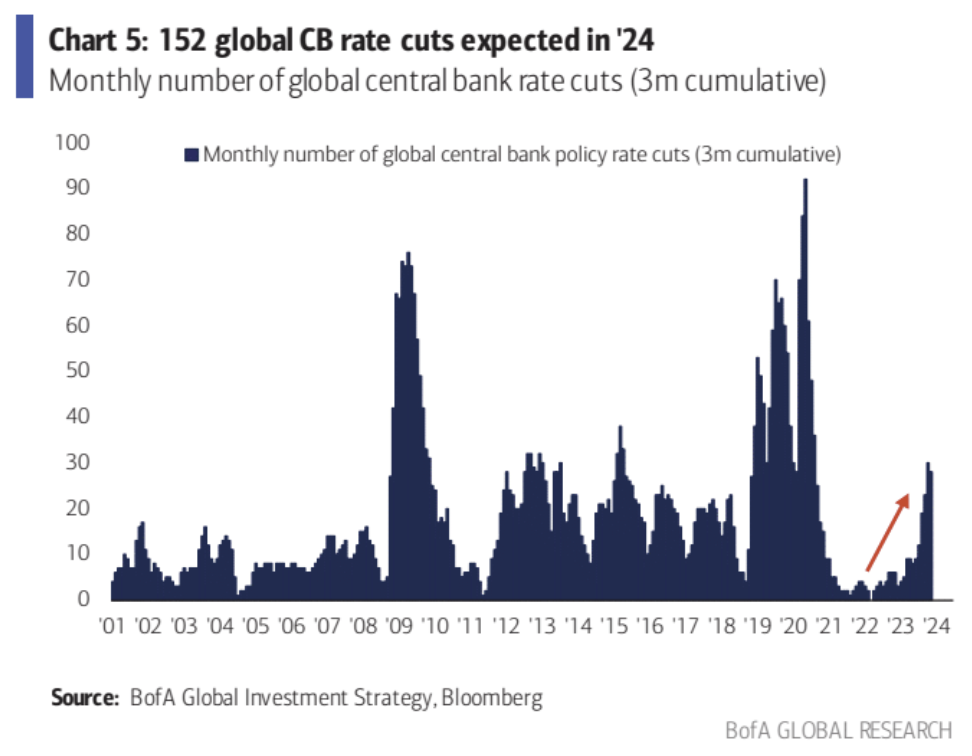
美银预测明年全球央行会有 152 次降息:
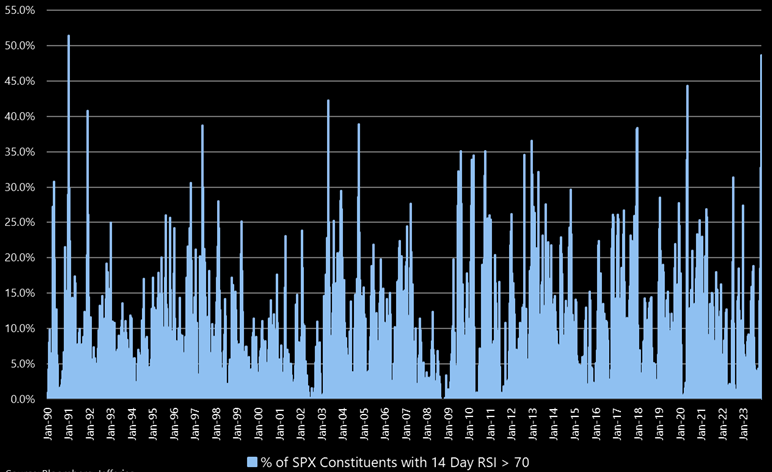
Jefferies:超买严重
根据 14 天 RSI 来看,标准普尔 500 指数中有 49% 的股票被认为是超买(>70)。SPX 里超过 50% 的股票过热是很罕见的。自 1990 年以来,这种情况只发生过一次。这种情况可能受到不少市场止损盘推动。通常也标志着市场的一个转折点,市场可能进入冷却期:
历史数据:
1 个月表现:当 SPX 超过 30% 的股票过热后,平均一个月的表现下降了 1.14% (负 114 个基点),并且 53% 的时间是负面的。
3 个月表现:三个月的平均表现通常是平稳的,没有显著的涨跌。
12 个月表现:向前看 12 个月,平均表现是正面的 12% 增长,在 95% 的情况下是正面的。
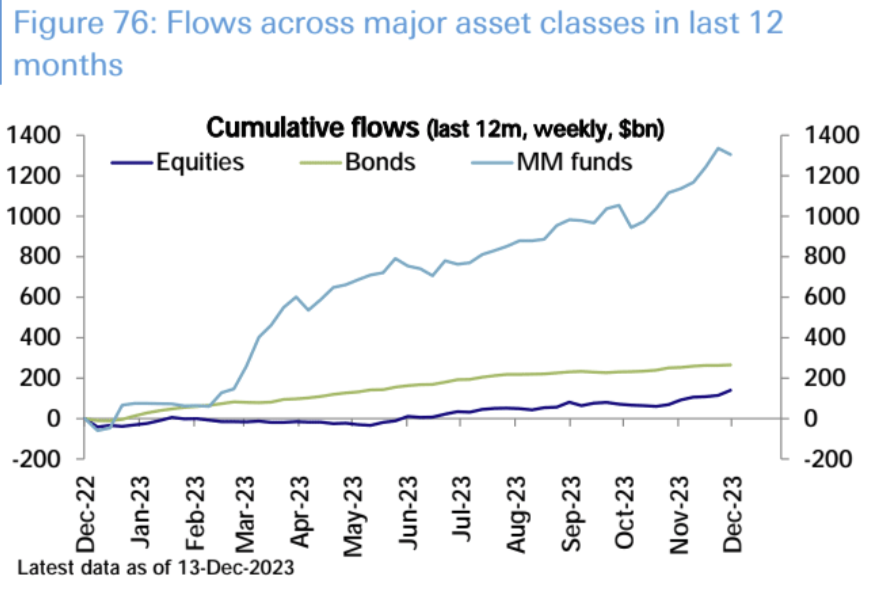
货币市场基金资产自十月以来首次回落
截至 12 月 13 日当周,约 116 亿美元从美国货币市场基金流出。 总资产从前一周的 5.898 万亿美元降至 5.886 万亿美元,这是自 8 周来首次净流出。
今年投资者已向货币市场基金注入 1.4 万亿美元,而美国股票基金仅接收了 950 亿美元的资金流入,差距悬殊
货币市场基金资产在还没到季度纳税日之前就从历史高位下跌,可能预示着资金流将发生转向,因为明年降息的前景促使投资者寻求其他资产的更高回报。
不过根据美银美林的分析,货币基金资金的大规模持续流入风险资产市场可能还要等到明年四季度,并且历史上大多由经济衰退结束而触发:
在过去四个周期中,货币市场基金的资金流入平均在最后一次 Fed 加息后继续了 14 个月。考虑到最后一次加息是在 2023 年 7 月,这意味着资金流入可能会持续到 2024 年 9 月。
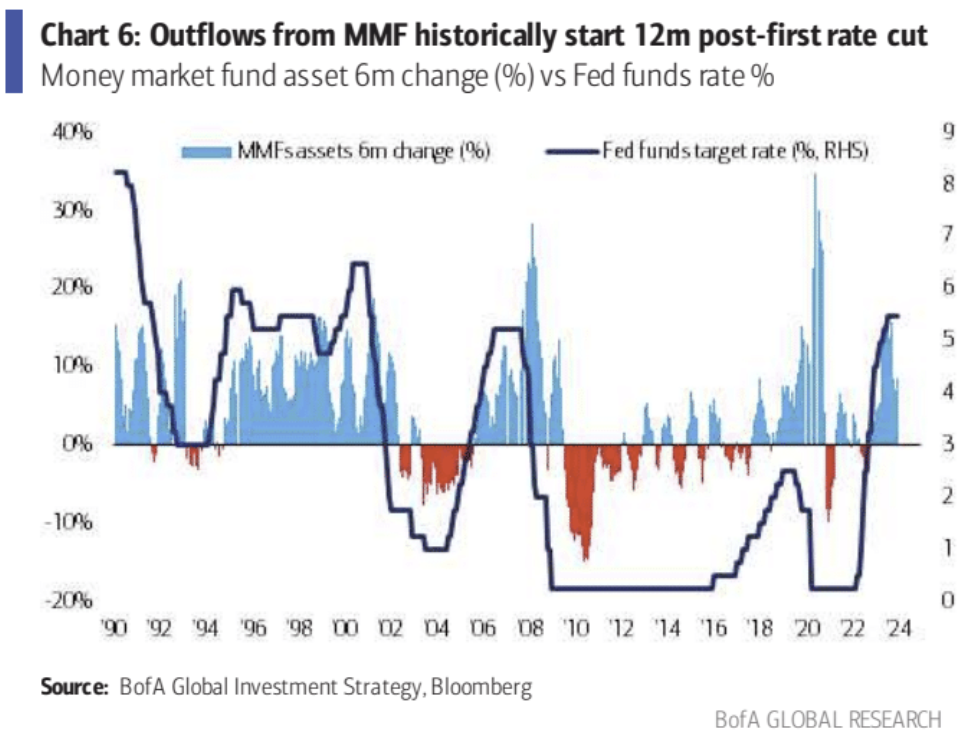
自 1990 年以来,货币市场基金的资金流出平均在第一次降息后的 12 个月开始,如果这一趋势持续,那么资金流出将从 2025 年第一季度开始。
自 1990 年以来,所有货币市场基金的撤资事件都是由经济衰退结束触发的,唯一例外是 2019 年的软着陆期间,没有发生资金流出。
在过去五个周期中,货币市场基金的资金流出量相当于先前流入的 20% ,这意味着大约有 2500 亿美元的现金将被部署到风险资产中,预计从 2024 年第四季度或 2025 年第一季度开始。
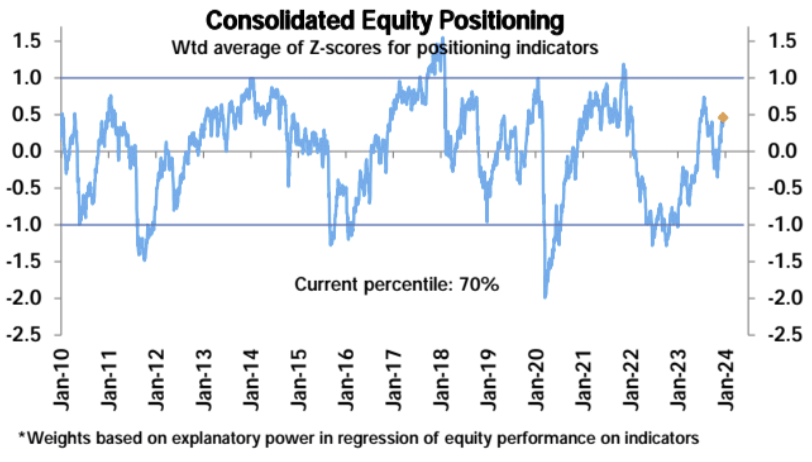
资金流与仓位
德意志银行的总股票头寸衡量指标本周再次上升,进一步进入超配区域(z-score 0.46 ,第 70 个百分位),高,但尚不极端
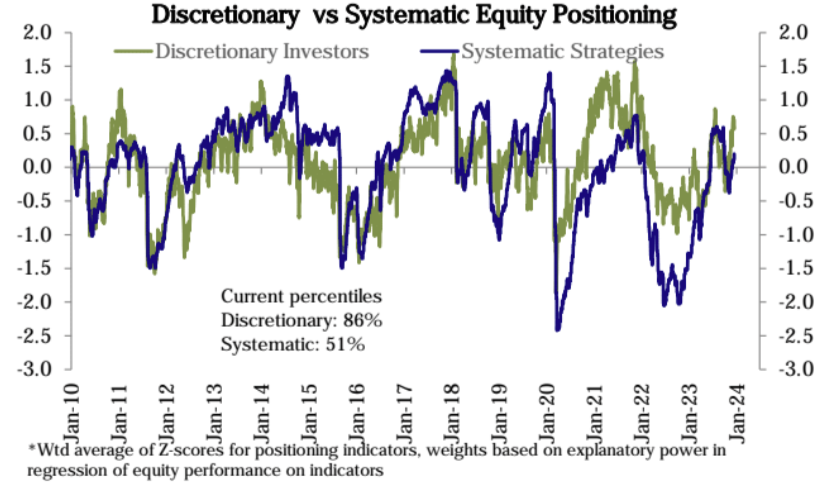
其中自主策略投资者仓位水平 86 百分位,系统性策略仅有 51 百分位
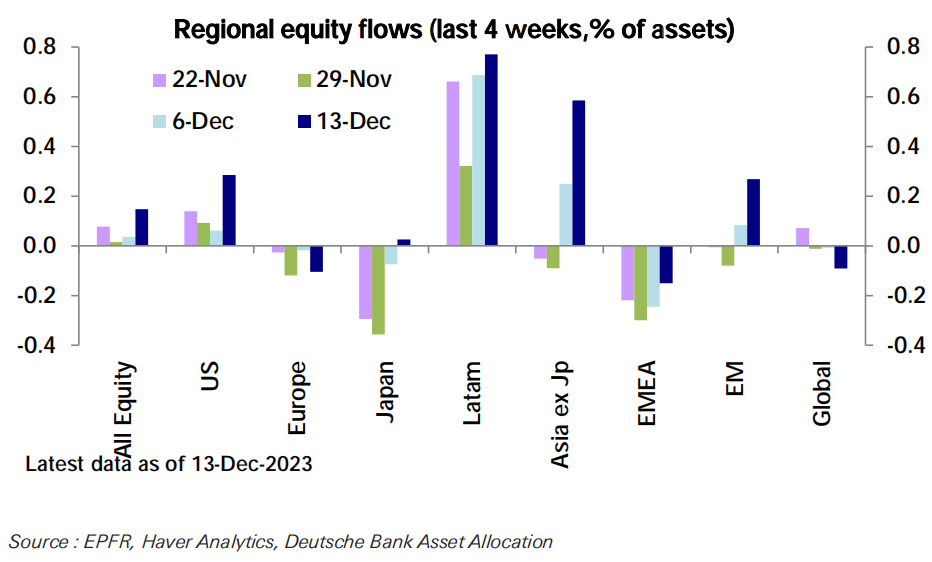
流入股票基金的资金(253 亿美元)也飙升至近 21 个月以来的最高点,其中以美国(259 亿美元)为首,增长比例最大则是新兴市国家股市:
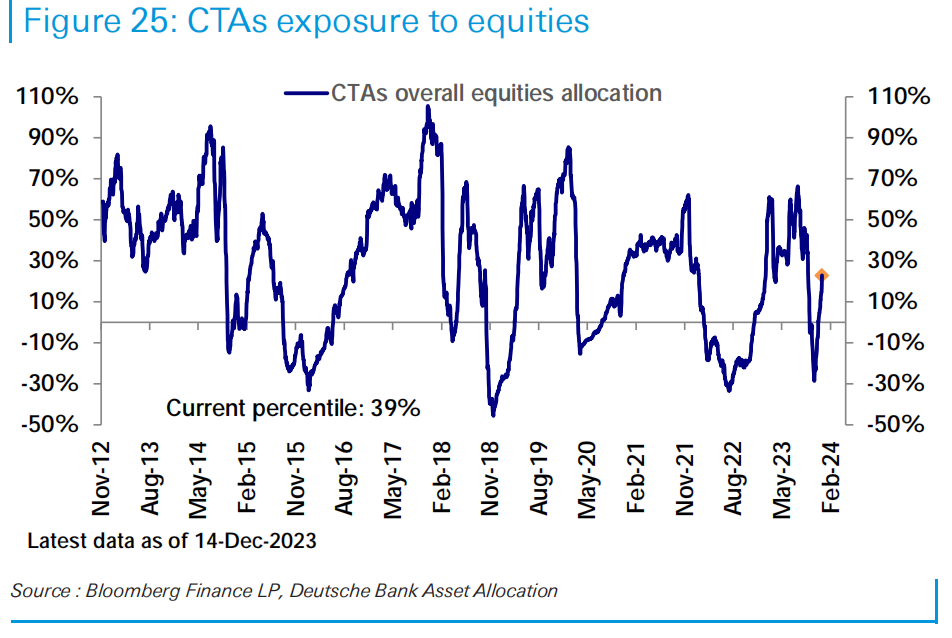
CTA 资金对股票的配置终于回到了正常区间,目前报 39 百分位:
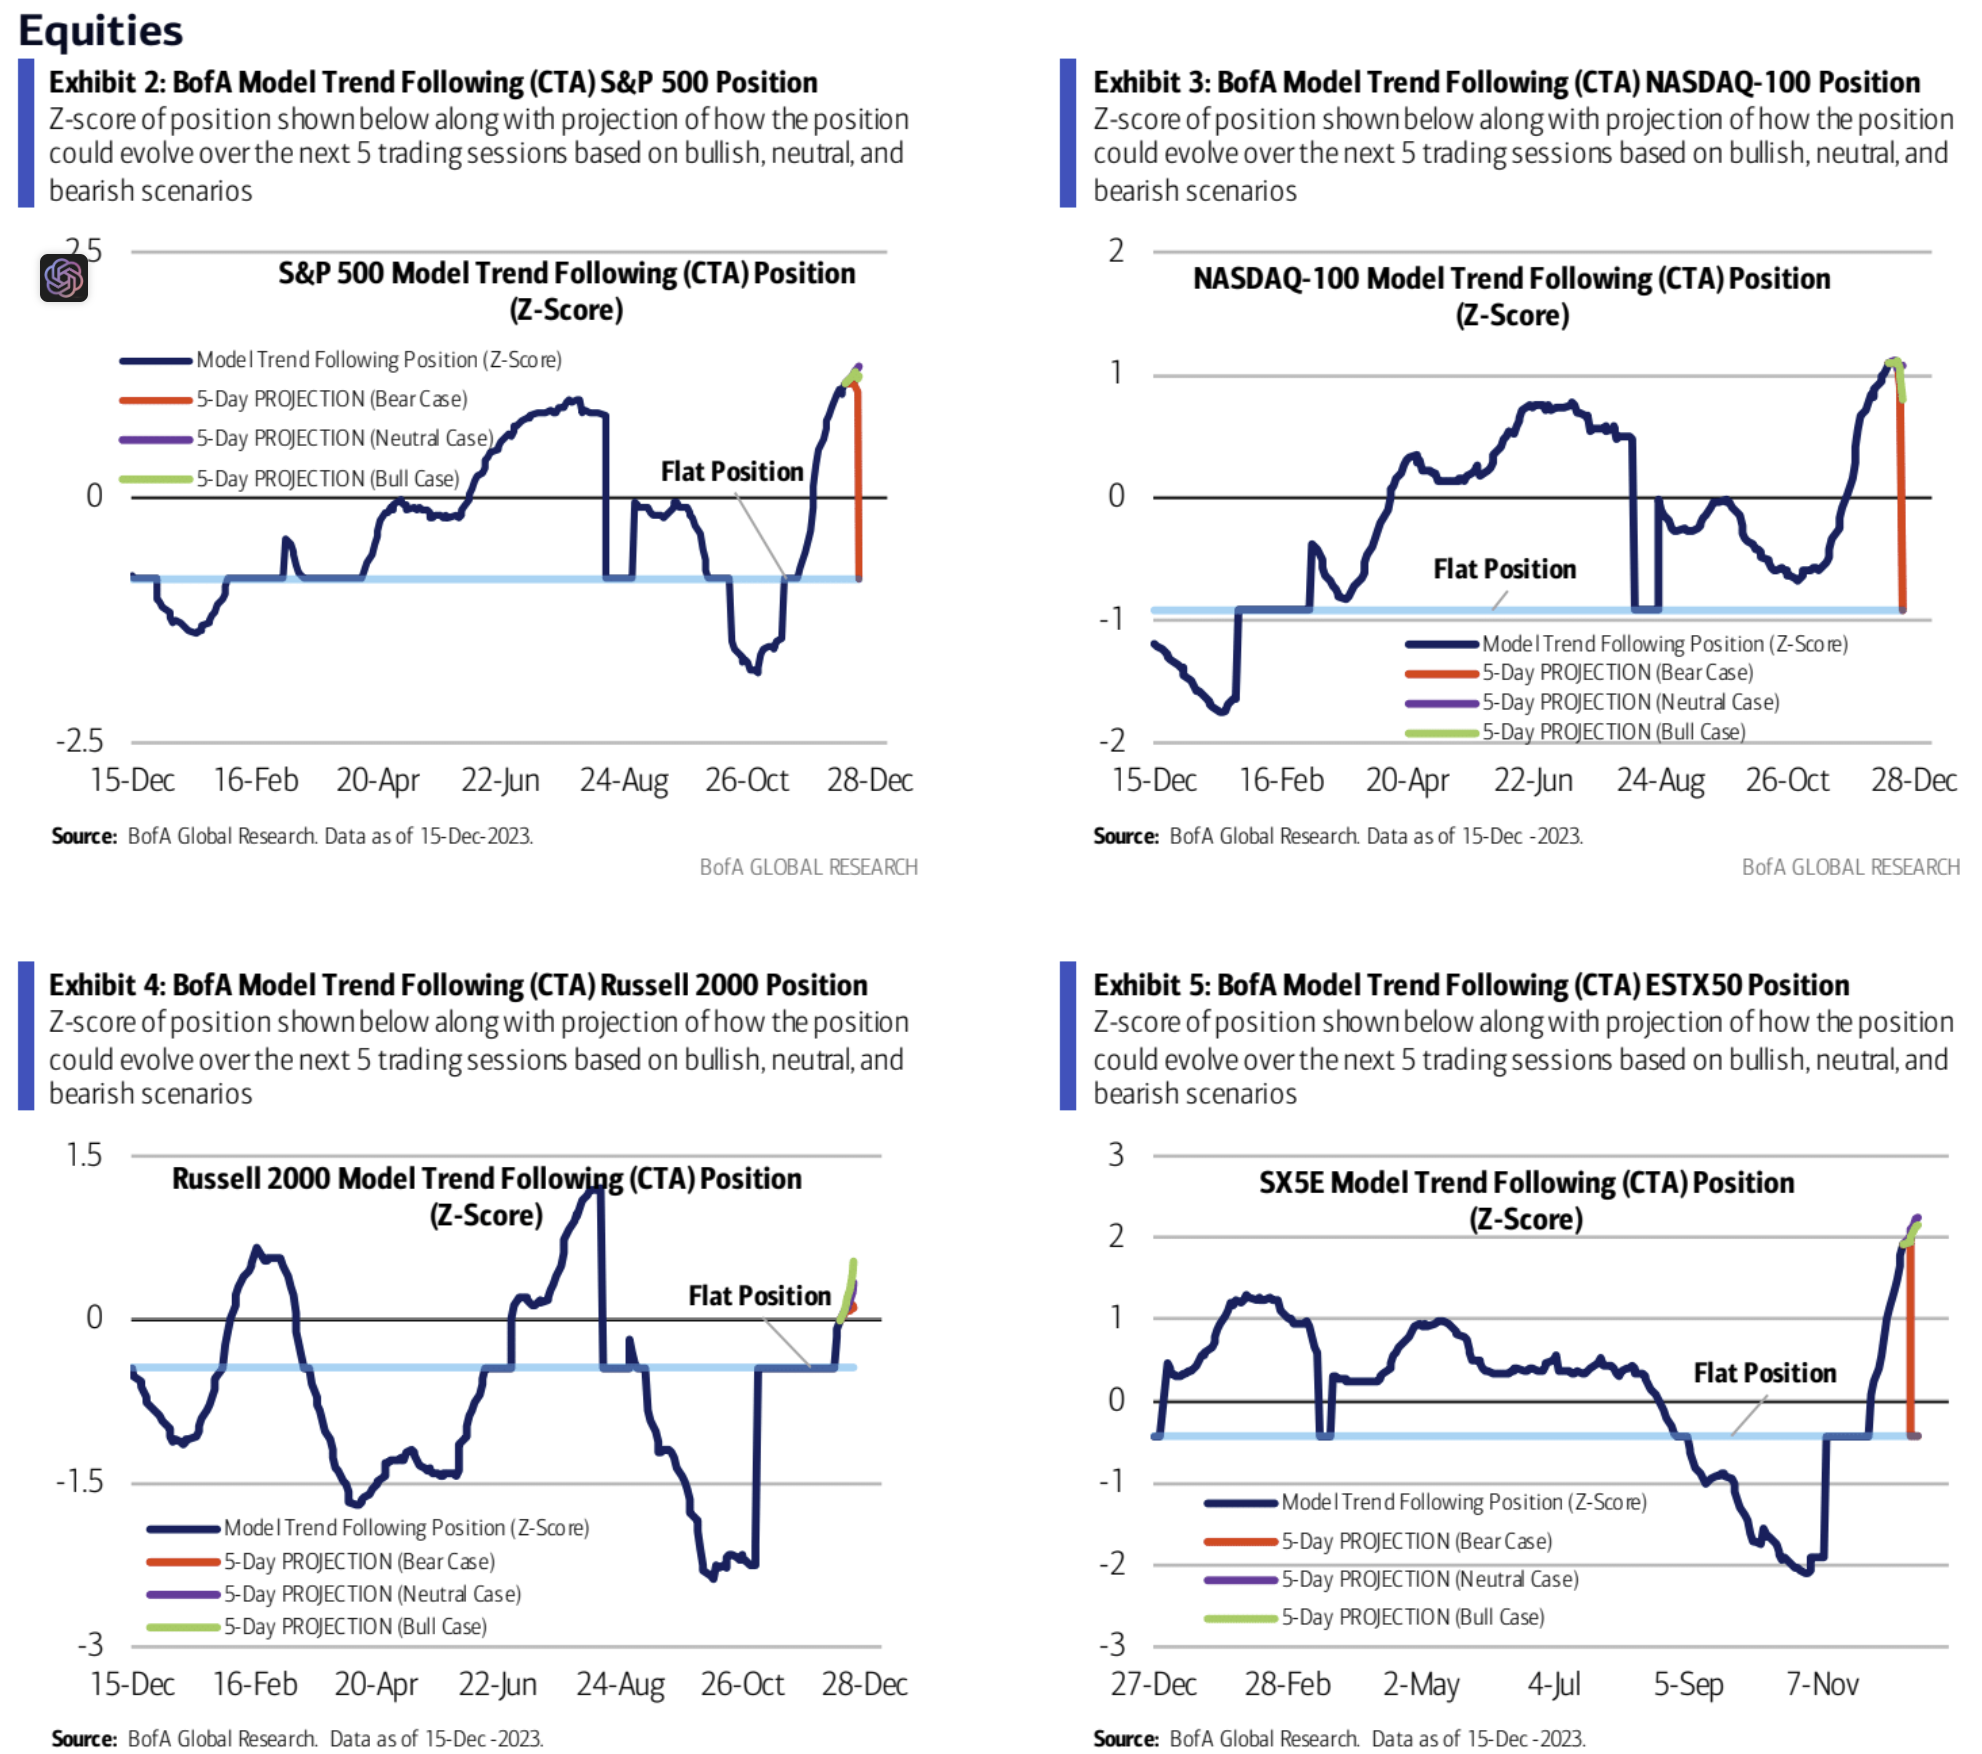
美银的量化追踪认为目前 CTA 资金对纳指和标普的多头头寸已经过度,进一步买盘受到限制,不过小盘股的动能仍在接下来一周有望受到支持:
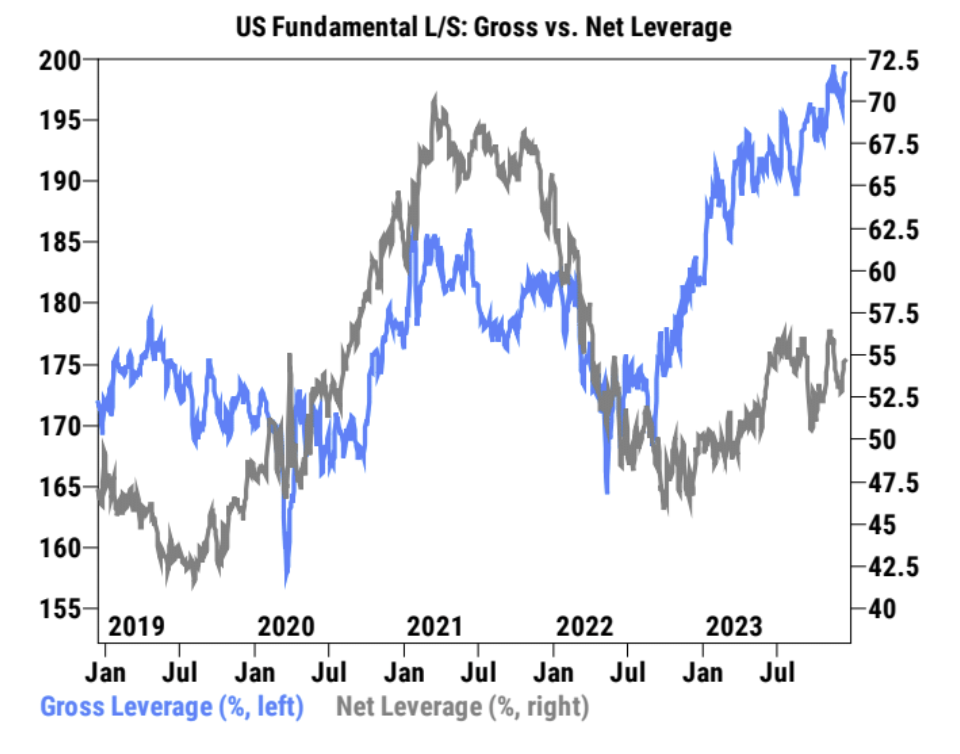
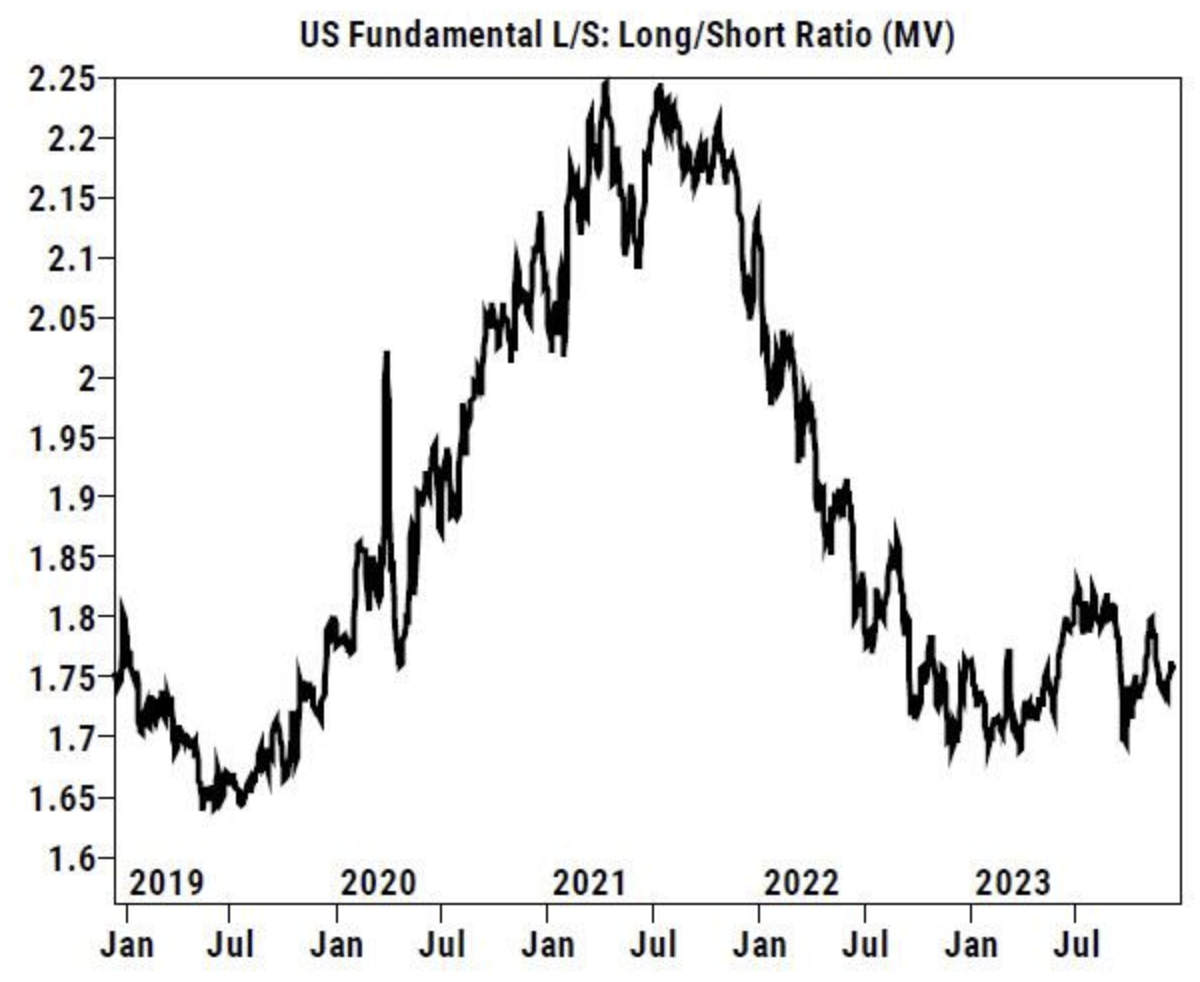
高盛客户交易数据,上周总杠杆率上升 2.4 个百分点,至 199.1% (三年历史里第 100 百分位),净杠杆率上升 0.9 个百分点,至 54.6% ( 48 百分位)多头/空头总体比率上涨 0.2% ,至 1.755 (25 百分位):
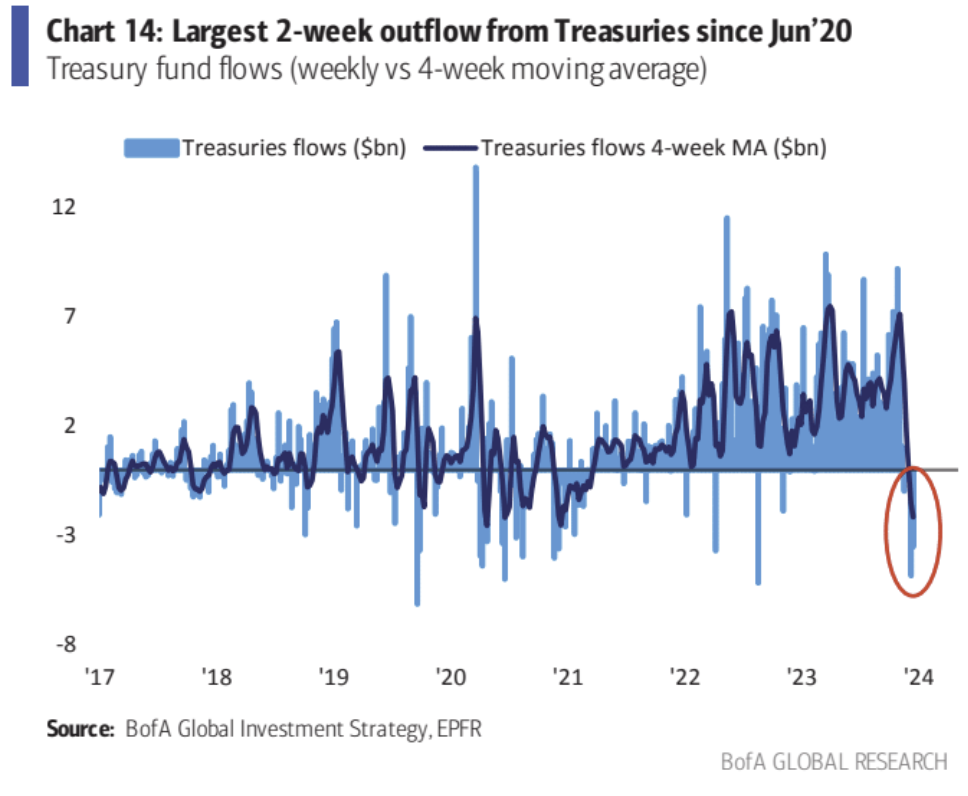
美国国债基金出现了 2020 年 6 月来最大的两周流出,尽管最近美债涨势凌厉,可以看到先入场的资金可能正在兑现:
情绪
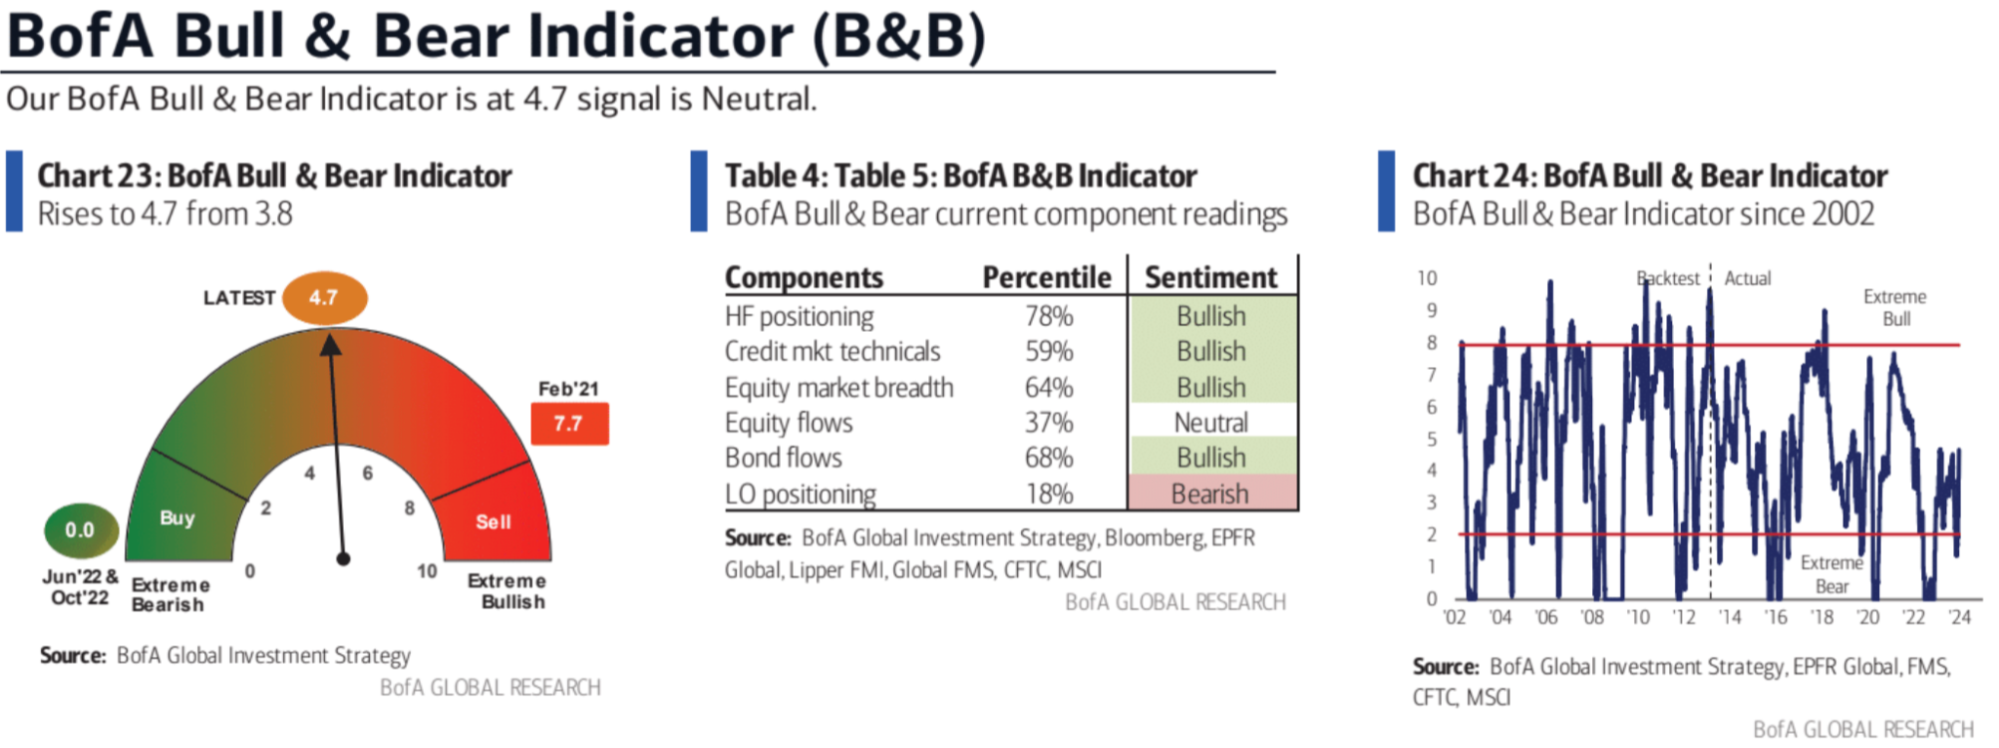
美国银行牛熊指标达到自 14 个月前牛市开始以来的最高水平,尽管远未达到极端抛售区域:
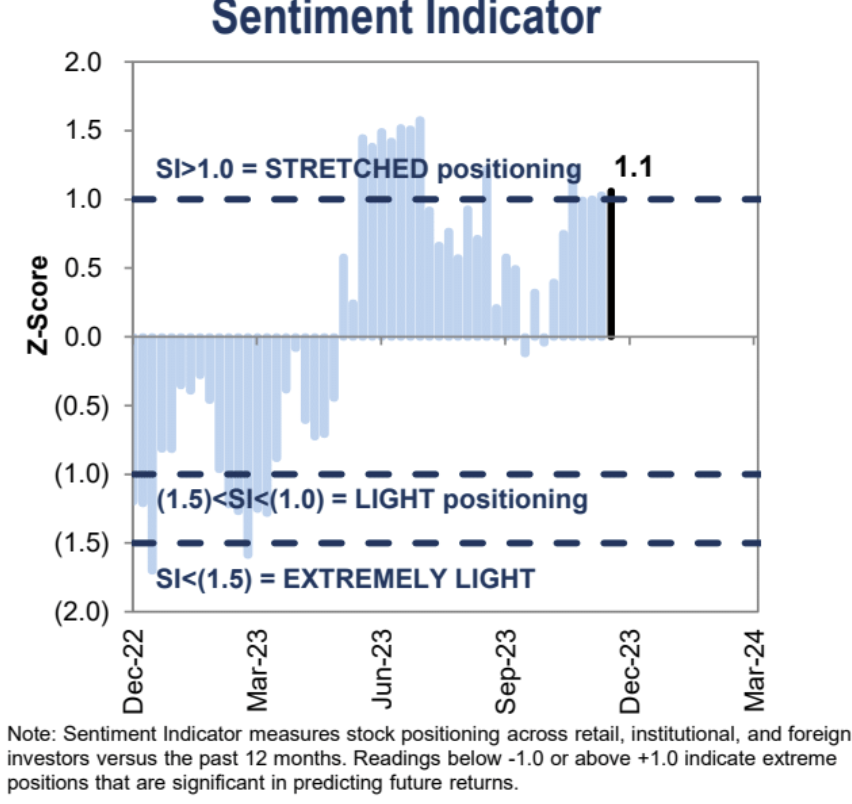
高盛的情绪指标连续第五周位于“过度”水平:
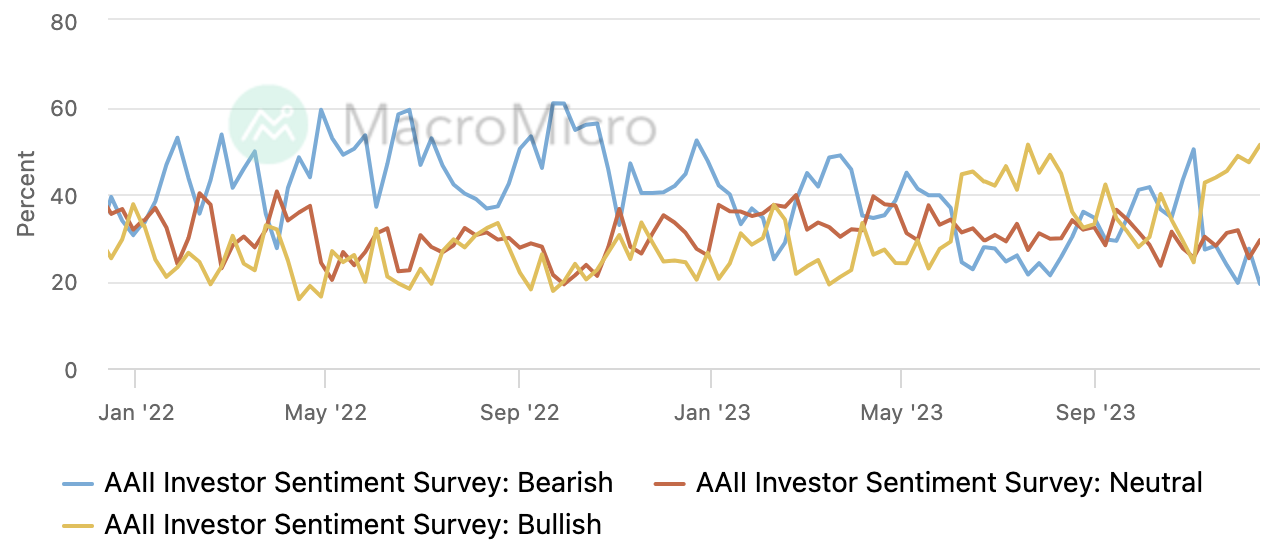
AAII 投资者调查看多比例升至 7 月 20 以来最高,
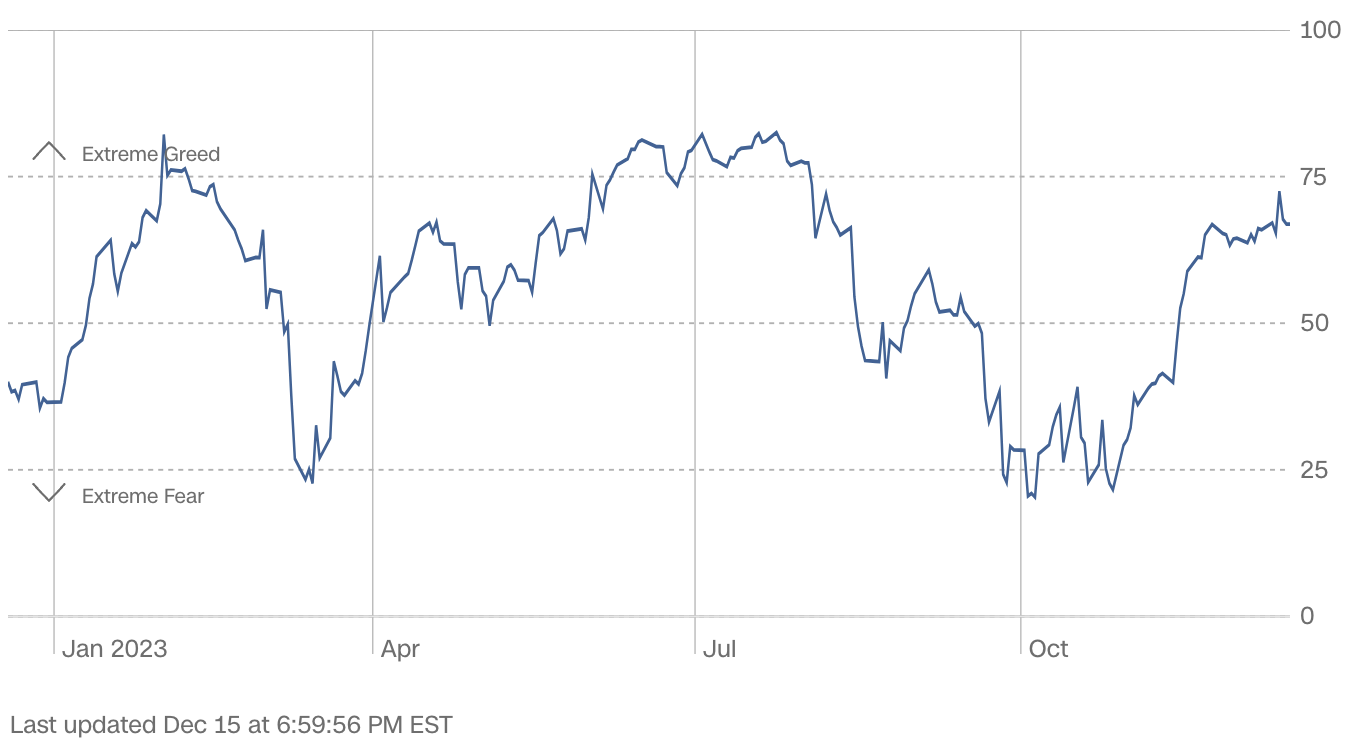
CNN 恐惧贪婪指数小幅走高,位于>70 贪婪区间,但未触及极度贪婪