
Foresight Ventures市场周报:美元走弱,BTC走强
市场观点:
1、宏观流动性
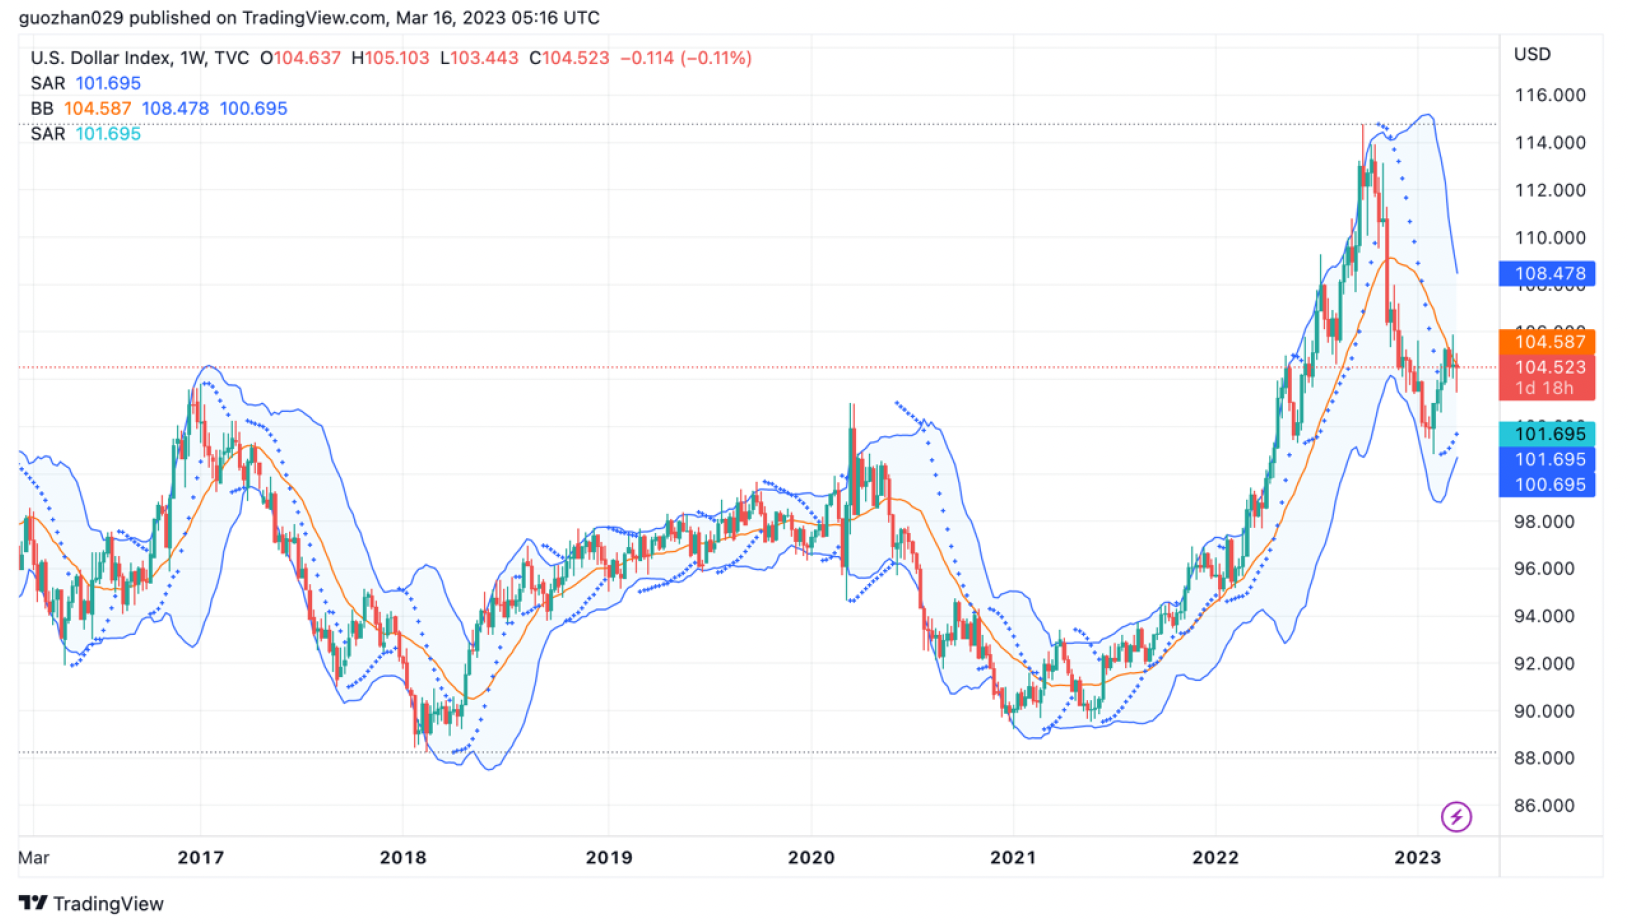
货币流动性正在改善。美国 2 月 CPI 数据为 6% 符合预期, 2 月工业端PPI 意外下降,预示 3 月零售端 CPI 较好,通胀压力大幅减轻。硅谷银行等多家银行破产,美联储发现自己需要将金融稳定置于通胀之上。市场押注美联储 3 月加息 25 个基点概率 75% ,不加息概率 25% ,下半年可能会提前降息。这证实了过去的市场底部,新的流动性开始溢出到加密市场只是时间问题。
2、全市场行情
市值排名前 100 涨幅榜:
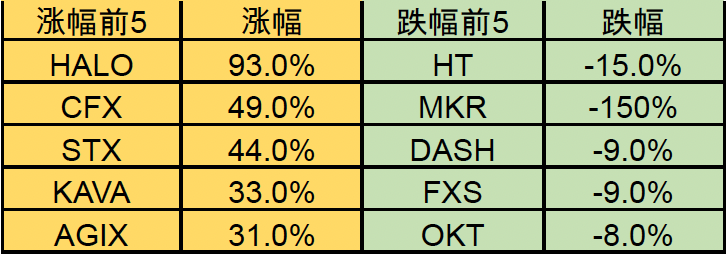
本周市场波动上涨,BTC 统治率上升,行情走势健康。币安交易所逐渐退出稳定币 BUSD,会将 10 亿美元的 BUSD 基金买入 BTC、ETH 和 BNB。市场热点主线集中在 BTC 及其生态,香港概念,人工智能。
CFX:为国内唯一官方认可的公链。美国监管趋严,加密友好银行纷纷倒闭。中国(香港)监管趋松,东方力量的市占率预计会提升。
AGIX:人工智能龙头 OpenAI 公布 GPT 4.0 ,接受图像输入。人工智能概念未来会长期反复炒作。
LQTY:为山寨版的 Makerdao,但是只支持 ETH 做稳定币 LUSD 的铸币抵押物,在这次稳定币 USDC 脱锚事件中是少数几个未受影响的去中心化稳定币。
3、BTC 行情
3.1 链上数据
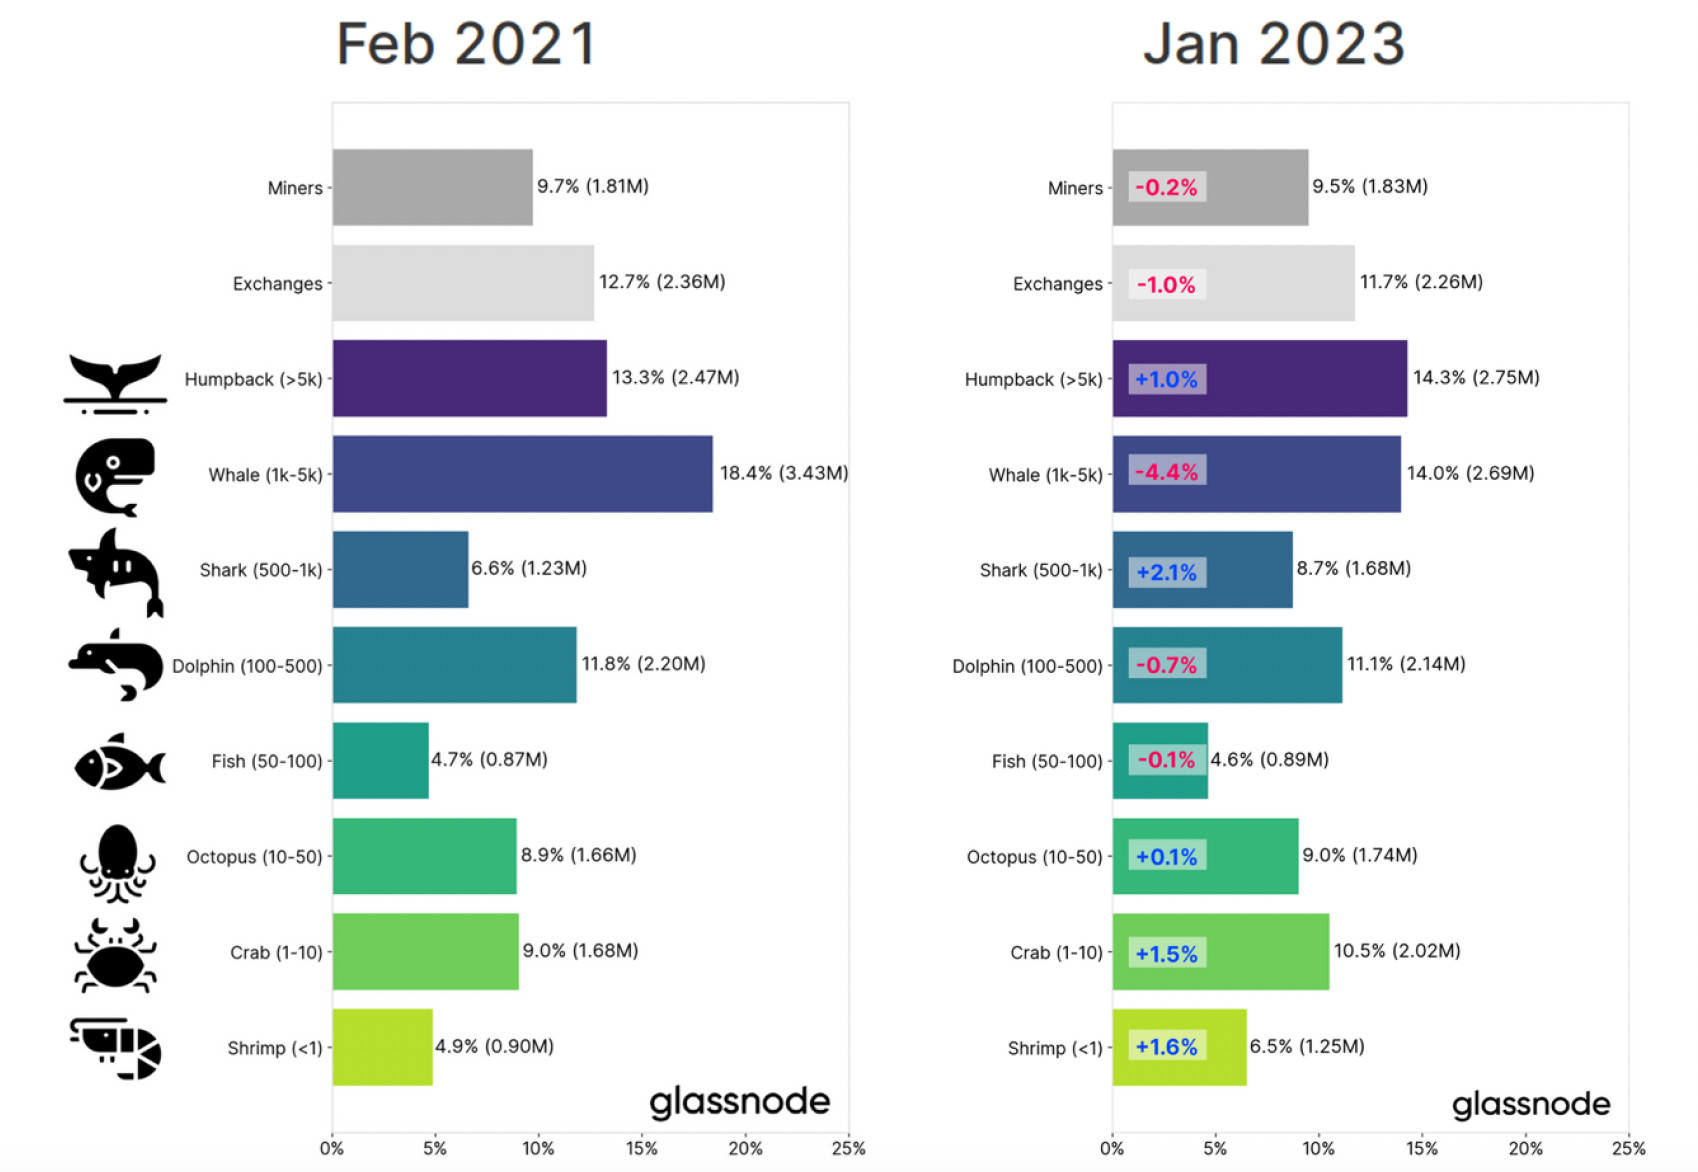
越来越多的 BTC 由较小的散户持有。小于 10 个 BTC 的持有量比 22 年多 2.3 倍。而巨鲸、矿工和交易所的持有量则经历了最大规模的收缩。大于 1000 个 BTC 的巨鲸群体目前持有 664 万 BTC,相当于流通量的 34% 。
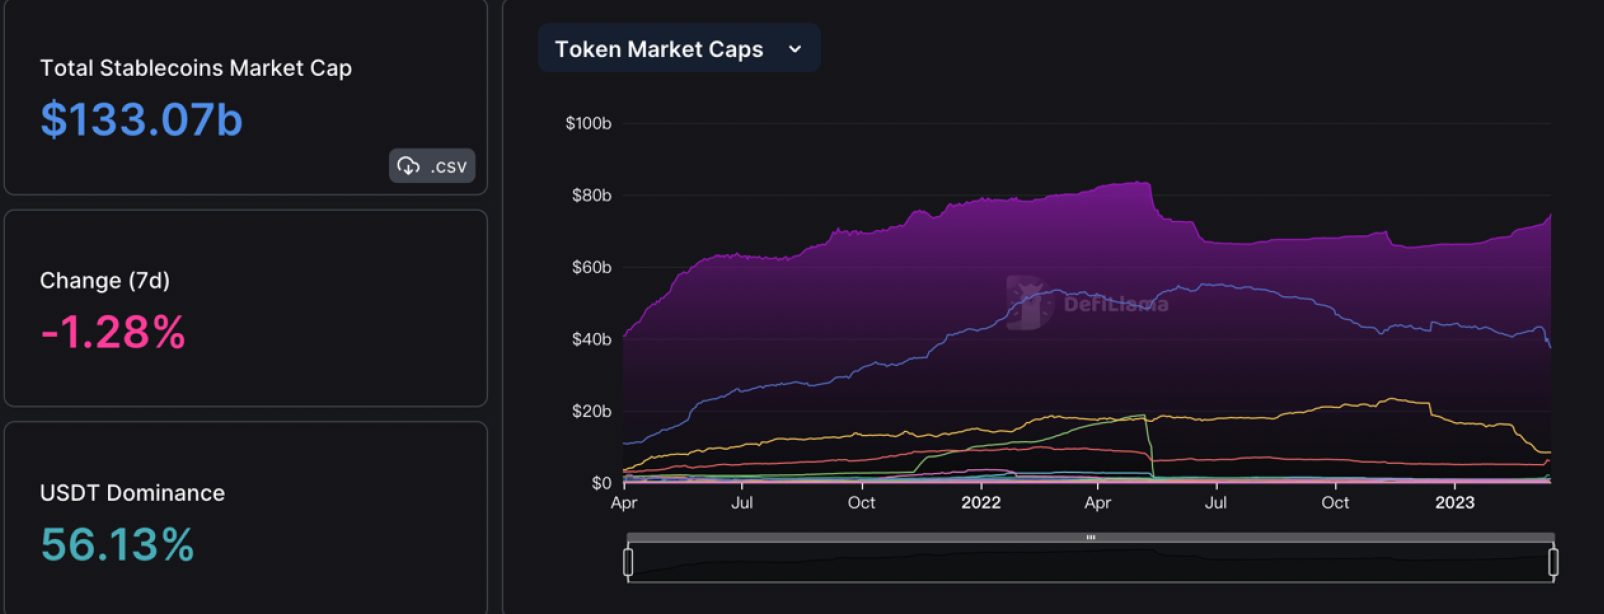
资金面暂时还不能乐观。由于美国硅谷银行破产,导致 USDC 和 DAI等主流稳定币脱锚,BUSD 由于美国监管也逐渐退出,未受波及的 TUSD 和 USDT 的市占率快速提升。其中 TUSD 对欧洲用户更加友好,过去一个月市值增长 115% ,成为 BUSD 的主要替代品。
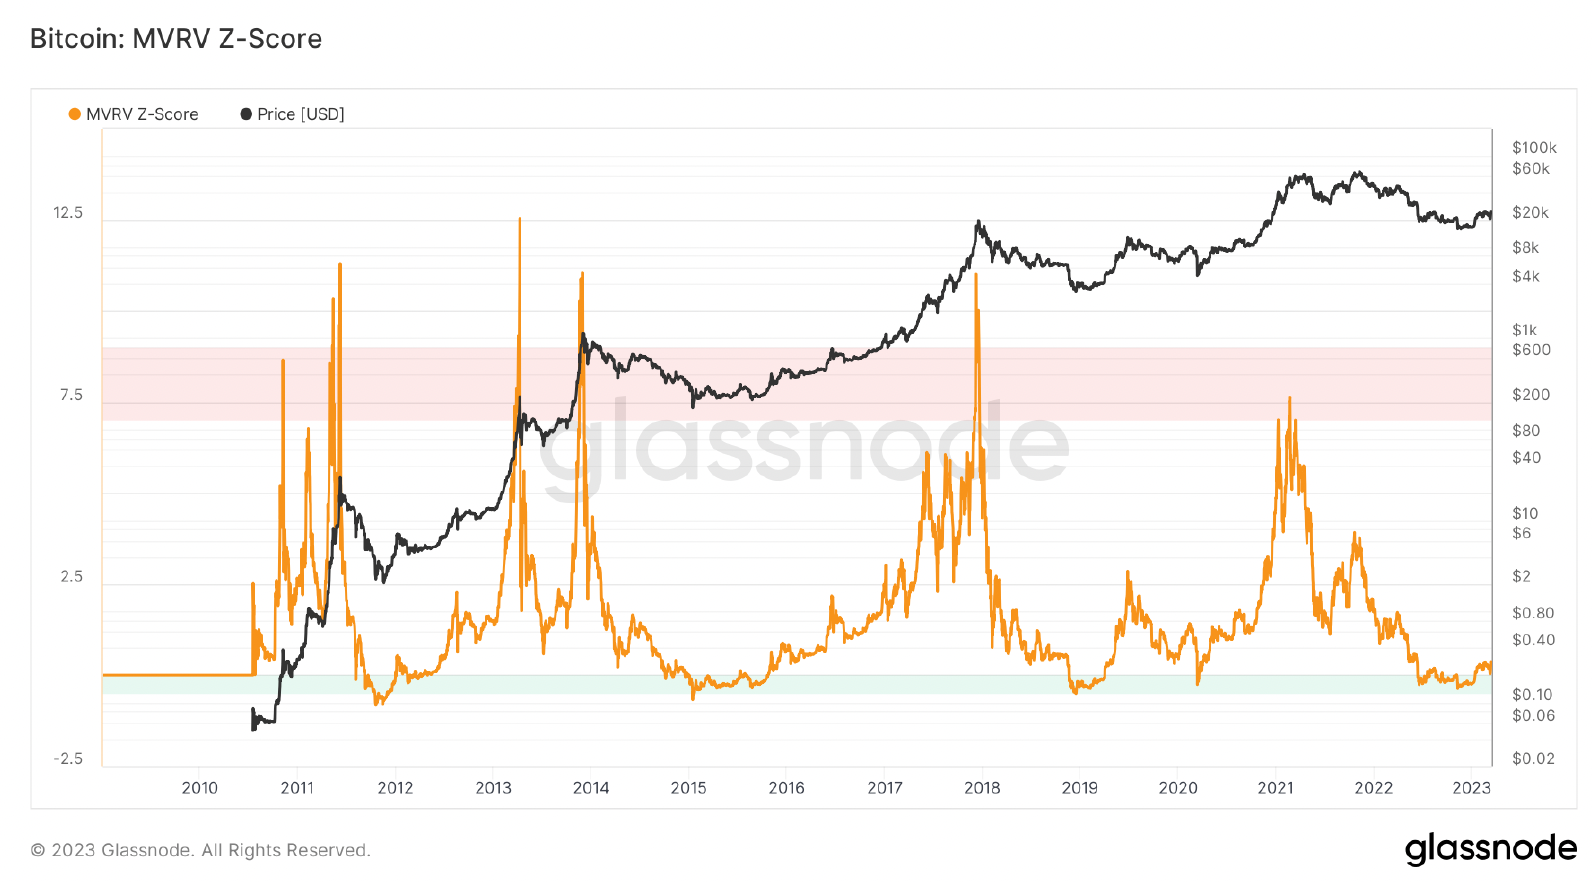
长期趋势指标 MVRV-ZScore 以市场总成本作为依据,反映市场总体盈利状态。当指标大于 6 时,是顶部区间;当指标小于 2 时,是底部区间。MVRV 跌破关键水平 1 ,持有者总体上处于亏损状态。当前指标为 0.34 ,脱离了绿色抄底区间。
3.2 期货行情
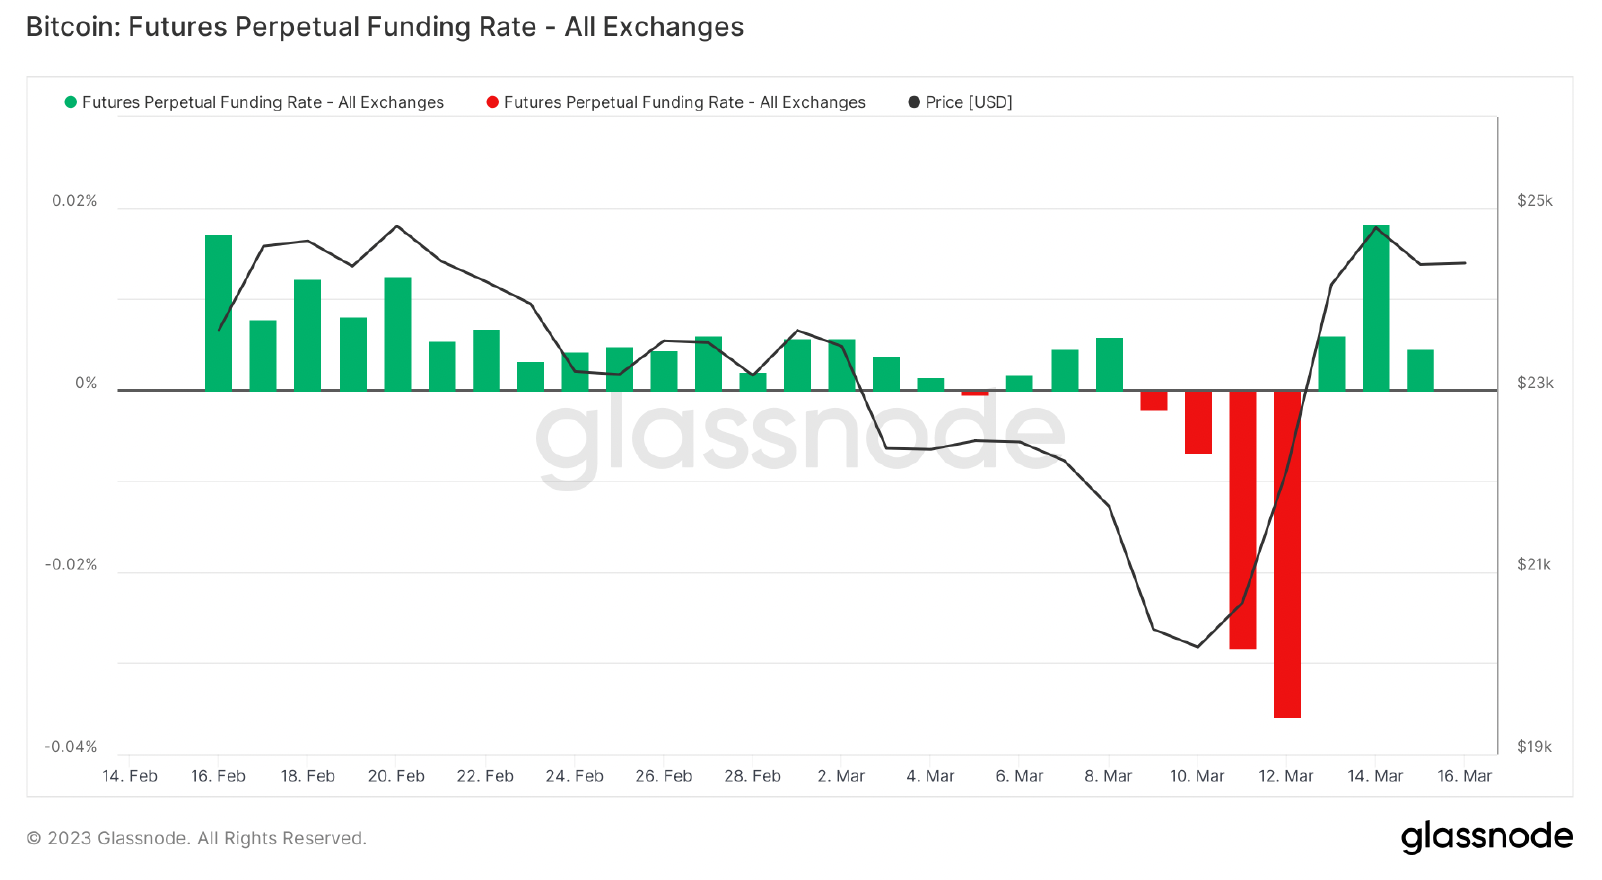
期货资金费率:本周费率由负转正,处于正常水平。费率 0.05-0.1% ,多头杠杆较多,是市场短期顶部;费率-0.1-0% ,空头杠杆较多,是市场短期底部。
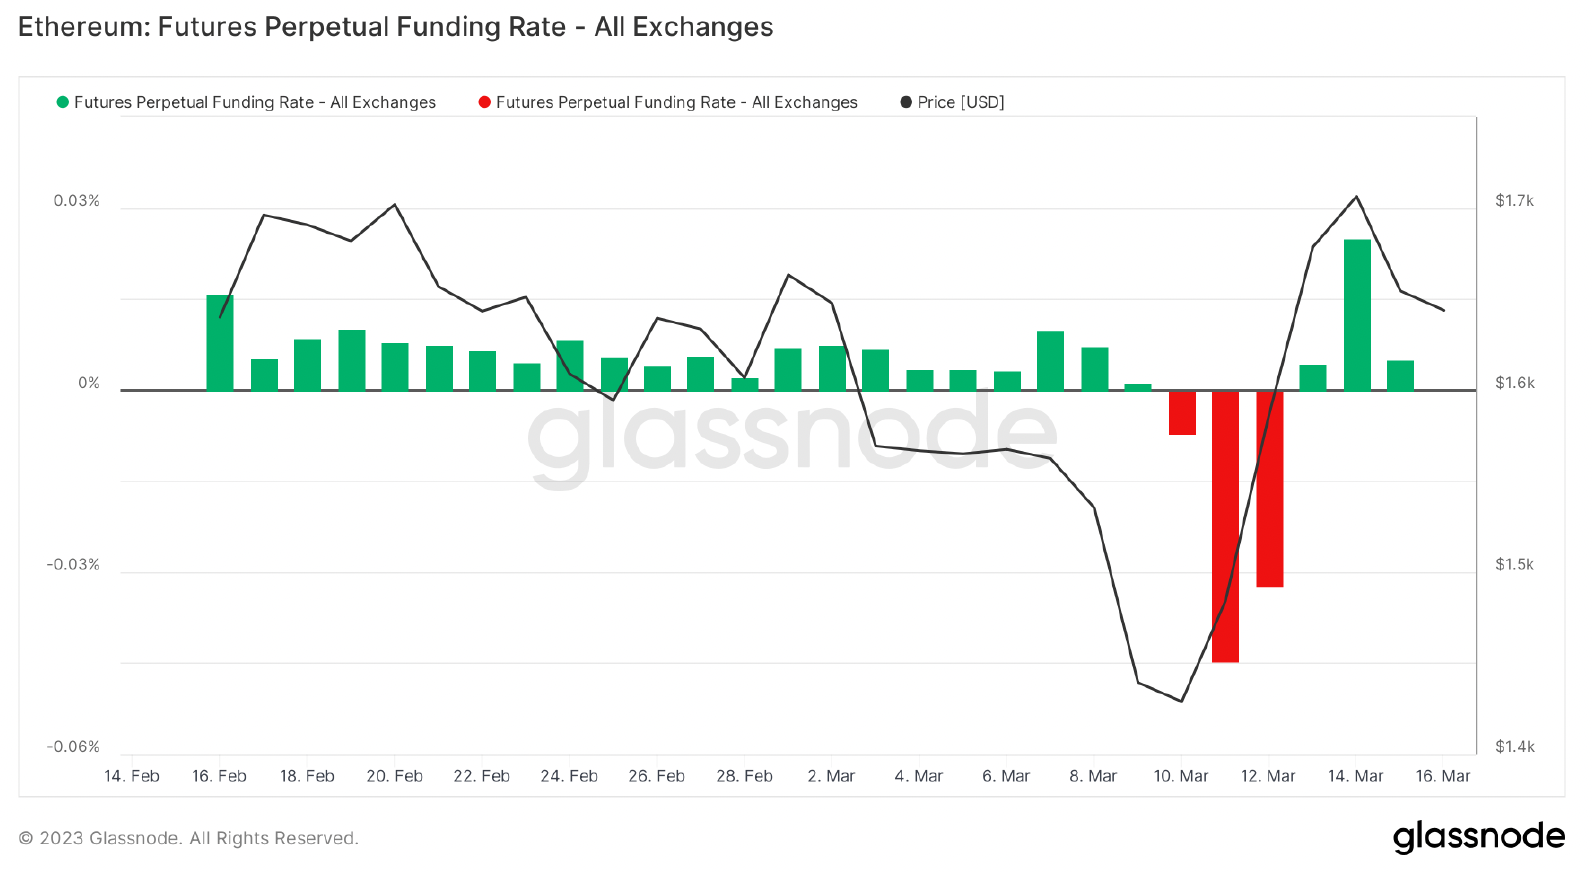
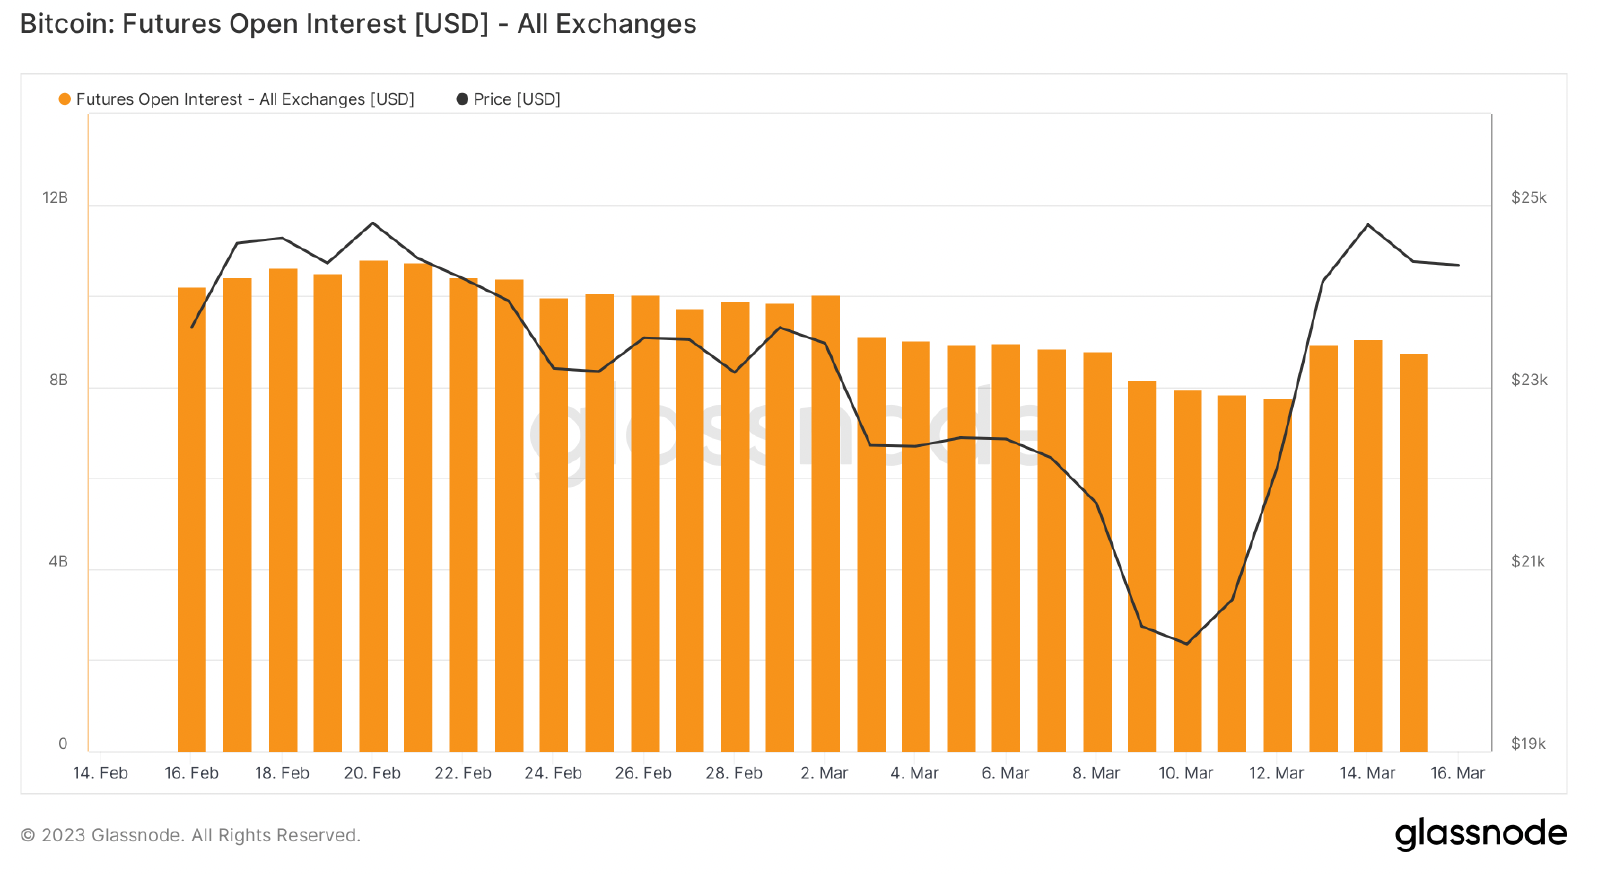
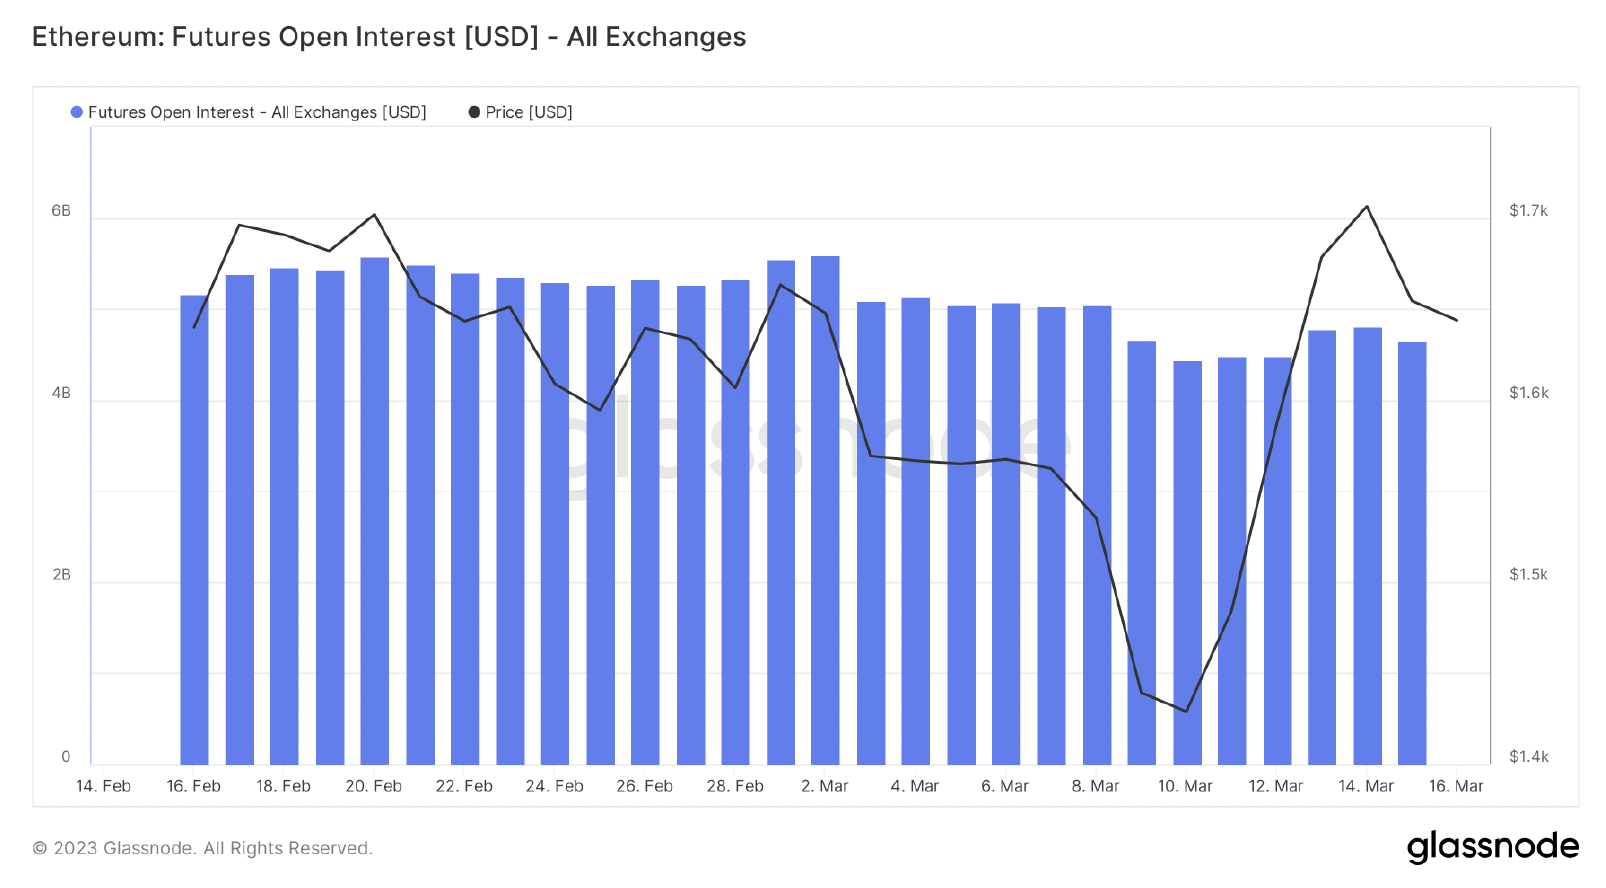
期货持仓量:本周总持仓量大幅增长,市场主力进场建仓。其中市场主力相对于 ETH,更看好 BTC。
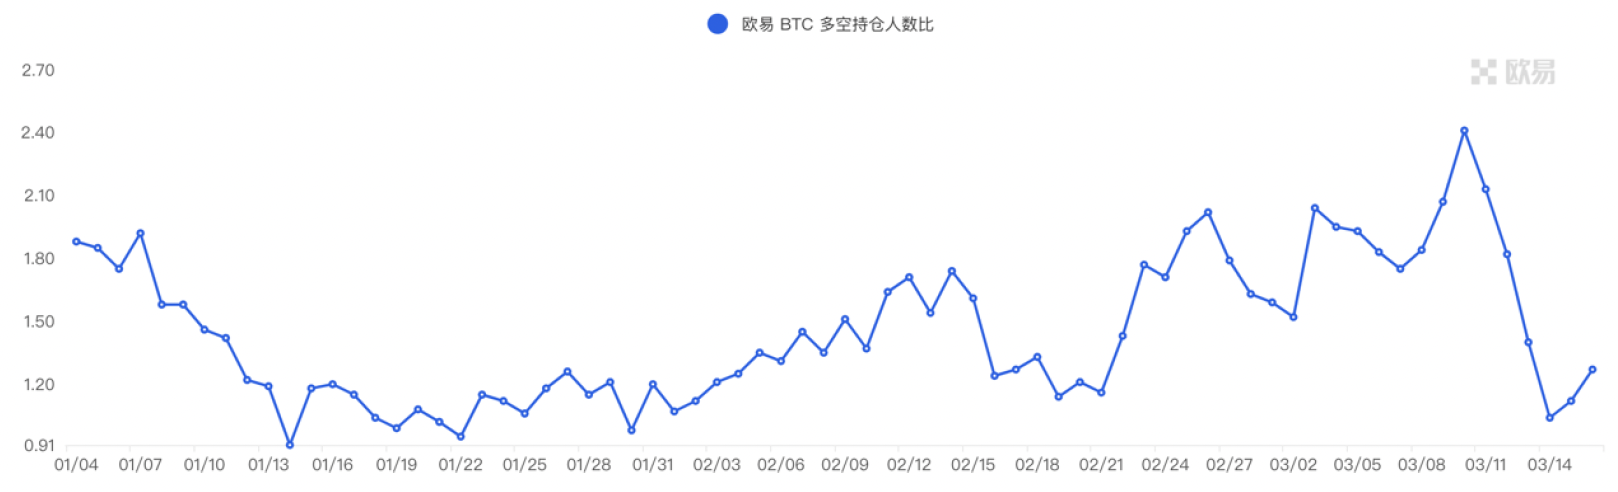
期货多空比: 1.5 。市场情绪正常。散户情绪多为反向指标, 0.7 以下比较恐慌, 2.0 以上比较贪婪。多空比数据波动大,参考意义削弱。
3.3 现货行情
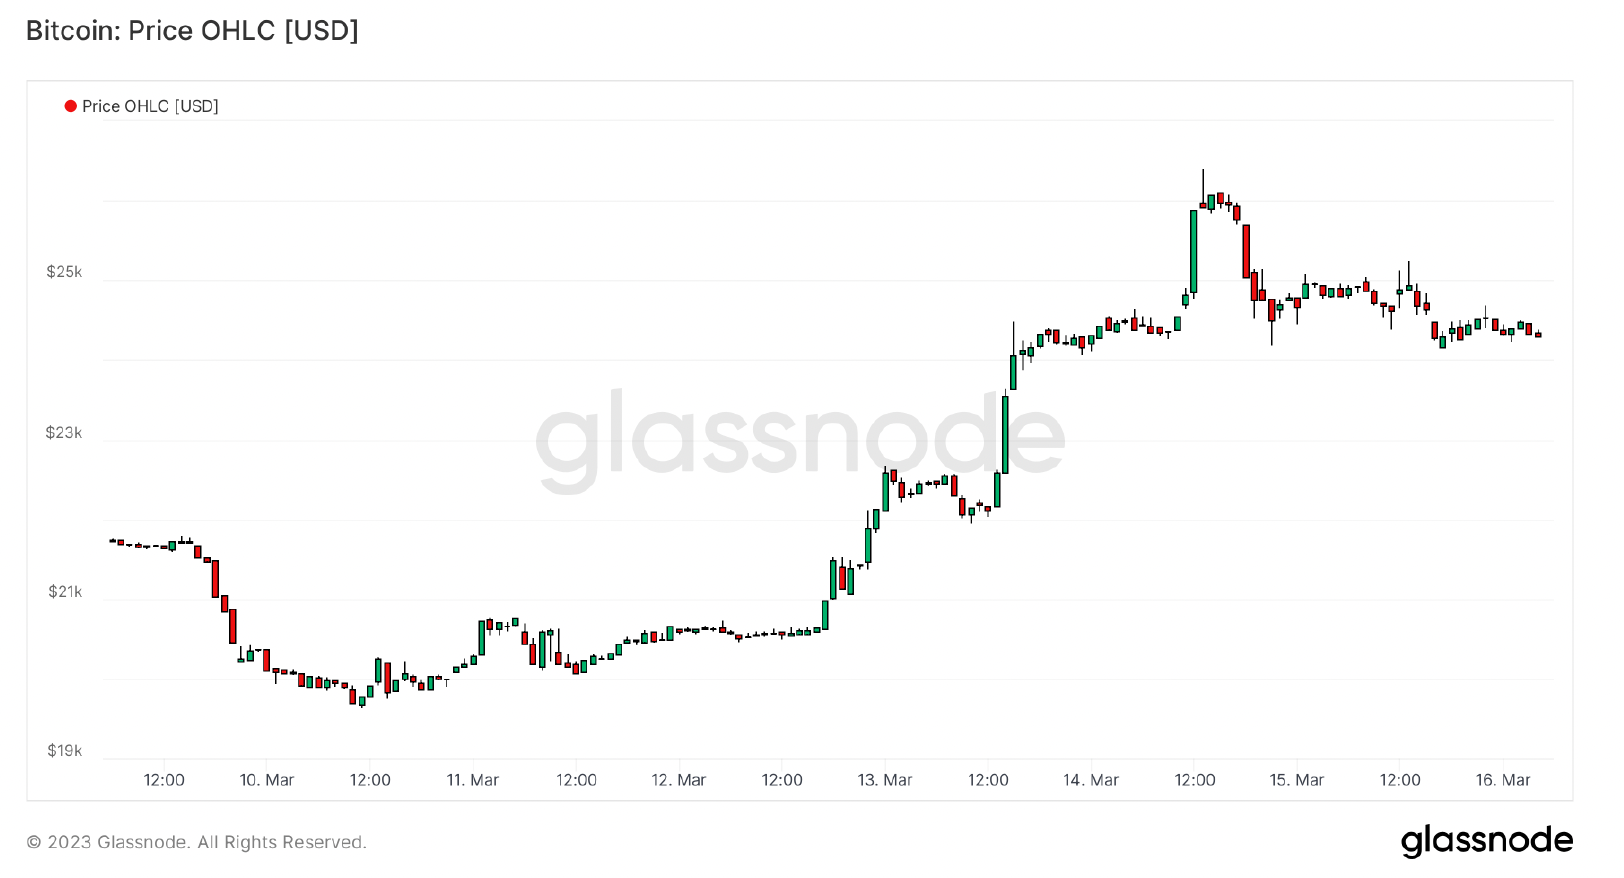
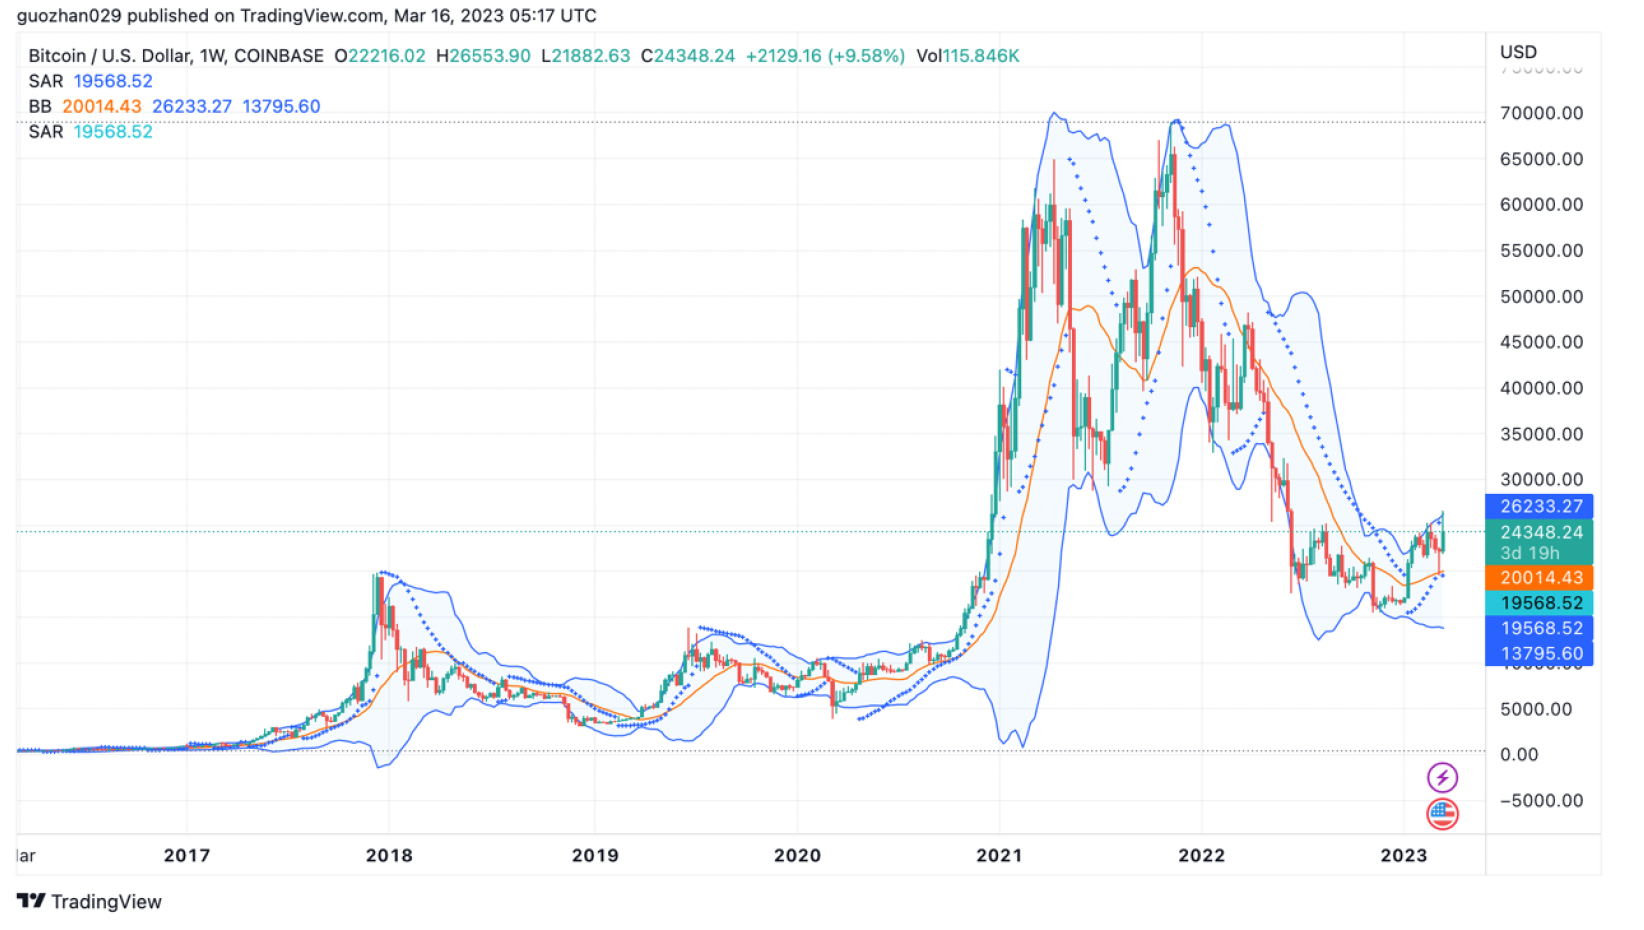
本周 BTC 大幅上涨,突破了去年 6 月以来的 25200 关键阻力位,可能进入周线级别上涨。宏观方面,美联储政策由鹰转鸽,下半年降息是大概率事件。不过当美国一旦陷入经济衰退,市场还是会陷入令人生畏的短期调整。我们看到了近期的市场动荡,但正是在这样的时刻,我们才想起为什么 BTC 会诞生于 2008 年的危机中。
市场数据:
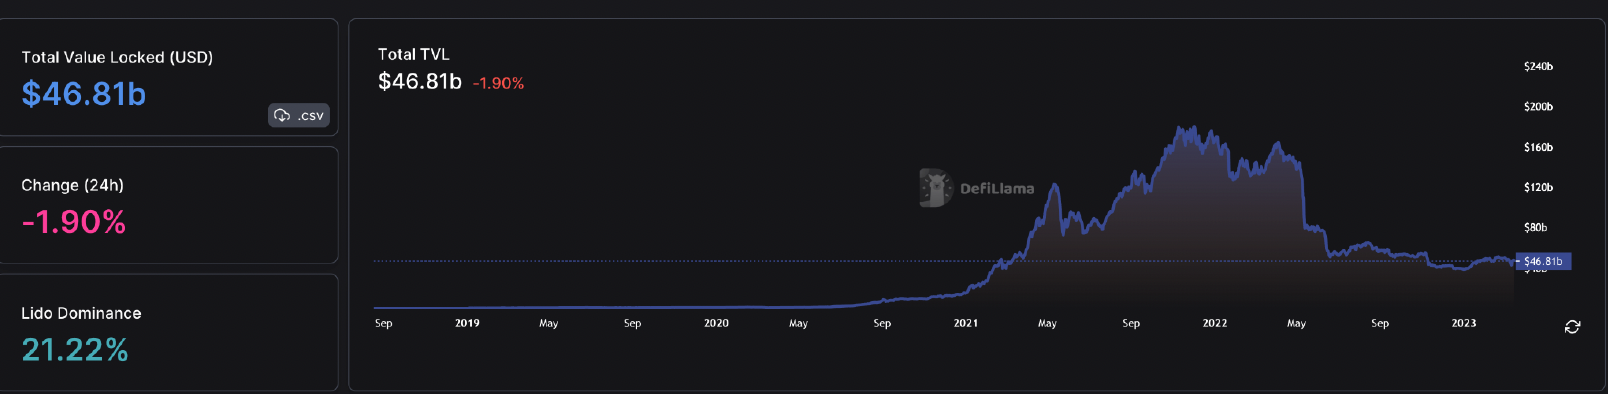
1. 公链总锁仓量情况
2.各公链TVL占比情况
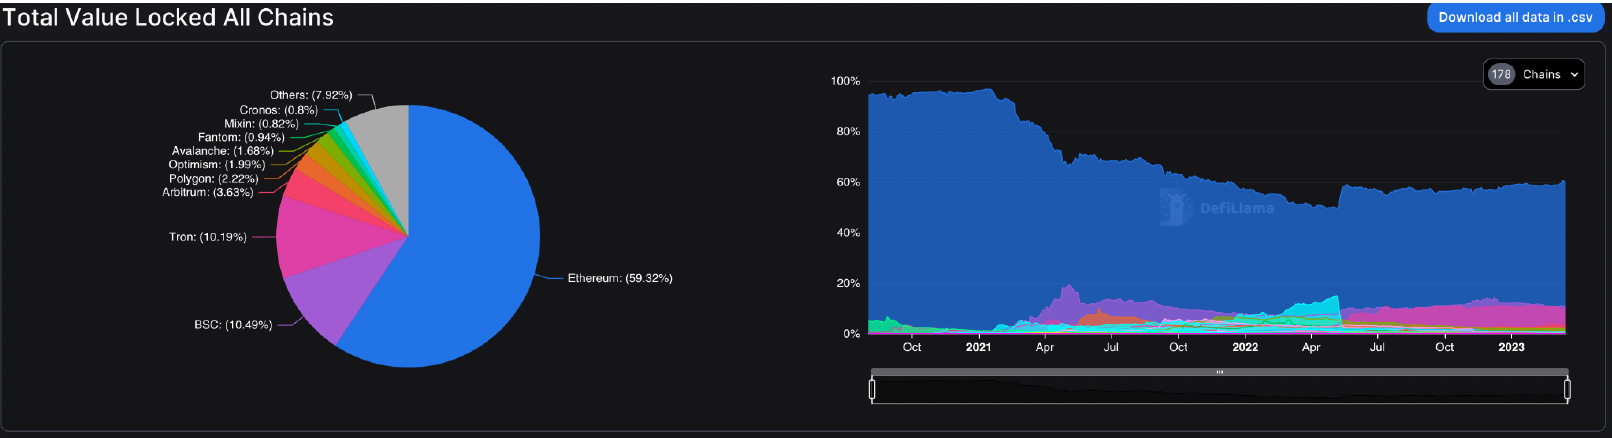
本周TVL略微回升,上涨~ 2 b 。但是Ethereum及layer2的主流公链仍在下跌,从近七日的数据看,在Layer2公链中,Polygon下跌4.04%,Arbitrum下跌5.12%、Optimism下跌1.14%、Avalanche跌幅达14.79%。其中,看近1天的情况,收到空投消息的影响,Arbitrum有5.96%的回升。
3.各链协议锁仓量情况
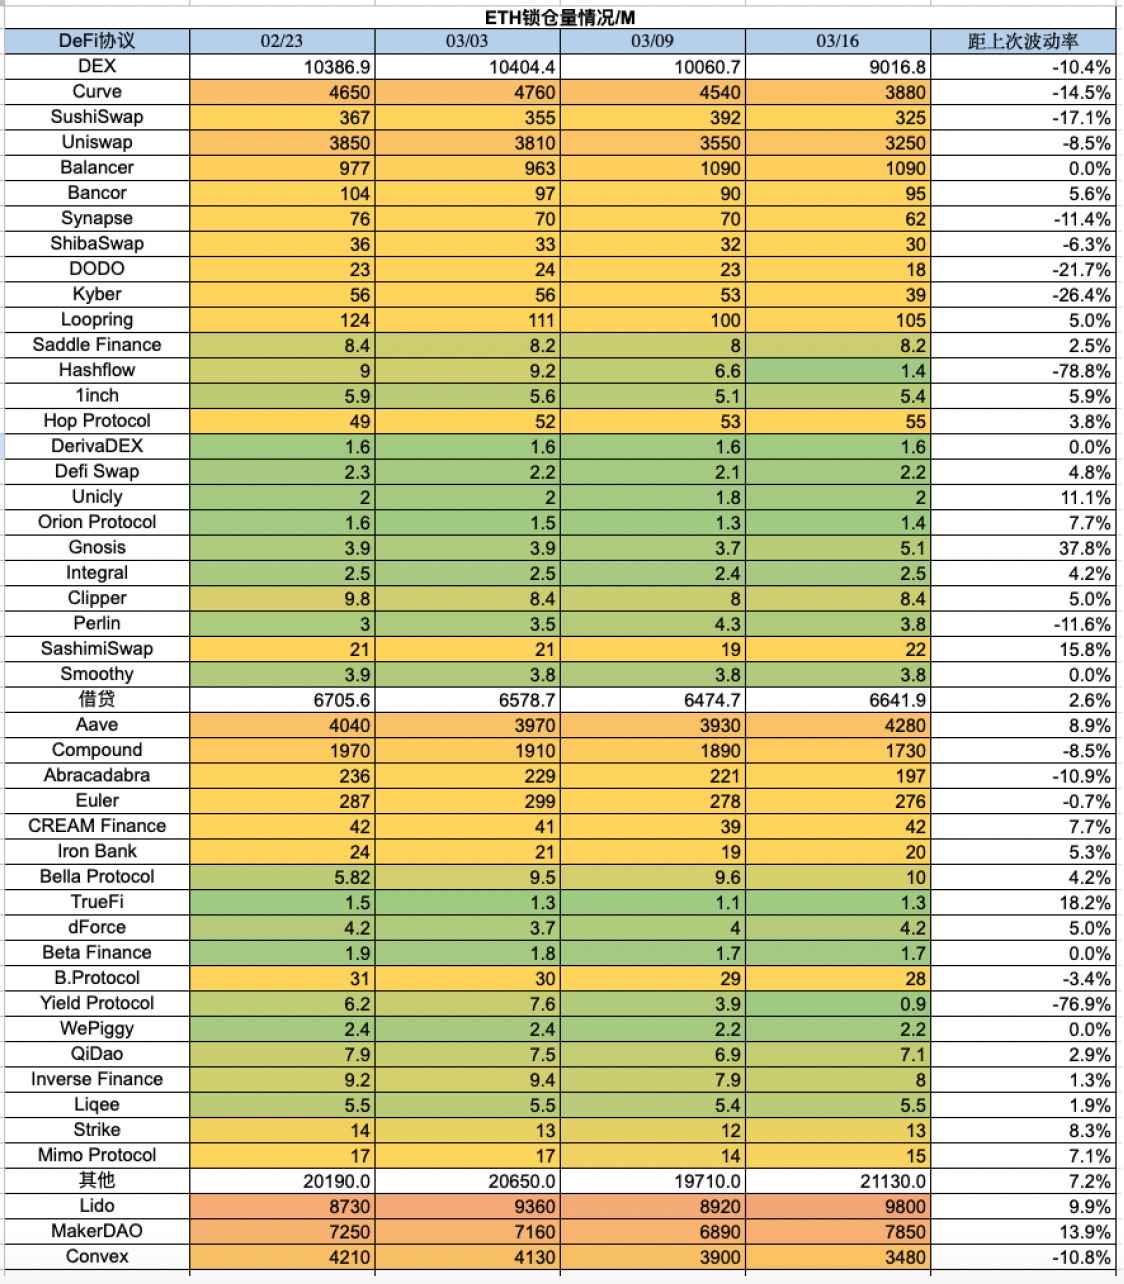
3.1 ETH锁仓量情况
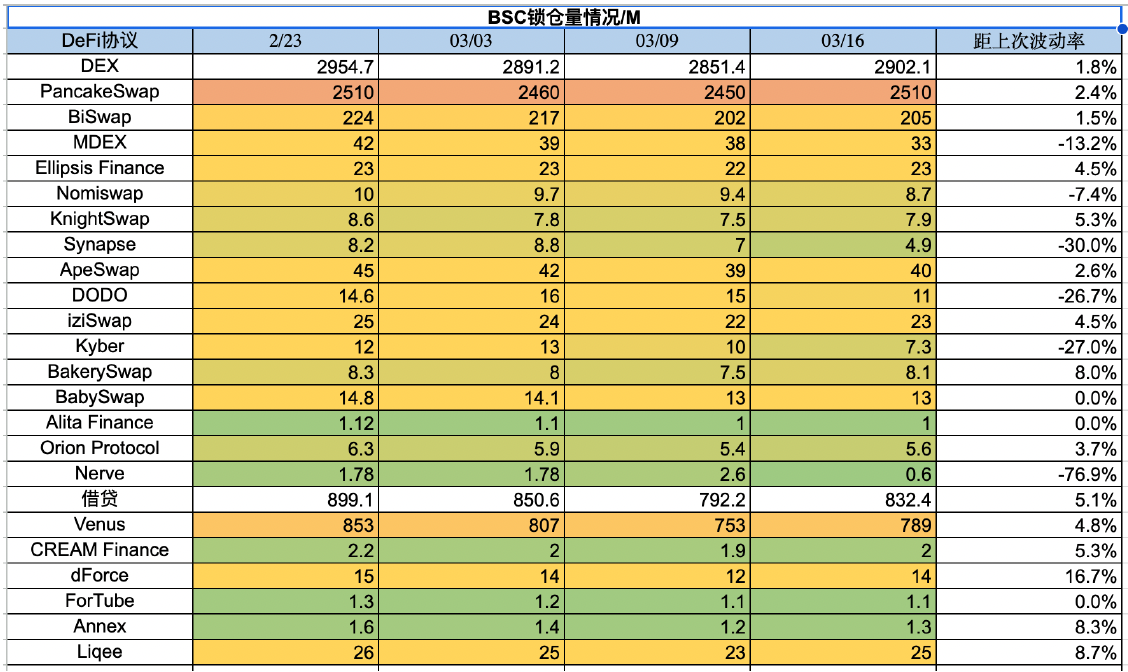
3.2 BSC锁仓量情况
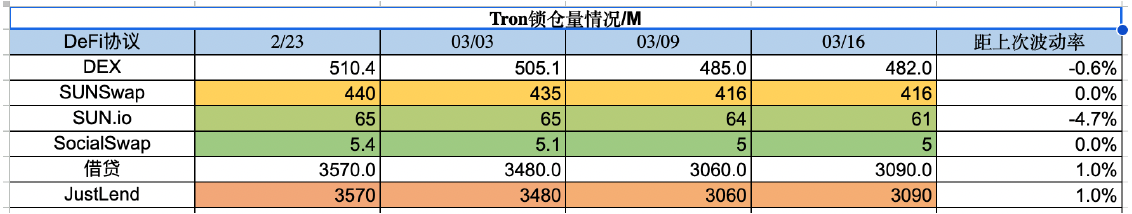
3.3 Tron锁仓量情况
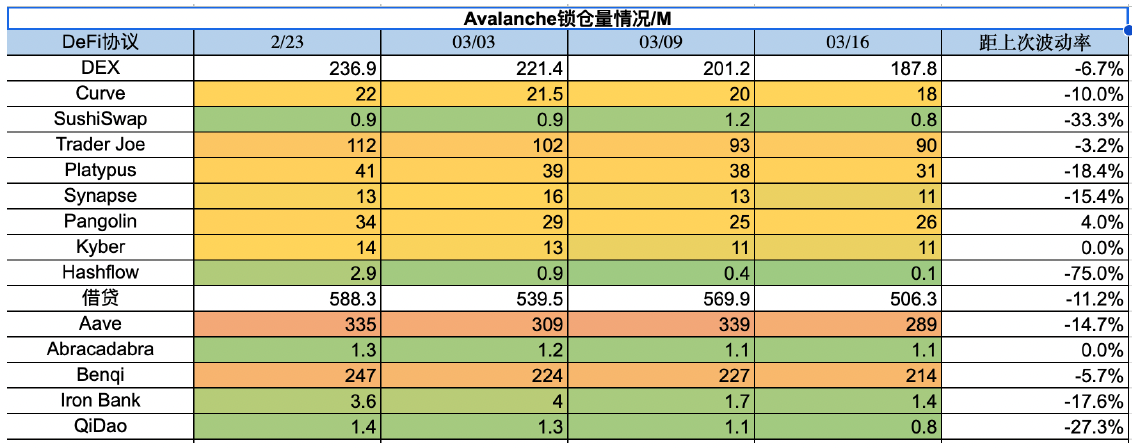
3.4 Avalanche锁仓量情况
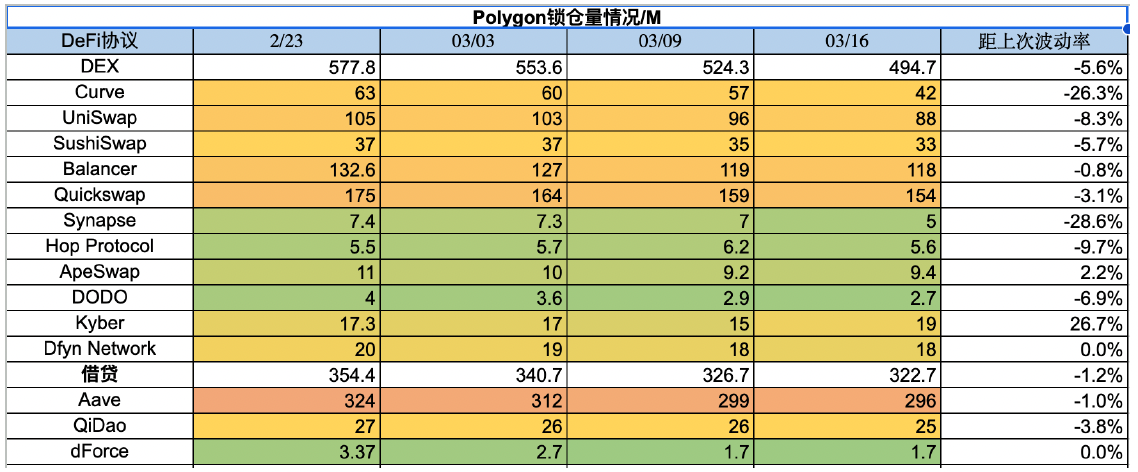
3.5 Polygon锁仓量情况
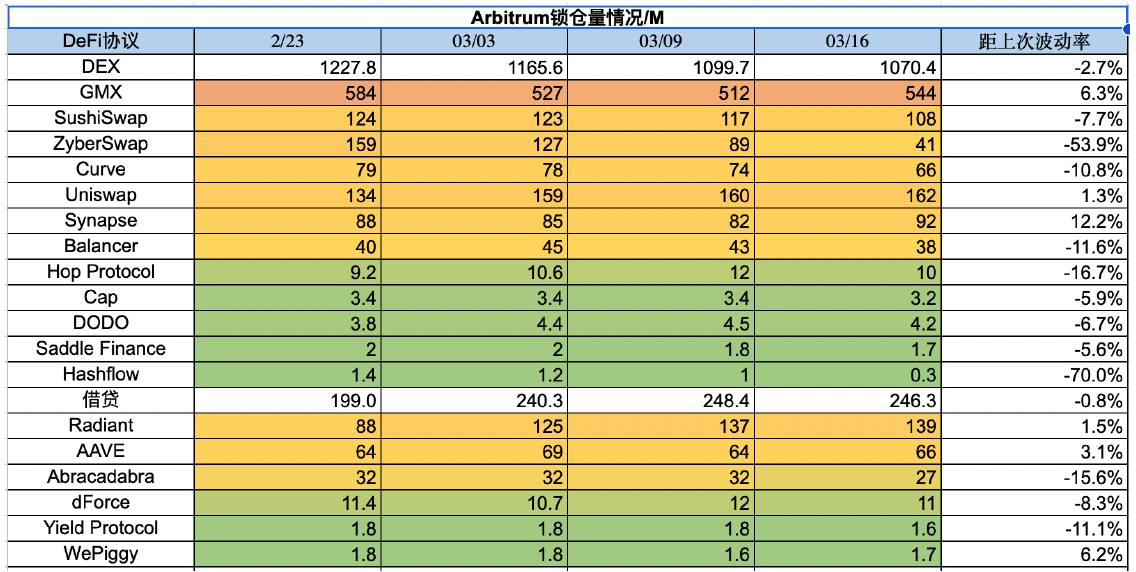
3.6 Arbitrum锁仓量情况
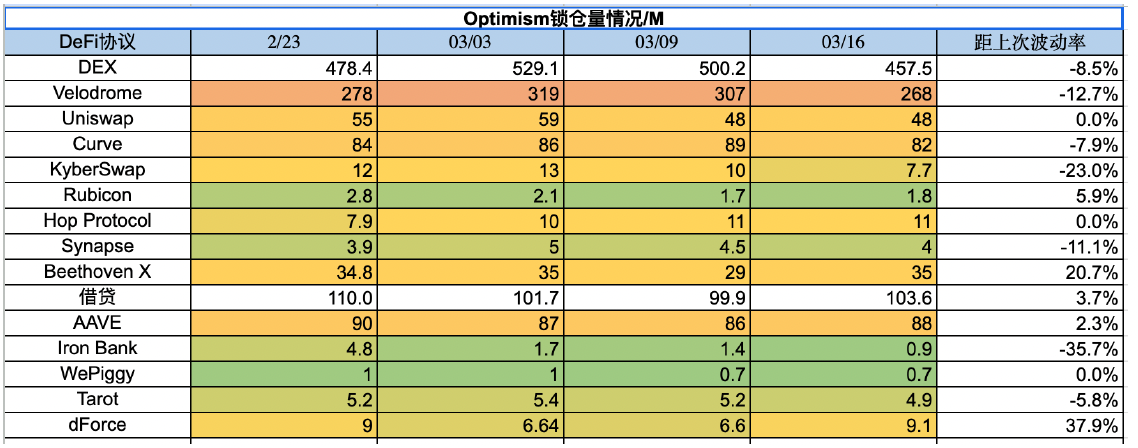
3.7 Optimism锁仓量情况
4. ETH Gas fee历史情况
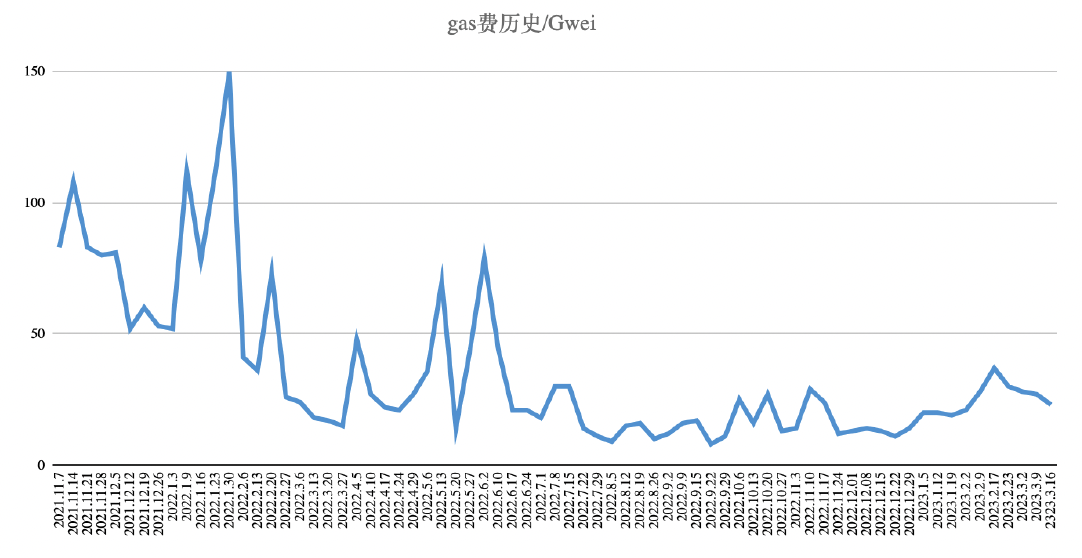
当前链上转账费用约为0.6美元,Uniswap交易费用约为5.54美元,Opensea的交易费用约为2.15美元。近几周gas fee持续保持在底部区间,市场活性的调动仍然缺乏热点。从gas消耗看,Uniswap和Blur占据头部位置。
5. NFT市场数据变化
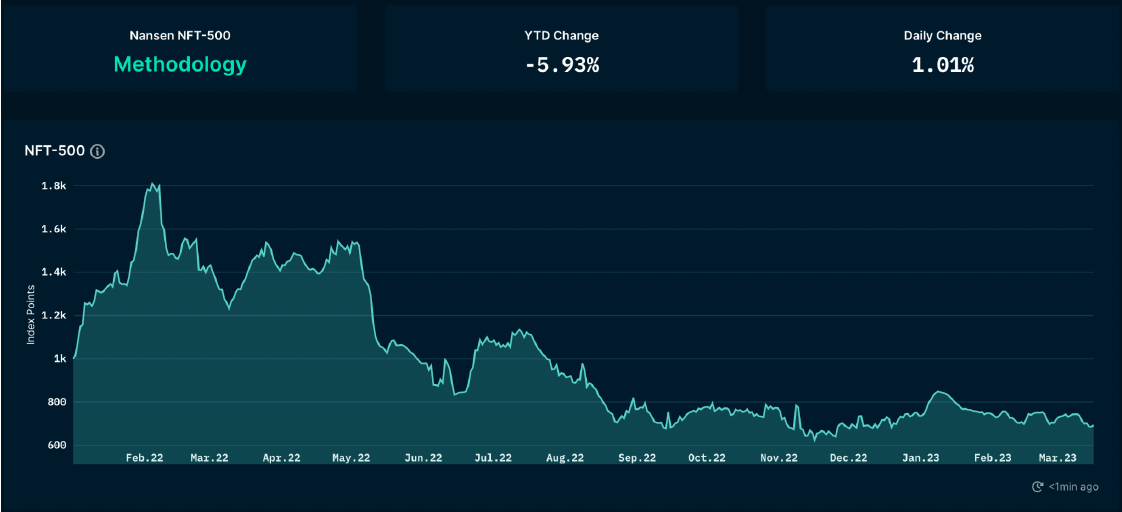
5.1 NFT指数市值:
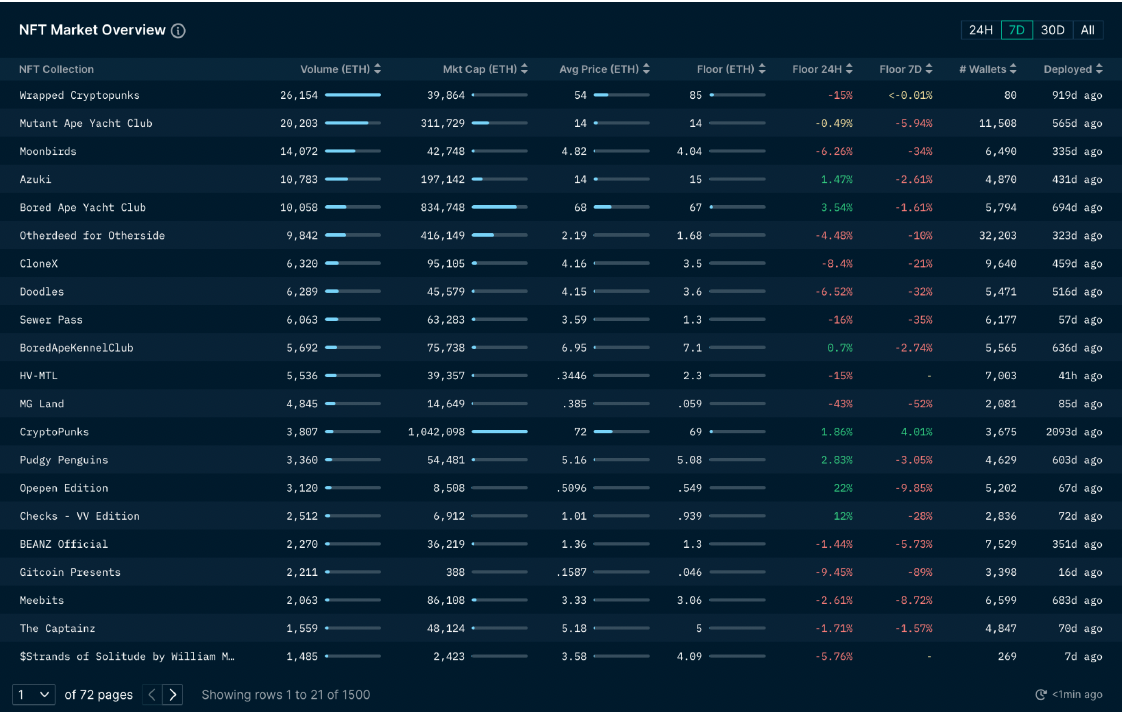
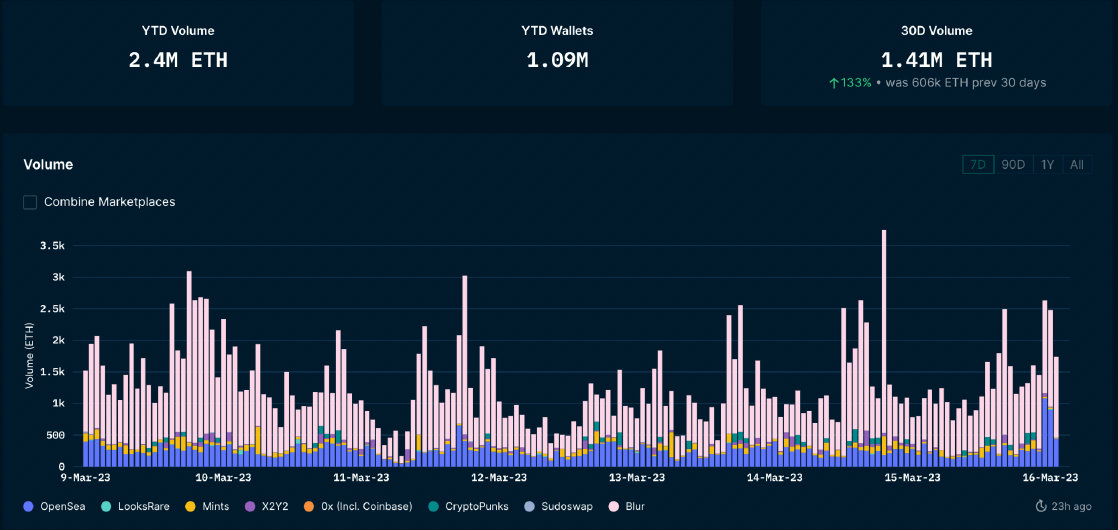
5.2 NFT市场交易概览:
5.3 NFT市场交易占比:
5.4 NFT买入地址分析:
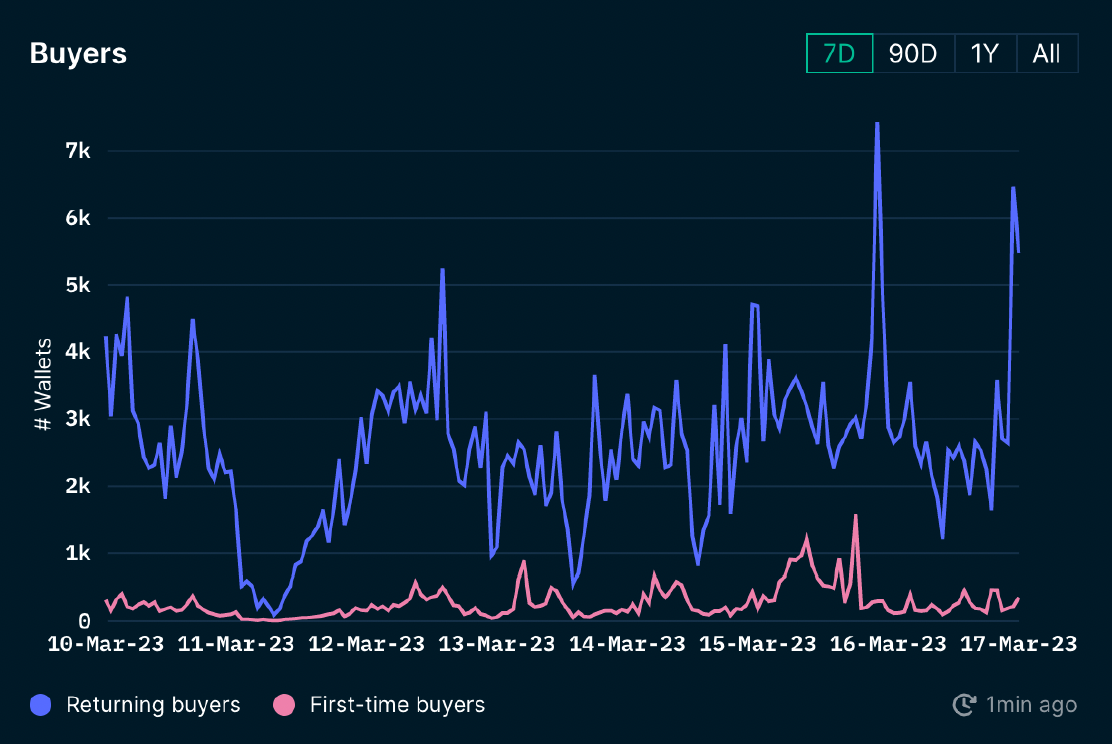
本周Blur的热度全面超越Opensea,从volume看能占据市场~70%的份额。本周NFT市场交易无明显热点,但从近七日看,蓝筹项目的地板价都在下跌,Cryptopunck下跌15%,BAYC的地板价下跌1.6%,MAYC下跌5.94%,Doodles和Moonbirds的下跌都超过了30%。同时可以看出NFT买方数量在上周剧烈上涨之后有所回调,但仍然在一个较高的水平。虽然近两周买方进场数量明显上升,但从长期看仍然没有回到2月底时的高点。
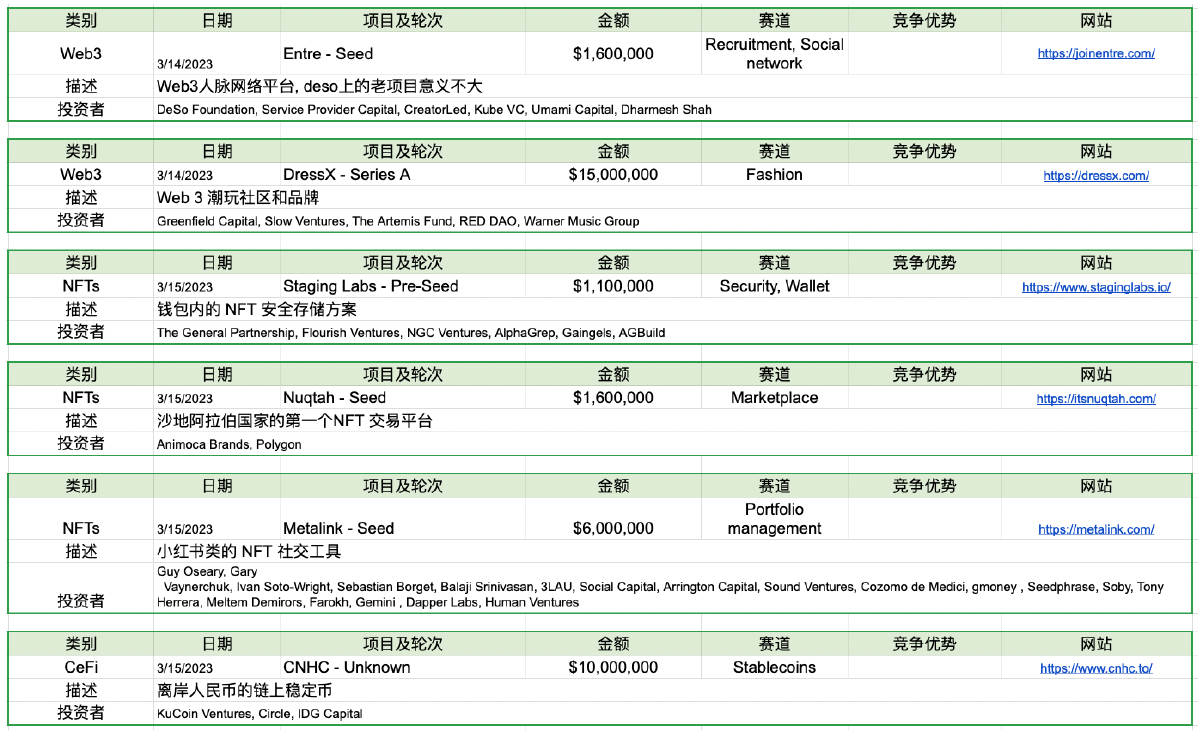
6. 项目最新融资情况

免责声明:Foresight Ventures 所有文章均不作为投资建议。投资有风险,请评估个人风险承受能力,审慎做出投资决策。


