基于稀有度等级映射的NFT估值体系介绍
本文来自:Blockin.ai & nftin.ai,Odaily星球日报经授权发布。
数字资产市场发展至今,其代表的身份象征和社交价值,成为了一种新的商业价值,而 NFT(Non-fungible Token)正是这种商业价值的一种标志,NFT 作为一种数字加密资产,是由智能合约创建、维护、执行的非同质化数字资产通证,具有独特性、稀缺性以及不可复制性。NFT 的价值评估来自于稀缺性、社区认同、持有人等多个方面,即使是同一系列,每一个 NFT 的特征和形态都各有差别、不同属性的受关注度、所有权历史等形成独一无二的供给,因此对其进行估值具有重要意义,我们希望形成较好的估值体系,为市场快速成交提供可靠的参考价格。
那么,市场上众多NFT中,是什么让一些NFT售价数百万,而另一些则售价相对较低?在收藏市场上,又是否售价和稀有性之间存在内在相关性?
借助NFT的链上交易历史记录与NFT元数据,首先,我们计算了不同collection中item稀有度评分;其次,我们评估了NFT稀有性与其价格的相关性;最后,通过其内在的相关性,我们研究了基于稀有度等级映射的估值价格体系,并在多个项目中进行了回溯验证。
Part 1. NFT稀有度计算
顾名思义,NFT稀有度衡量的是NFT相对于其他收藏品的稀有度程度。通过查看属性,可能能够确定一个NFT具有一些罕见的特征,但这个NFT相对于其他NFT有多罕见呢?
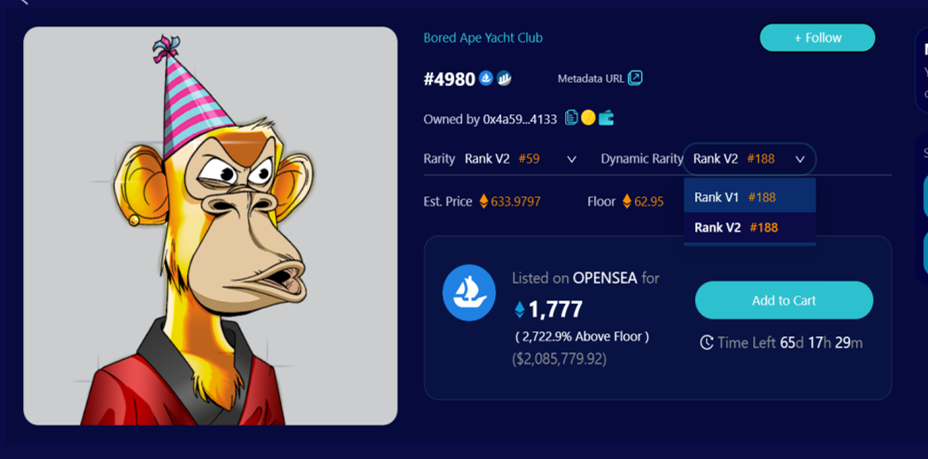
以BAYC为例,如其在 nftin.ai 上所示,BAYC具有七个不同的特征:背景、衣服、耳环、眼睛、皮毛、帽子和嘴巴。
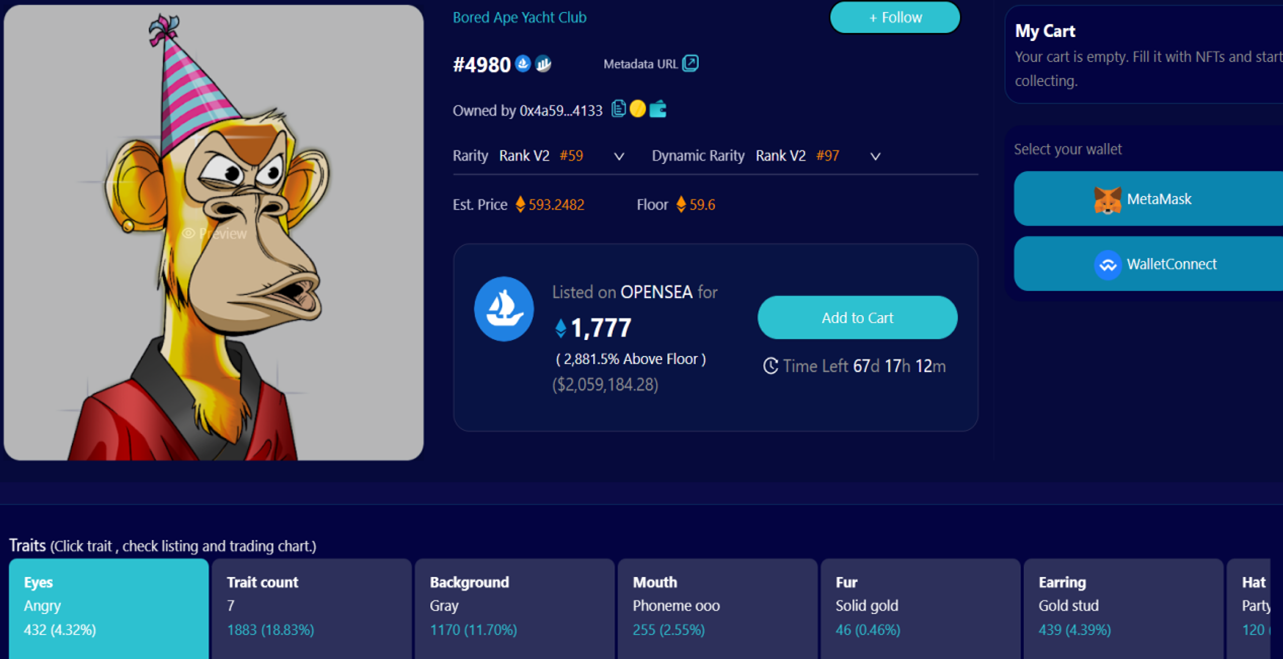
在每个特征下又有不同的子特征,我们计算其子特征的占比频率。值得注意的是,我们将其特征的个数 Trait count 同样作为一个衍生特征计算其占比。因为每个 NFT 都有多个特征及其子特征,因此必须有一种方法将所有特征的稀有性合并计算为单一值,以便对其稀有程度排名。
先前也有多种稀有度计算方法:性状稀有度排名(仅对最稀有的性状进行排名)、平均性状稀有度(将所有性状的稀有度平均在一起)、统计稀有度(将所有性状稀有度相乘),但性状稀有度排名过于强调稀有性状,平均和统计稀有度的计算又会稀释稀有性状。因此,对特征稀有度分数累加作为稀有度评分可以较好的解决以上问题。
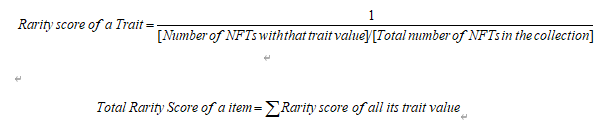
其主要思想方法为对单个NFT的每个特征进行稀有度打分,再把该NFT所有特征稀有度分数相加,最终得出该NFT的总稀有度分数。即,一个NFT的总稀有度分数是它所有特征值的稀有度分数之和,具体计算公式详见附录部分。
举例如下:
首先,计算子特征占比
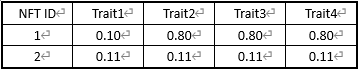
然后,根据占比的倒数计算子特征得分及总分:
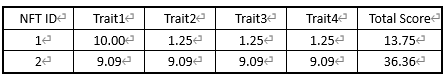
如上,可以得到每个特征值的稀有性得分和每个NFT ID的总稀有性得分,所以稀有度得分认为NFT ID 2 更有价值,因为它有更高的总分数。
值得关注的是,考虑不同特征下子特征的种类数不同,导致特征频率占比天然具有差异。我们改进了上述V 1 版本,V2版本主要思想和V 1 一致,在此不赘述,不同在于考虑了子特征个数的归一化,以及加了特征两两组合作为新的衍生特征,丰富了特征组合,能更全面的反应NFT的稀有度情况,V2描述及计算公式详见附录。
此外,我们也针对一些项目计算了V3版本,V3版本与V2不同在于增加了三个特征组合情况,但由于一些项目子特征数目成百上千个,三个特征组合的情况较多,导致计算特征的占比数值不具有较大的区分性,所以我们仅计算了部分项目的V3稀有度分数。

除以上三个版本稀有度的计算,考虑一些NFT历史上没有被交易过,我们想衡量所有被交易过的NFT稀有度分数,因此,定义了动态稀有度。它与静态稀有度计算思想方式一致,不同在于计算动态稀有度的数据只是历史上一段时间上被交易过的NFT,因此数据只是全量NFT的一部分。此外,随时间的改变,该计算数据集随时变化,因此,我们对动态稀有度每天进行实时更新。总之,动态稀有度不仅考虑了客观属性占比,也考虑了历史交易情况,动态反映了交易时间段内的NFT稀有度情况。
动态稀有度同样计算了两个版本(V 1 ,V2),如下:
另外,我们也探索了其他稀有度计算方式,如 jaccard 距离,jaccard 距离是衡量两个集合不相似的一种指标,可以计算两个 NFT 特征间的相似程度,NFT 与其他 NFT 平均相似度越大则越不稀有,具体计算方式可参考附录部分。
Part 2 稀有度与价格相关性研究
许多情况下,人们愿意为稀有物品支付溢价,但稀有度具体是如何影响价格的?我们借助链上历史交易数据,以几个蓝筹项目为例,评估了NFT价格和稀有度之间的内在相关性。
考虑我们已经计算了每个item的稀有度分数,因此我们直接探究了稀有度分数与价格相关性,计算了两者之间的斯皮尔曼相关性系数。
具体计算方法如下:
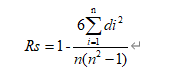
其中n是样本的数量,d代表数据x和y之间的等级差。
绝对值越接近1 ,表示两个变量之间关系越密切;越接近0 ,表示两个变量之间关系越不密切。相关系数对应的相关强度如下:
0.8-1.0 极强相关
0.6-0.8 强相关
0.4-0.6 中等程度相关
0.2-0.4 弱相关
0.0-0.2 极弱相关或无相关
我们以BAYC、MAYC、cryptopunks、moonbirds、doodles五个蓝筹项目为例具体计算近两个月的交易价格与其稀有度分数(V2)之间的相关性,图表如下:
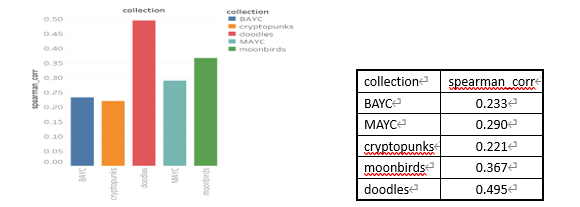
以上图表可知,单个 item 稀有度分数与价格之间在大多项目之间呈现弱相关性。
因此我们考虑根据NFT不同稀有度等级(先前已按照动态和静态稀有度分数分了20 个等级)排名将NFT分为四个大等级,并计算不同等级的交易均价的平均值(交易数据为2022-01-01 至2022-11-15 ),从而观察NFT稀有度等级间的均价关系,x代表等级:
x > 10: Legendary
6 < x <= 10: Rare
2 < x <= 6: Classic
x <= 2: Normal
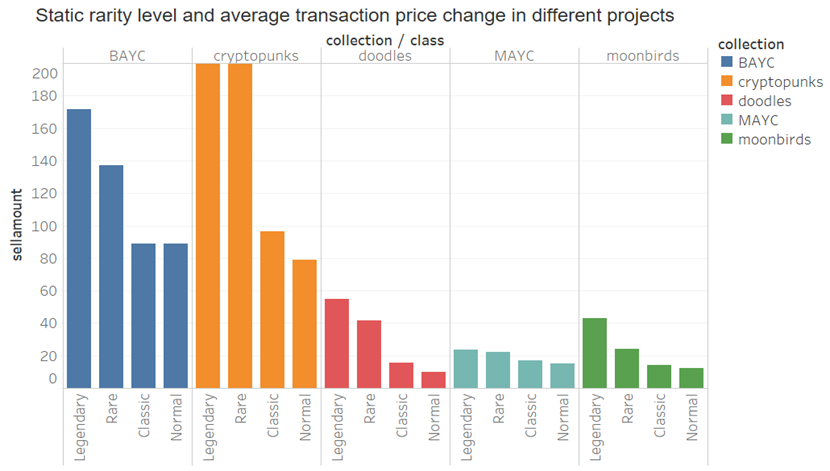
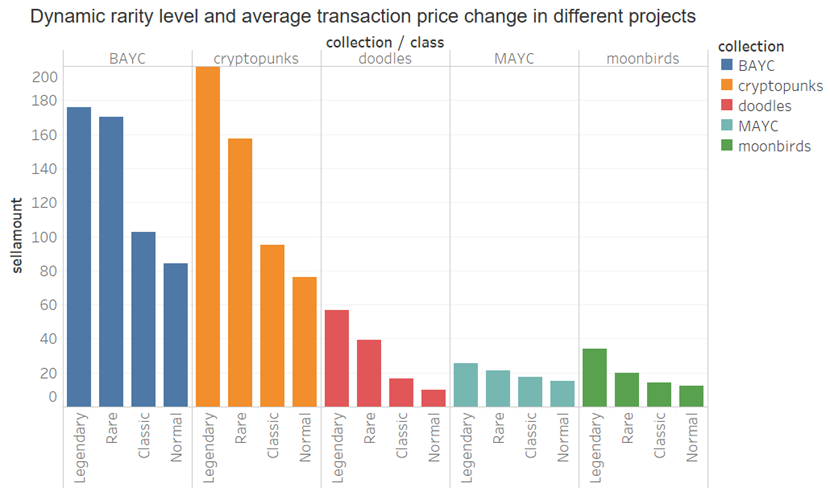
从上图可以看出,不论是动态稀有度还是静态稀有度,等级越高的NFT其历史交易均价越大,因此,我们得出,尽管单个NFT与价格间可能不存在明显的相关性,但总体来看,高等级的NFT售价在整体水平还是较高,即人们愿意为更稀有的NFT付出更高的价格。
Part 3 稀有度等级映射的估值体系
由以上研究看到,稀有度等级越高,则该等级上普遍交易价格越高,因此我们考虑设计了一套基于稀有度等级映射的估值体系,该体系依赖历史交易数据及NFT稀有度等级估计最新的NFT市场价格。
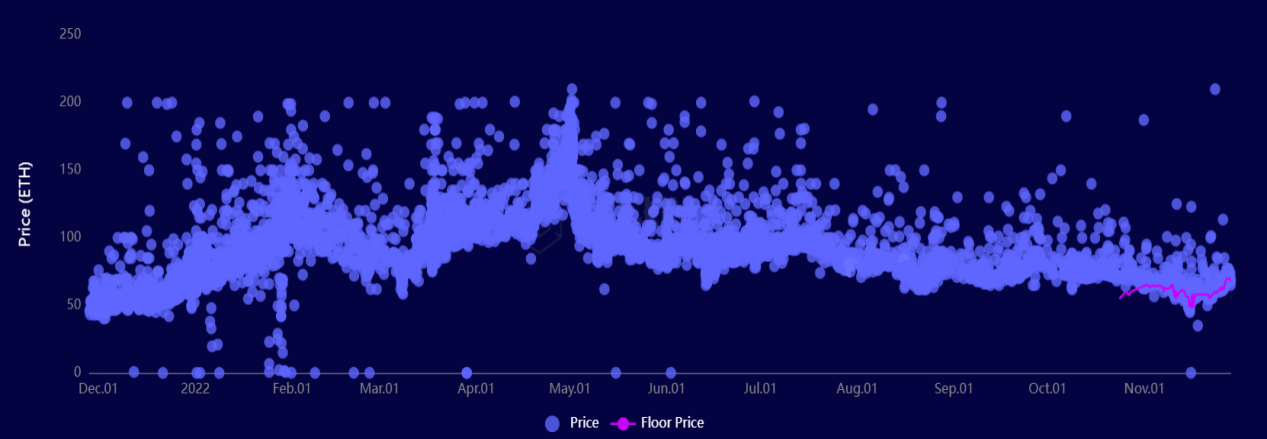
由于市场NFT价格不稳定,因此历史交易的水平线不能代表当前的交易水平线,每天每月交易的NFT价格也多在其水平线上下范围内波动,以BAYC历史交易价格为例,下图展示了其交易波动情况:
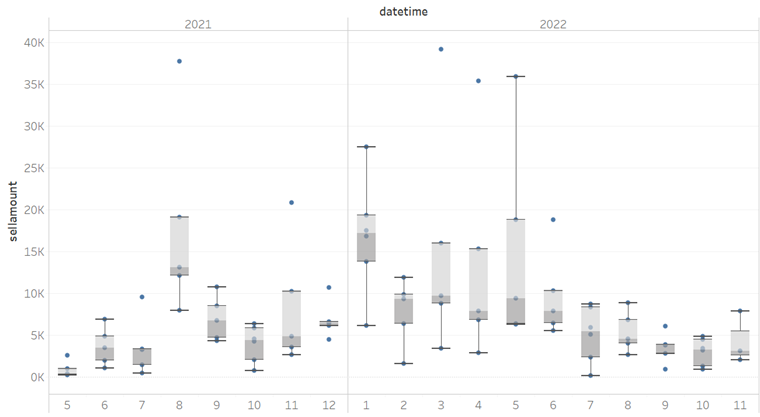
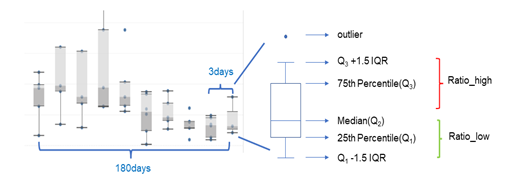
因此,对不同项目NFT的交易,我们考虑寻找可以衡量每天交易情况的水平线数值作为交易分布的锚点,由于平均值,最小最大值易受极值的影响,我们使用中位数值作为每天交易价格的锚定点并依据中位数衍生计算不同的指标,如下图有上限下限等,从而大致还原不同时期的交易分布,根据历史交易分布规律,估计不同NFT最新交易的价格。
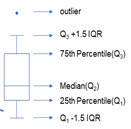
注:上四分位数:Q3 中位数:Q2 下四分位数:Q1 四分位距(IQR):Q3 - Q1 上限:Q3 + 1.5*IQR
下限:Q1 - 1.5*IQR 最大值:max 最小值:min 平均数:mean
方法总结如下:
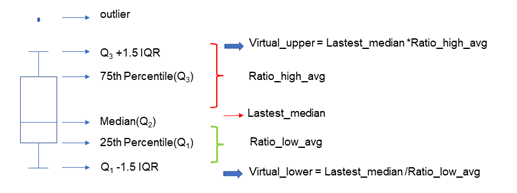
1. 历史比值的计算:计算近半年每3 天的ratio_high及ratio_low,并求所有ratio_high和ratio_low的平均值,ratio_high_avg,ratio_low_avg。
2. 根据历史比值计算最新虚拟上下限值:由上面所求 ratio_high_avg/ratio_low_avg 及使用最新中位数计算得到虚拟上下限 Virtual_upper 及 Virtual_lower
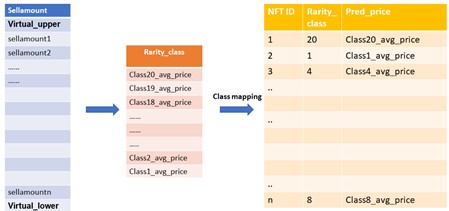
3. 最新估值队列形成:根据虚拟上下限及最新周期内所有交易分布生成最新估值队列,将在上下限区间内的原始交易数据填充进区间[下限,上限],在其之外的数据排除,作为最终拟合的估值队列的分布。
4. 估值队列等级映射:
a. 对不同等级内的原始交易价格求均值。(若有些等级值在最新交易周期内不存在,则使用前后两个等级的均值依次填充)
b. 根据item稀有度等级(已根据归一化稀有度分数(V2)分为20 个等级),将不同等级内交易均值对应映射到不同等级中的所有item上得到估值。
值得一提的是,为保证估值的客观准确性,我们在估值前对交易数据首先进行了清洗,如下:
a. 对于明显刷单行为及对应的刷单平台交易去除。
b. 考虑项目出现之初,交易行情不稳定,因此针对不同项目,排除前几个月不等的交易数据。
c. 存在个别与当天交易中位数比值过小的交易,不能客观反映市场水平,进行排除。
另外,以上计算版本中,我们在对历史交易结果的回溯中发现一些估值结果不能满足我们的估值预期,比如一些高稀有度等级ID的估值与当天挂单价格及实际真实交易价格相差过大,因此我们在上面版本的基础上对部分高稀有度等级的ID估值进行了修正:对历史上有过高价交易的ID,单独计算其历史交易比值的平均值ratio_avg,使用最新周期交易中位数median*ratio_avg,以替换等级映射的估值。
由于存在多个版本的稀有度评分,我们在不同项目下试验了不同稀有度评分映射估值的方式并进行回溯验证,综合结果及效率来看,取V2版本的稀有度等级映射较好,因此目前线上展示采用静态稀有度等级V2映射的估值。
估值准确性验证
为衡量估值体系的准确性,我们根据预测某天价格与当天真实交易价格计算平均绝对百分比误差(Mean Absolute Percentage Error,MAPE)。
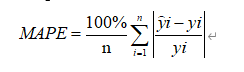
其中,yi表示真实值,y^i表示预测值,n为NFT的个数。
以下列出几个蓝筹项目的验证结果,验证日期为2022 年之后数据(2022-01-01 至2022-11-15 ):

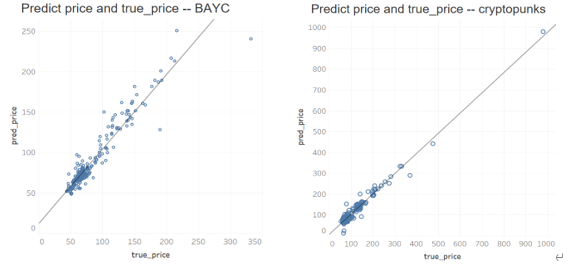
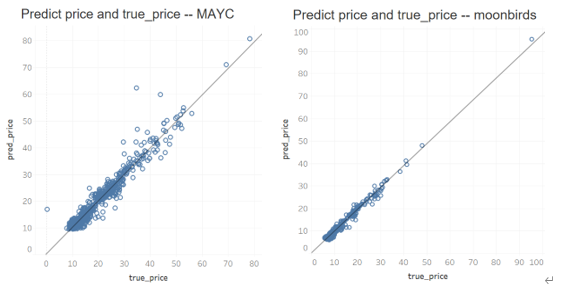
下面展示在几个项目中回溯近两个月(2022-10-01 至2022-11-15 )的预测价格与实际交易价格的散点图
结论与总结
从以上分析结果可以看出,基于稀有度等级映射的估值体系具有一定的准确性,但同时也存在一定的有限性:a. 该体系基于一段时间的中位数交易估计最新的估值,目前无法应对短时间剧烈波动的市场交易情况,此外,对于交易较少甚至一段时间没有交易的项目,我们可参考的历史交易规律过少,可能影响最新估值。
稀有度只是影响NFT售价的原因之一,未来,我们也将跳出稀有度等级映射的方式,使用原始属性值及交易数据,加入NFT holders、NFT指数、币价等多个影响因子进行线性回归及非线性回归估值模型尝试,从而研究一个可扩展的基线模型,提高模型的准确度及覆盖范围。
附录
V 1:
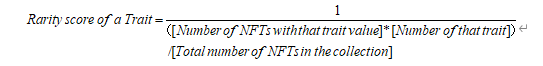
V2:
a. 特征分数计算归一化
特征归一化考虑不同特征下子特征数量不同导致的特征稀有度分数差异。例如,在 BAYC 项目中,Earring 有 7 种不同子特征,Mouth 有 33 种不同子特征,则通常情况下,Mouth 比 Earring 的稀有度分数则更有区分性,因此考虑特征归一化。
b. 特征两两组合
多个特征基于排列组合丰富了不同特征组合的占比情况统计,能从更高阶的方式刻画稀有度。例如,BAYC 共有 7 个不同部位特征,则两两不同组合个数为: Combine( 7, 2) = 21,将两两组合作为新的特征计算稀有度得分。组合特征稀有度得分计算方式与上面一致,在此不赘述。
综上计算,

Jaccard 距离:
杰卡德距离(Jaccard Distance)是衡量两个集合不相似的一种指标,其范围是[ 0, 1 ],数学表达式如下:
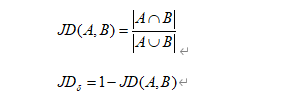
计算过程包括四个步骤:
a. 1-相似特征的数量除以唯一属性的总数(对所有 NFT 对重复此过程)

b. 对所有结果取平均值
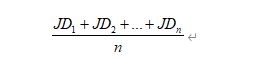
c. 归一化
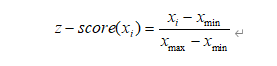
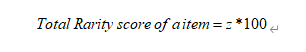
d. z 得分* 100