
熊市抄底指南
本文来自 Dappradar,原文作者:Charlie Butler,由 Odaily 星球日报译者 Katie 辜编译。

大多数人都想过“抄底”,但往往抄在“半山腰”。这轮熊市会是抄底的机遇吗?如何判断底部,并制定更完整的投资策略?
为此,我们整理了一套熊市抄底规则、技巧和工具,助你在对市场有全面了解的基础上建立客观分析方法。
抄底的总体原则
1. 找到真正适合抄底的资产有一定的难度。目标资产至少需要满足两个条件:
(1)价格大幅下跌;
(2)有强有力的迹象表明价格将再次上涨。
2. 管理风险。决定你能承受多少损失,并在你所做的任何交易中设置止损。如果你的资产价值太低,你就卖掉它们,从而减少损失。
3. 谨慎行事,要认识到没人能每次都正确解读信号。保持客观,抓住抛售时机,然后继续前进。从理论上讲,抄底意味着你买入的是一种已经下跌但随着大盘复苏应该会再次上涨的强劲资产。但有时,当你认为你在抄底时,你可能只是抓住了一把持续下跌的刀。
4. 不要把抄底作为你唯一的策略。寻找其他创造长期利润的方法。平均成本法是一种延长投资期限的方法。你也可以买入正在上涨的代币或 NFT,它们需要显示出足够强大的基本面。因此学习技术分析的基础知识必不可少,不要偏信听“韭菜大神”的赚钱之道。
熊市技术分析基础知识
以下是常用加密货币技术分析的介绍。愿你充分利用这些工具:
K 线图
K 线代表了一个代币在一段时间中的表现。K 线分为四部分,分别是开盘价、收盘价、最高价、最低价。 按欧美市场习惯,当收盘价低于开盘价时,K 线是红色的;当收盘价更高时,K 线是绿色的(你也可以在券商或交易所页面自定义设置)。
相对强度指数(RSI)
相对强弱指数帮助分析师衡量近期价格变化的幅度。它在价格图表下表现为一个振荡的直线图。
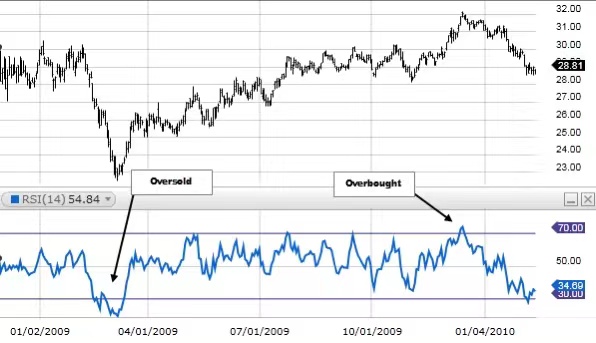
读数从 0 到 100,值超过 70 通常意味着资产被超买或高估,这意味着可能是时候抛售了。如果你的 RSI 低于 30,则相反,表明它被超卖或低估,现在可能是买入的好时机。
如果你将该指标与支持和阻力水平分析结合使用,将更好地了解哪些加密货币可能即将上涨。
支撑位和阻力位
支撑位和阻力位分别表示资产触底或触顶的预测点位。有三种方法可以确定:
1. 看价格图,查看代币的价值在哪一点反复回落或不断触底(但这并不是特别准确,也没有考虑到其他交易者的活动)。
2. 找出当资产达到某个价格点时,哪些人可能会买入和卖出。
例如,在某些代币中,少数巨鲸玩家控制着大部分份额。排名前 50 的 ETH 持有者控制着整个 ETH 供应的 17.93% 。仅这个钱包就持有价值超过 20 亿美元的 ETH,是持有 ETH 最多的个人账户。
如果我们知道这 50 个地址买入 ETH 的平均价格,我们就可以大致知道他们何时可能会止损并卖出手中的资产。如果他们同时这么做,这可能意味着随着越来越多的加密货币进入市场,ETH 价格将进一步下跌。
3. 使用移动平均线。在下跌趋势中,移动平均线通常起阻力作用。当价格触及该价格时,通常会反转。
移动平均线(MA)
MA 通常被用来确定资产价格的支撑位和阻力位,也可以用来判断资产的上升或下降趋势。200 日移动均线上升表明:资产在很长一段时间内一直在上涨。可以将 MA 与其他指标结合起来,帮助判断一项资产是否会出现逆转,或者是否会延续目前的轨迹。了解长期移动平均线及其含义是避免陷入“死猫式反弹”(价格短时反弹)的好方法。
平均定向指数(ADX)
ADX 指数是一个势头指标,有助于确定趋势方向的强度。它还伴随着另外两个指标:负向指标和正向指标(DI)。ADX 所需的计算是相当耗时的。
TradingView 已经开发了一个内置的 ADX 工具,可以帮助我们立即发现趋势,并快速进行交易。ADX 在 0 到 100 之间测量。数字越高,表明趋势越强。
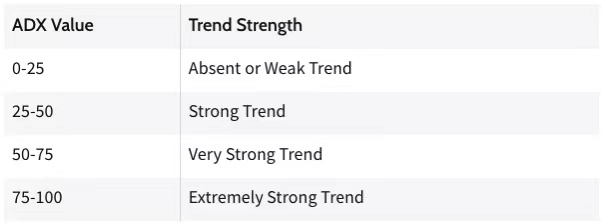
平均定向指数趋势强度图
值得注意的是,ADX 指数很少超过 60。如果 ADX 指数高于 25,这意味着有强烈的信号。如果它低于 20,这意味着一个疲软的趋势。界限在哪里,以及它们是否交叉,都可能是买卖的标志。例如,如果正向指标越过负向指标,这可能是买入的好时机。建议将 ADX 与其他工具一起使用。
抄底常识和玄学
小道消息 & 相信直觉
以上工具都是定量分析的例子,是以数学和统计为基础的。
除了数据分析,还有小道消息和盘感直觉。
当关于某个项目的一系列坏消息让人们开始对它失去信心,或者你提前得知 CEO 要离职了,这都将影响该代币的价值。图表和可量化的趋势是做出长期决策的最佳方法。但不要低估你自己的直觉。
不是所有资产价格都能反弹
网上的消息经常告诉人们在熊市期间要耐心等待,很快一切都会恢复正常。但从 2017 年的繁荣和 2018 年的崩盘可以看出,并不是所有五年前的赢家如今都“死而复生”了。
2017 年牛市高峰期市值排名前十的代币,有多少仍然受欢迎?其中有多少在今天的前 10 名?
来源:CoinGecko
在上面列出的 10 种代币中,只有 4 种仍然在今天的前 10 名。BTC 和 ETH 仍稳坐前十的宝座。按市值计算,这两种代币是最大的两种代币,而且短期内不会被取代。
瑞波币(XRP)也成功保持了地位。它能维持多久是另一个问题。该代币在2018 年 1 月 4 日达到了 3.84 美元的峰值。即使在去年强劲的牛市中,瑞波币也只能涨到 1.84 美元,不到其历史高点的一半。
来源:CoinGecko
另一个幸存者是 Cardano,但是否有长远的未来还没有定论。其创始人正大力支持,开发人员创建 NFT 和 NFT 交易平台。
历史上到处都是曾经成功的公司倒闭的例子。不要沉迷于“一切都会在下一轮牛市中反弹”的错觉。
尽早为成功打下基础
暴富可能在牛市中实现,但那些长期成功的人是在熊市打下基础的。
正如 Shelby Cullom Davis 所说,你的大部分钱都是在熊市中赚的,只是当时你没有意识到。如果打算抄底,那么在资产已经处于上行趋势的时候买入不是好主意。种一棵树的最好时机是十年前,其次是现在。你可以开始做研究,找出适合你的代币和 NFT。
寻找基础较强的项目
数据追踪平台的排名页面是找到最好的平台和项目的最佳地方。推荐使用这些工具并学习如何使用它们来进行自己的分析,比如 DappRadar、Dune Analytics、DeFi Llama、Nansen 等。
找出资产价格下跌的原因
打开推特,查看有关该项目的新闻和谣言。
开始灵魂发问:他们在 6 个月前是否有大批员工离职?是否存在黑客攻击和漏洞,导致其社区停止游戏或撤回资金?也许一个平台的代币价格下跌是因为它在 2021 年的牛市期间过于激进,在 2022 年的熊市开始时又重返现实?
如果你发现一个 NFT 项目的创始人已经参与了多个 rug pull,避开该项目可能才是明智的。但是如果 NFT 仅仅是由于外部因素而下跌,那么当它下跌到足够低的时候,也许它仍然值得买入。
以 The Sandbox 为例,SAND 代币的价格在 11 月 25 日达到了历史新高,当时正值加密货币熊市和元宇宙热潮的高峰。自那以后,该指数一直呈下降趋势,目前远低于峰值水平。
总结 SAND 价格下降的几个原因:
在疯狂的 2021 年,SAND 被高估了;
美联储加息导致市场变得更加厌恶风险;
在围绕着 Facebook 改名为 Meta 的最初的元宇宙热潮之后,人们开始思考并正在研究元宇宙的含义;
在 2022 年 The Sandbox 没有太多热度事件。许多公司和明星已经买下了其地块,但虚拟世界本身还没有满负荷运转。
SAND 价格的下跌有外部因素和内部因素。但这并不意味着它就是一款糟糕的产品。
了解项目
研究项目的领导、团队和路线图,查看是否能达到他们所说的里程碑,查看天使投资者列表和其背景。加入 Reddit 和 Discord。与那些自己做过研究、有丰富知识的社区成员交谈。谷歌搜索。
入手之前应该亲自实践。如果你打算买入 AXS,那就开始玩 Axie Infinity,看是否对游戏有认同感并且认为这款游戏有未来。分析 Axie Infinity 的开发公司 Sky Mavis 是否对未来有很大的规划。如果你认为 REVV Racing 曾经非常受欢迎,并且有机会卷土重来,那么打开 Dapp,体验几场比赛。
如果一个平台或天使投资者的规模足够大,可以阅读他们的公司报告,看看是否有足够的资金和人员来兑现承诺。看看这些公司的股价。如果市场投资他们,也许暗藏财富密码。
以 The Sandbox 为例,由香港游戏开发商 Animoca Brands 所开发。这位天使投资人和全方位的 Web3 巨头在运营基于区块链的企业方面有着丰富的经验。Animoca Brands 本身拥有坚实的基础,由业内知名人士带领。这里所有的迹象都指向强有力的领导和良好的决策。即使在当前的加密冬天,该公司仍然表现良好。
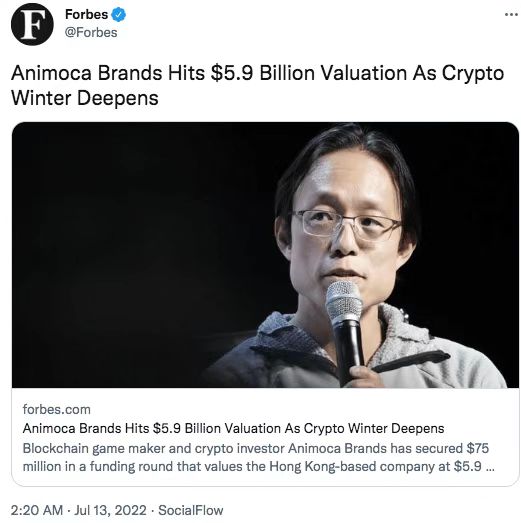
来源:Twitter
自我剖析想要入手的原因
在经历了发掘适合抄底的资产的阶段之后,下一件事是以一个好价格入手。
决策需基于可靠的研究基础。如果你知道你想入手的原因,那么你就可以在经济不景气的时候有信心继续持有。如果你只是在适合抄底的基础上买入,要是价格进一步下跌,你会如何选择?你的决定应该基于知识,而不是心血来潮。
技术分析并找到最佳入手时机
知道要入手什么资产,以及入手的原因,接下来就是以合适的价格买进了。把技术分析付诸实践并开始行动。因为已经将搜索范围缩小到一个或几个代币或 NFT,可以火力全开。阅读价格图表,观察趋势,关注你想要买入的平台或项目的新闻。如果你尽职调查,并遵循这些迹象,就有很大的机会在好时机入场。
总结
理解购买加密货币或 NFT 的动机是保持长期成功的关键。如果你不能向自己或朋友解释你的理由,那么你可能根本不了解这些资产。
抄底是一句流行语,而不是一种投资策略。要想成功,需要做大量的工作和有知识才能以低价入手资产。你还需要耐心,知道何时止损。赚钱的最好方法就是不把钱花光。
请记住,如果你购买加密货币,你为此付费的是区块链,你也为所有建立在区块链上的 Dapp 以及所有从事这方面工作的人付费。置身于一个新兴行业,这个行业还有很多需要了解的方向。尽可能多地了解加密成员。当你参与到他们的社区中,你会感到归属感。


