
Coinbase:稳定币和不稳定的收益率
原文来源:Coinbase
原文作者:George Liu & Matthew Turk
原文编译:ChinaDeFi
在这篇定量研究文章中,我们将研究Compound Finance V2 DeFi 协议的稳定币贷款收益率,并分享我们对收益率表现、波动性以及哪些因素推动 DeFi 协议抵押借贷收益率的看法。
虽然我们知道最近 Terra 的算法稳定币 TerraUSD (UST) 的崩溃,但我们在这里的分析是关于中心化稳定币的抵押贷款收益领域。
我们在这篇文章中得出结论,使用稳定币进行低风险(在DeFi范围内)抵押贷款,可以优于传统金融市场的无风险投资。
USDT / USDC收益率分析
已将资产放入流动性池的 Compound 用户可以使用 exchangeRate 计算总借贷收益率,这表明贷方随着时间的推移可以获得的利息价值,从时间T1到T2可获得:
R(T1,T2)=exchangeRate(T2)/exchangeRate(T1)-1
此外,这种类型的抵押贷款的年化收益率(假设连续复利)可以计算为:
Y(T1,T2)=log(exchangeRate(T2)) — log(exchangeRate(T1))/(T2-T1)
虽然Compound流动性池支持USDT、USDC、DAI、FEI等多种稳定币资产,但这里我们只分析前两种稳定币,即USDT和USDC,它们的市值分别为800亿美元和530亿美元。它们合计占据了稳定币总市场的70%以上。
下面是根据上一节的公式计算出的年化日、周、月和半年收益率的图。日收益率有些波动,而周收益率、月收益率和半年收益率分别是之前图的平滑版本。USDT和USDC在图中有相对类似的模式,因为它们在2021年初都经历了高收益率和高波动性。这表明,有一些系统性的因素正在影响整个稳定的借贷市场。
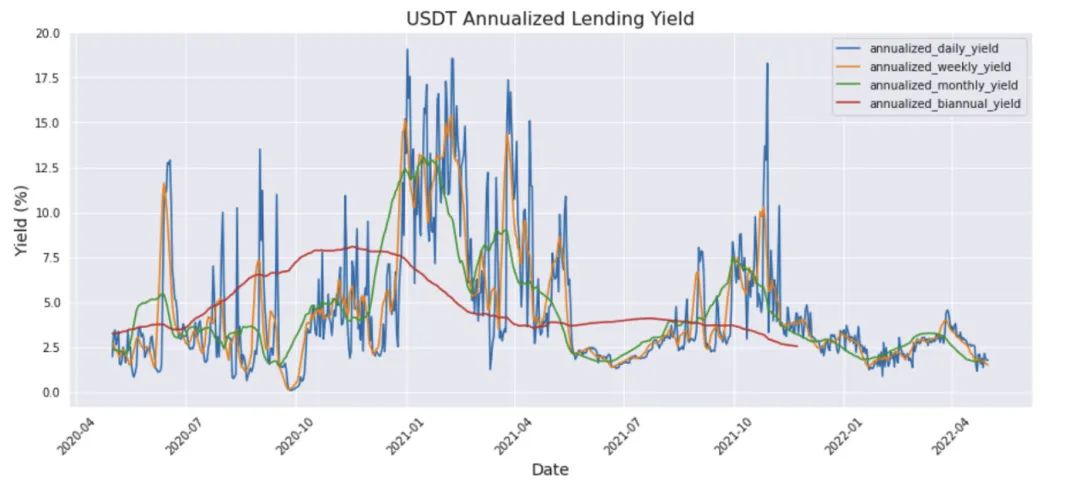
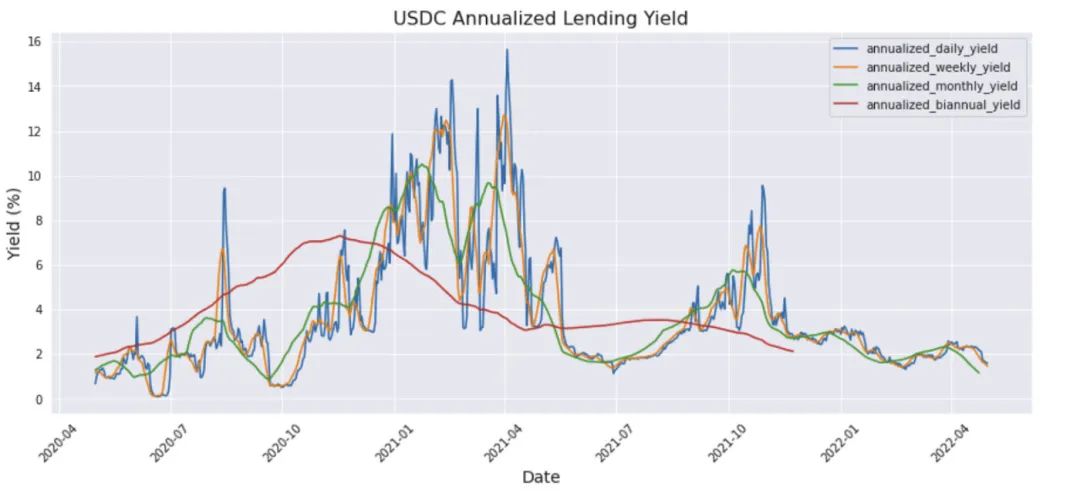
来源:the graph
可能影响贷款收益率的系统性因素是加密市场数据(如BTC/ETH的价格)及其相应的波动性。当BTC和ETH处于上升趋势时,一些追牛的投资者可能会从稳定币池中借款购买BTC/ETH,然后用购买的BTC/ETH作为抵押,再借入更多的稳定币,重复这个循环,直到杠杆达到预期水平。此外,当市场进入高波动性机制时,会有更多的中心化和去中心化的加密交易,这也会增加对稳定币的需求。
现在,为了检验稳定币收益率与加密货币市场数据的关系,我们使用以下公式进行简单的线性回归分析,看看有多少收益率的变化可以归因于价格和波动率因素:
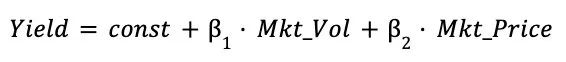
为了衡量这些因素的影响程度,我们使用R-Squared评分,其范围为[0,100%]。得分为100%意味着收益率完全由影响因素决定。
我们分别对BTC市场和ETH市场的USDC/USDT进行回归,得到如下R-Squared表:
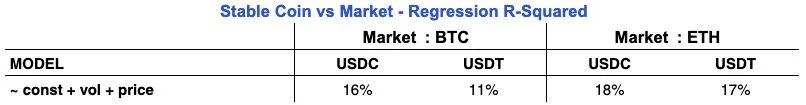
在决定USDC和USDT的收益率方面,ETH市场数据(18%和17%)比BTC市场数据(16%和11%)具有更好的解释力。这并不奇怪,特别是由于自2021年初以来,ETH在DeFi市场的人气和广度不断扩大。从这些结果可以看出,加密货币的价格和波动性因素并不能完全解释稳定币的收益率。我们可以得出结论,一定有其他因素有助于提高基本模型的分数。
我们通过引入稳定币历史供应数据和MACD技术指标价格数据对模型进行了进一步的探索性分析。稳定币供应量(提供给Compound流动性池的稳定币总数)应该直观地影响稳定币的可用性/稀缺性,并间接影响收益率。MACD是一个重要的动量交易信号,因为它可以帮助投资者决定何时杠杆化和何时去杠杆化。
我们看到R-Squared分数有了明显的提高,USDC和USDT都达到了大约60%-70%的水平,如下图所示。
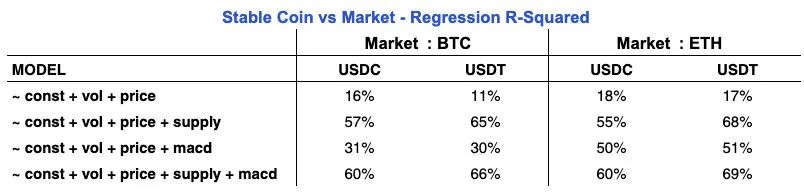
从这些数据中我们可以得出结论,稳定币的供应是一个重要的因素,因为它能够使两个市场中的任何一个稳定币的得分都达到60%左右。这似乎表明供应是影响稳定币借贷市场收益率的一个主要因素。这与传统经济世界非常相似。
MACD数据(关于BTC和ETH价格)的发布带来了喜忧参半的改善。以BTC市场为例,其独立贡献远远小于供给因素,仅超出供给边际效益几个百分点。然而,我们注意到,与BTC市场相比,在ETH市场,MACD对R-Squared的独立贡献更大。这表明稳定币借贷收益率与 ETH 中基于动量的交易活动的相关性高于 BTC。
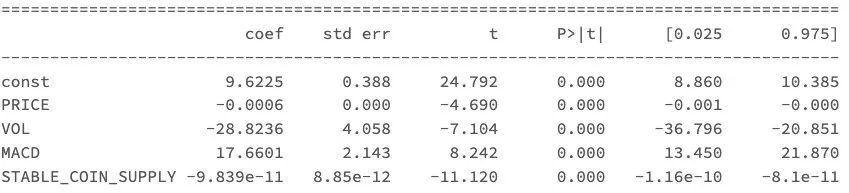
下图是ETH市场USDC贷款收益率回归系数的一个例子。该表表明,较高的ETH价格、波动性和稳定币供应通常与较低的USDC贷款收益率相关。同时,MACD信号越强,收益率越高。
与传统无风险收益率的比较
虽然揭示稳定币贷款低风险收益率的原因很有趣,但将这些收益率与TradFi市场的对应收益率进行比较也很重要。
因为稳定币借贷收益率来源于Compound平台抵押贷款的实现浮动利率,所以我们选择了传统货币市场使用的General Collateral(GC)利率作为可比无风险利率,因为它也是以国债作为贷款抵押品的浮动利率。
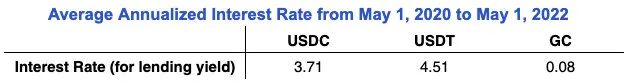
下图是分别获得USDC贷款收益率、USDT贷款收益率和GC利率收益率的投资组合价值的图表。所有投资都以2020-05-01的初始价值100美元开始,并于2022-05-01结束。如下图所示,USDT和USDC抵押贷款的收益率大大高于GC利率。另一方面,赚取GC利率的无风险投资在同一时期几乎没有增长。
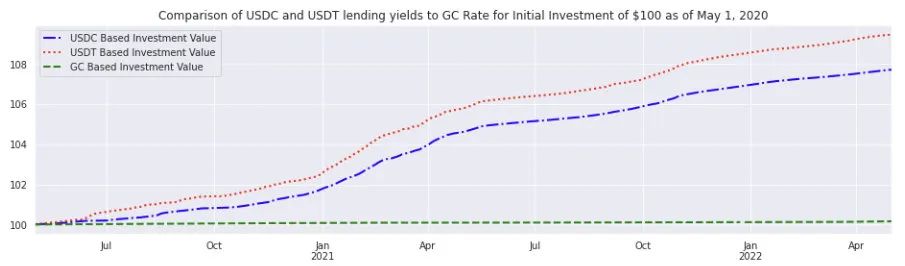
下表的平均利率也证实了GC利率平均在0.08%左右,而USDC和USDT在这段时间的贷款收益率分别为3.71%和4.51%,如下图所示。(我们还查看了2020 - 05年2年期国债收益率,仅为0.2%)。
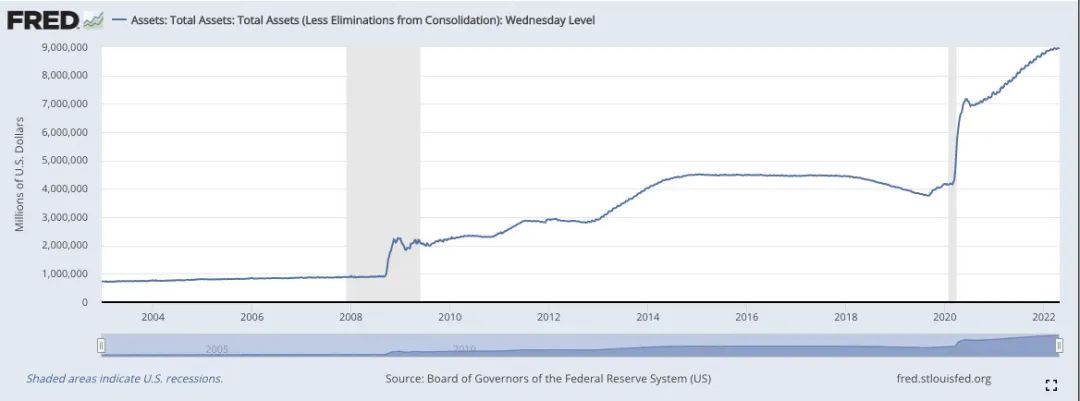
在可预见的未来,我们有理由得出这样的结论:至少在加密货币市场内,低风险利率将继续优于TradFi市场的无风险利率。其中一个原因是智能合约风险。然而,一个更大的原因是相对于整个加密经济的增长,稳定币供应的增长较慢。相比之下,自新冠以来,TradFi市场出现了大幅度的信贷增长,这有助于将无风险利率推至历史低点。
结论
该文对通过 DeFi 协议进行的稳定币抵押贷款提供的低风险收益进行了广泛的指示性分析。虽然这些收益率可能每天都在波动,但它们的总体趋势可以通过BTC/ETH价格、波动、稳定币供应和MACD(动量交易活动)进行较好地解释。我们还将这些收益率与TradFi市场的无风险收益率进行了比较,我们看到加密货币市场的持续表现优于其他市场。


