Risk Warning: Beware of illegal fundraising in the name of 'virtual currency' and 'blockchain'. — Five departments including the Banking and Insurance Regulatory Commission
Information
Discover
Search
Login
简中
繁中
English
日本語
한국어
ภาษาไทย
Tiếng Việt
BTC
ETH
HTX
SOL
BNB
View Market
Coin Metrics State of Ethereum Report: Will Low Gas Fees Be the New Normal?
Moni
Odaily资深作者
2021-07-11 04:20
This article is about 2595 words, reading the full article takes about 4 minutes
Three factors lead to lower gas costs

This article comes fromCoinmetrics, Original post by Nate Maddrey and the Coin Metrics team

Odaily Translator |

Odaily Translator |

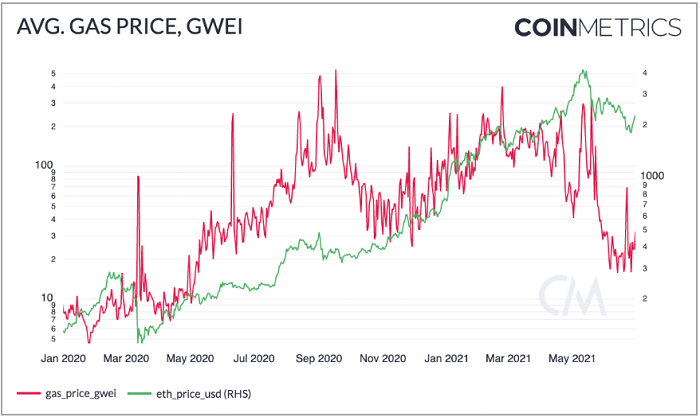
For Ethereum, the most recent concern has been the sharp drop in gas fees, which are now down to their lowest levels since March 2020. While a few months ago the average gas price regularly reached 150-200 GWEI, since the end of May it has dropped to the 15-30 GWEI range.

Above image source: Coin Metrics Formula Builder

Although the drop in Gas prices this time seems to be related to the slump in the price of ETH, in fact, since late April, the transaction fees on the Ethereum network began to drop, long before the market crash. On May 1, the Ethereum average The gas price has been as low as 40 GWEI.

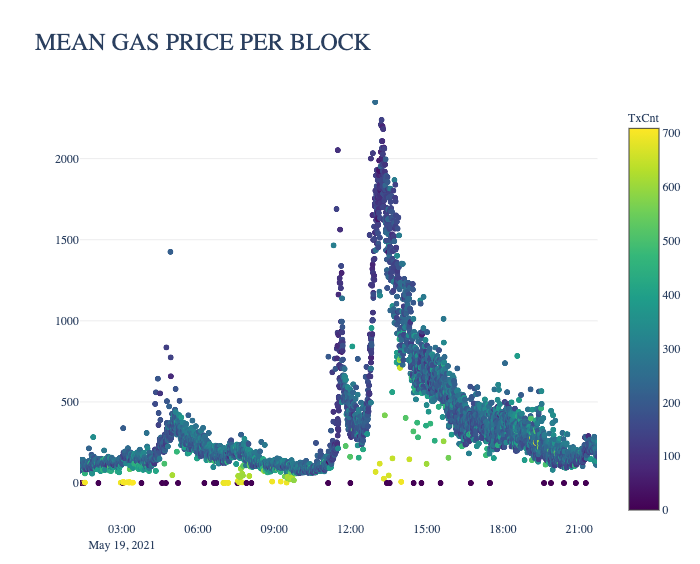
On May 12th and 19th, gas prices temporarily recovered to 250-300 GWEI, the two worst days for gas prices during the market turmoil. But after careful analysis, we found that the sharp increase in gas prices was caused by extreme market conditions and was relatively short-lived.

Around 11:00 UTC on May 19th, the average Ethereum gas price suddenly shot up from below 100 GWEI to over 2,000 GWEI in less than two hours, and then dropped to about 300 GWEI a few hours later .

Above image source: Coin Metrics Network Data Pro

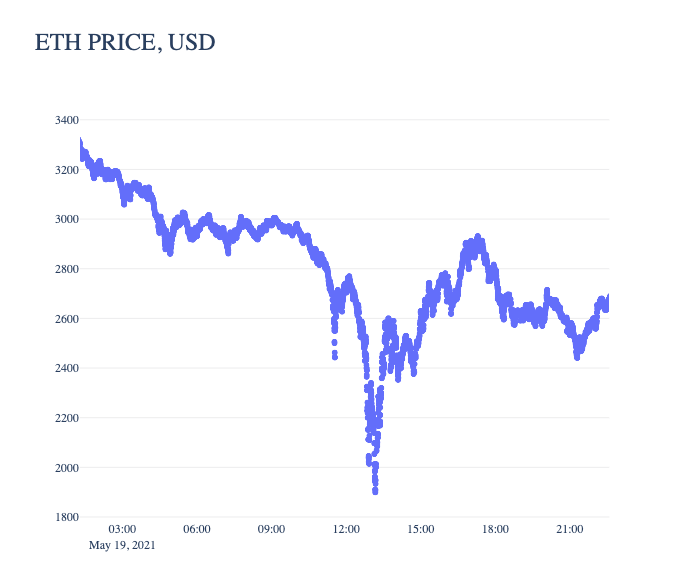
The extreme surge in gas prices was caused by one of the worst crashes in Ethereum history, when ETH prices fell from around $3,400 to below $1,900. The sudden market crash led to a spiral of DeFi liquidations, driving up gas prices as investors desperately tried to keep their collateral from being liquidated. According to AAVE's report, the total single-day liquidation of AAVE and Compound hit a record high on May 19.

Source of above image: Coin Metrics Network Data Pro

In fact, except for the relatively extreme situation on May 12 and May 19, the price of Ethereum gas mostly showed a downward trend.

So, why is the average gas fee in Ethereum dropping now? In fact, this is caused by a variety of factors, mainly three points:

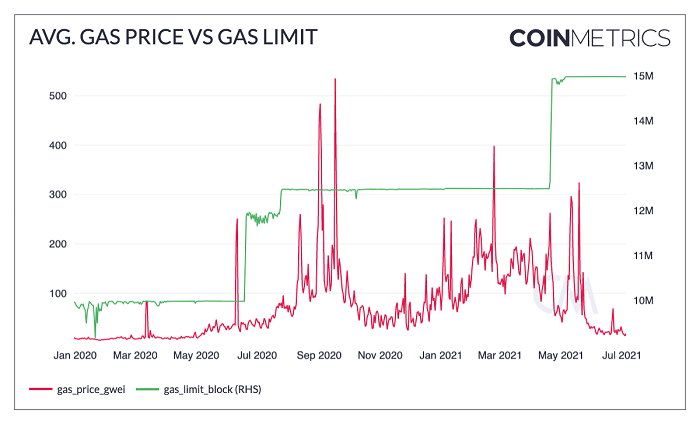
First of all, on April 22, 2021, the gas limit of Ethereum was increased to 15,000,000, which means that more transaction operations can be performed in each block, which helps to alleviate congestion.

Second, some Ethereum scaling solutions have made decent progress since late April.for example:

for example:

1. Polygon is Ethereum’s sidechain scalability protocol, which has gained momentum in the past few months and has been adopted by AAVE and other DeFi protocols.

2. Arbitrum was launched at the end of May this year, and it uses Optimistic Rollups to achieve network scalability.

Needless to say, as more and more transactions move to these scalability solutions, it will help eliminate congestion issues on Ethereum and further reduce gas prices.Finally, Flashbots is helping DeFi arbitrage bots to trade directly off the Ethereum blockchain.

With the rise of decentralized exchanges (DEXs) such as Uniswap, arbitrage bots have become "major contributors" to high gas fees. Since DEX transactions can be viewed in the mempool and on-chain, bots will monitor incoming transactions and then attempt to advance arbitrage or other profit opportunities. Timing is critical for this type of transaction, so these bots are often willing to pay extremely high gas prices in an attempt to outbid counterparties and confirm their own transactions first. But now, Flashbots has begun to transfer this bidding process to the parachain, which is successfully separated from the Ethereum main chain, which obviously helps to reduce gas fee competition on the Ethereum blockchain and lower the overall gas price.

Lower gas prices have led to lower overall ETH fees over the past two months, and more importantly, with EIP-1559 set to go live in early August, gas fees are likely to drop further with another potential consequence: EIP- After the deployment of 1559, the transaction fees consumed on the Ethereum blockchain network will be greatly reduced.

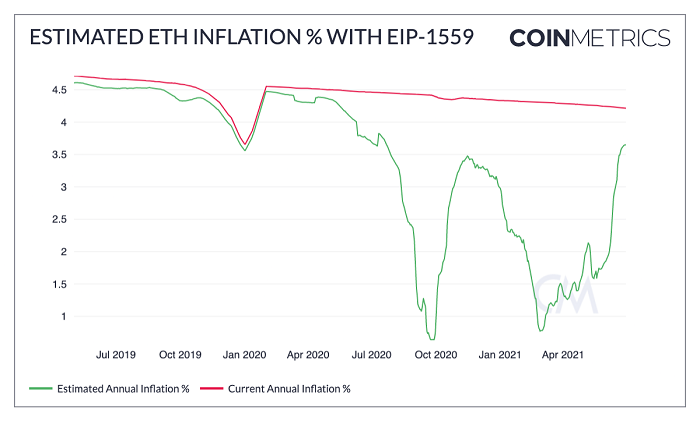
The chart below shows what would happen to ETH's annual inflation rate (30-day average) if EIP-1559 caused 75% of gas fees to be burned. (Note: For now, the specific percentage of the gas fee destroyed after EIP-1559 goes online is not yet available. We can only refer to historical data by subtracting 75% of the daily fee from the number of ETH issued daily. % estimated.)

In March and early April 2021, ETH annual inflation had fallen below 2% amid high Ethereum gas fees, but it had risen to 3.5% after network fees dropped in May above. Even so, this figure will still be significantly lower than ETH's current annual inflation rate (it won't be as low as previously estimated), but gas fees will likely continue to fluctuate over time. If the total gas cost eventually rises, Ethereum can still use the EIP-1559 fee consumption mechanism to ensure that the annual inflation rate of ETH decreases.

Driven by these factors, could low gas fees become the new normal for the Ethereum network? Quite frankly, this issue has caused widespread concern in the crypto community.

For a detailed description of the Ethereum gas mechanism and how it will change after EIP-1559, see the Ethereum Gas report. To track the data used in this article and explore other on-chain metrics, check out the associated charting tool, formula generator, correlation tool, and mobile app for free.

secondary title

Ethereum and Bitcoin Network Data Insights

Indicator summary

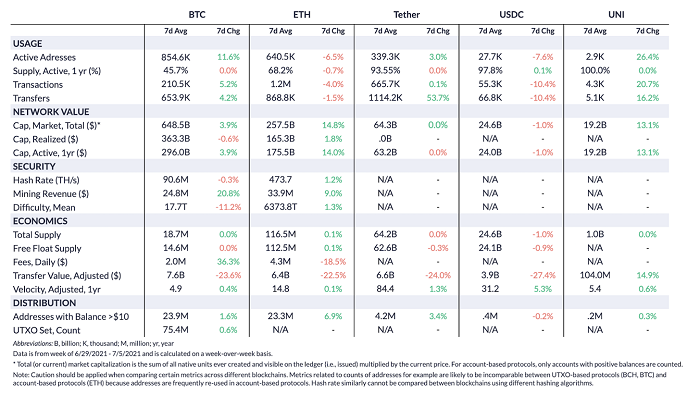
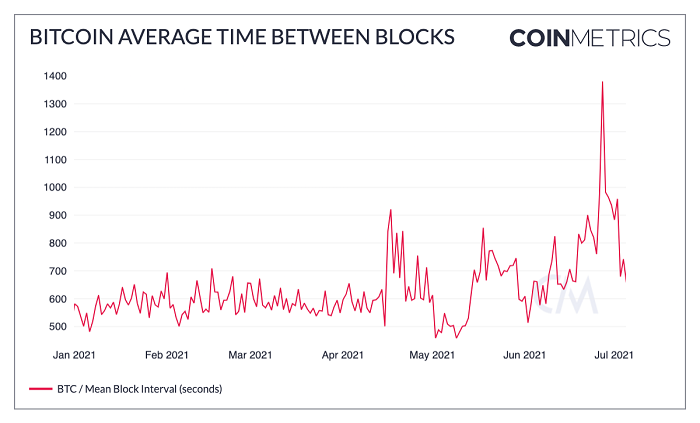
We found that Bitcoin active addresses increased by 11.6% week-on-week, but at the same time, Ethereum active addresses decreased by 6.5%. After briefly surpassing Bitcoin last week, the number of active Ethereum addresses did not increase much, and now it is surpassed by Bitcoin again. Bitcoin usage fell last week as the average time between blocks spiked, resulting in fewer Bitcoin blocks being added to the blockchain than usual. The increase in block times may be due to a decrease in network hashrate, which may reduce the number of blocks mined. On June 27, the computing power of Bitcoin's entire network fell to the lowest level since 2019, but since last week, the computing power seems to have gradually stabilized.

secondary title

Ethereum and Bitcoin Network Highlights

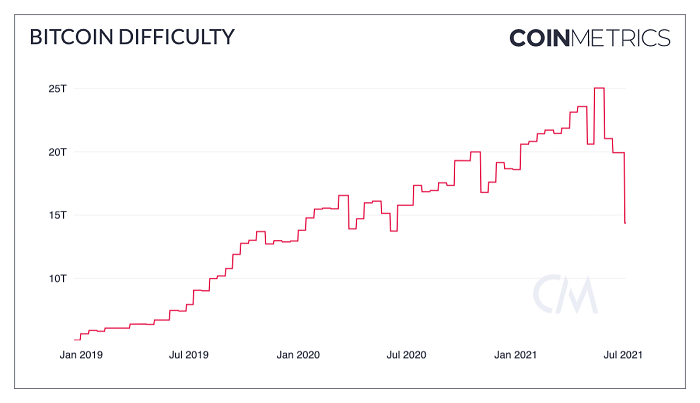
On July 3, Bitcoin mining difficulty decreased by about 28% (as shown in the chart below), which is the largest difficulty reduction in Bitcoin history. Despite the relatively large drop in the computing power of the entire Bitcoin network in the past month, the original design of the Bitcoin network can better adapt to network changes and ensure network security.

Source of above image: Coin Metrics Network data chart

Since the Bitcoin mining difficulty adjustment, the average network block time has dropped to about 658 seconds, which is very close to the initial block time goal of 10 minutes.

Source: Coin Metrics Network data chart

ETH
Welcome to Join Odaily Official Community